Tailoring conductive network Zn@NPC@MWCNTs nanocomposites derived from ZIF-8 as high-performance electromagnetic absorber for the whole X-Band
Shi-in Lu ,Ying Meng ,Hi-o Wng ,Xin-wei Jing ,Jin Yng ,Ning Wei ,Lin Jin ,Li-jun Wn ,Ho Tng ,Qin-qin Hou
a Anhui Province Key Laboratory of Simulation and Design for Electronic Information System, Hefei Normal University, Hefei, 230601, PR China
b Universities Joint Key Laboratory of Photoelectric Detection Science and Technology in Anhui Province, Hefei Normal University, Hefei, 230601, PR China
Keywords: ZIF-8 Electromagnetic wave absorption X-band C-Band
ABSTRACT A porous 3D cross-linked conductive network pierced by multi-wall carbon nanotubes (MWCNTs) was successfully designed from zeolitic imidazolate framework-8 (ZIF-8).Zn@NPC@MWCNTs composites were tailored by the facile regulating the mass ratios and thermal annealing treatment.Due to the combination of less eddy current loss and dielectric loss together with multiple reflection attenuation caused by a unique structure.With a 10 wt%filler loading,the Zn@NPC@MWCNTs composites carbonized at 800 ℃ show two high reflection loss (RL) values with different thicknesses.An RL value is -53.18 dB with 4.09 mm thickness in the C-Band (4-8 GHz),and a minimum RL can reach -74.83 dB (10.8 GHz)with a matching thickness of 2.749 mm.The effective absorption bandwidth is 4 GHz(from 8 to 12 GHz,RL ≤-10 dB),which just covers the full X-band.Low cost and easy preparation can also provide advantages to develop MOF-based materials as effective EMW absorbents.
1.Introduction
Nowadays,a lot of different electronic equipment are appearing in human life,which brings great facilitation.However,electromagnetic (EM) radiation and electromagnetic interference (EMI)caused by these electronic devices have attracted much attention,not only interfering with other normal operating electronic devices but also affecting human health [1-5].To eliminate this harmful radiation and interference,researchers are looking for materials that can absorb unnecessary electromagnetic waves.
For the reason of strong dielectric loss,low density,high thermostability and adjustable conductivity,carbon materials become a good electromagnetic wave absorbing material [6],such as graphene [7],carbon nanofibers [8],carbon nanotubes [9]and nanoporous carbon (NPC) [10].Nevertheless,it is difficult to achieve the requirement of the wide-band for pure dielectric loss material [11],due to limited loss mechanism and inferior impedance matching.Metal-organic frameworks (MOFs) are a class of porous composites including metal ions coordinated to organic ligands to form diverse structures,which have low density,high porosity and excellent thermal stability [12].In recent years,nanocomposites derived from MOFs can be used for electromagnetic wave absorption [13-16].The characteristics of high surface area and porous structure are beneficial in promoting the EM wave multiple reflections while reducing the density of the absorbing material[17].For example,Liu et al.[13]prepared Fe nanoparticles via encapsulating iron precursor in ZIF-8.The Fe/C composite exhibited a minimum RL of-29.5 dB with 15 wt%filler loading with 2.5 mm thickness.Zhang et al.[18]reported a ZIF-67-derived Fe-Co/NPC composite material.The minimal RL was -21.7 dB and the effective absorption bandwidth(EAB)can attain 5.8 GHz.Li and co-authors [19]synthesized hollow Co/C microspheres using ZIF as a precursor.The bandwidth below-10 dB can attain 4.4 GHz,and theRLminis -31.3 dB with 2.0 mm thickness.Liang et al.[20]fabricated Zn@NPC/3DPCN improving the impedance matching and providing more contact sites,which showed the minimalRLvalue of -35.7 dB with 10 wt% filler loading.Li et al.[21]synthesized the Fe2C/Fe3O4/C/RGO nanocomposite derived from the Fe-MOF precursor.TheRLof the absorber can reach -60 dB with a thickness of 2.3 mm,which is attributed to dipole polarization relaxation and multiple interfacial polarization [15].Furthermore,MWCNTs@carbonaceous CoO composites have also been synthesized by our group and the minimalRLattained -50.2 dB [22].Therefore,it is a feasible method for combining carbon-based materials with ZIF-67/ZIF-8 to obtain excellent EM wave absorbers.
In this paper,Zn-ZIF with MOFs structure modified by MWCNTs were researched by wet chemistry and carbonization procedure.ZnO was generated from ZIF-8@MWCNTs at 600 ℃.Interestingly,when the annealing temperature was 700 ℃ and 800 ℃,ZnO was all reduced to Zn.Zn@NPC@MWCNTs compounds were attained.When the content of compound hybrids was 10%,the minimalRLof the absorber could attain-74.83 dB at 10.8 GHz with a thickness of 2.749 mm and the EAB covered the full X-band (8-12 GHz).Compared with other composites derived from MOFs,the Zn nanoparticles as ornaments were homogeneously distributed on the surface of NPC with a hollow regular dodecahedron structure,and the NPC was penetrated by MWCNTs and intertwined with each other.Consequently,a 3D cross-linked NPC network was fabricated,which exhibits extraordinary absorption performances,attributing to ideal impedance matching from the synergy of dipole polarization,dielectric loss and lower magnetic loss,and strong attenuation from composite multiple reflection structure.To sum up,the unique structure and excellent electromagnetic wave absorbing properties make the Zn@NPC@MWCNTs composites can be a promising candidate for absorbing materials of EM wave.
2.Experimental section
2.1. Materials
Ethanol (C2H6O,99%),methanol (CH3OH,99%) and Zinc nitrate hex hydrate(Zn(NO3)2·6H2O,99%)were obtained from Sinopharm Chemical Reagent Co.,Ltd.MWCNTs were purchased from Nanjing XFNANO Materials Technology Co.,Ltd.2-methylimidazole (2-MeIm,98%) were procured from Shanghai Aladdin Bio-Chem Technology Co.,Ltd.
2.2. Synthesis of ZIF-8 and ZIF-8@MWCNTs
100 mg,150 mg and 200 mg MWCNTs were dissolved with 150 mL methanol and ultrasonic treatment for 1 h.Then,three parts of 2.379 g Zn(NO3)2·6H2O with 100 mL methanol were added to the above solutions.After 4 h of stirring,three copies of 1.314 g 2-MeIm with 100 mL methanol were rapidly poured into the above mixture and stirred at room temperature for 24 h.The black compounds were gathered by centrifugation,washed several times with ethanol,and then under a vacuum dried at 60 ℃ for 12 h.The attained resultants were all ZIF-8@MWCNTs,which were separately called samples S-1,S-2 and S-3.
2.3. Synthesis of Zn@NPC@MWCNTs
The above samples were calcined at 600 ℃.Argon acted as a protective gas in the process of calcination.The annealing time lasted 4 h and the heating rate was 5 ℃/min.The end products were called samples 600-1,600-2 and 600-3,respectively.The sample S-3 was also calcined at 700 ℃ and 800 ℃ to discuss the influence of calcination temperature on EM wave absorption performances.The obtained products were separately termed as samples 700-3 and 800-3.
Fig.1 shows the synthesis schematic diagram for the preparation of ZnO@NPC@MWCNTs and Zn@NPC@MWCNTs.The characterization instruments and main parameters were presented in the Supporting Information.
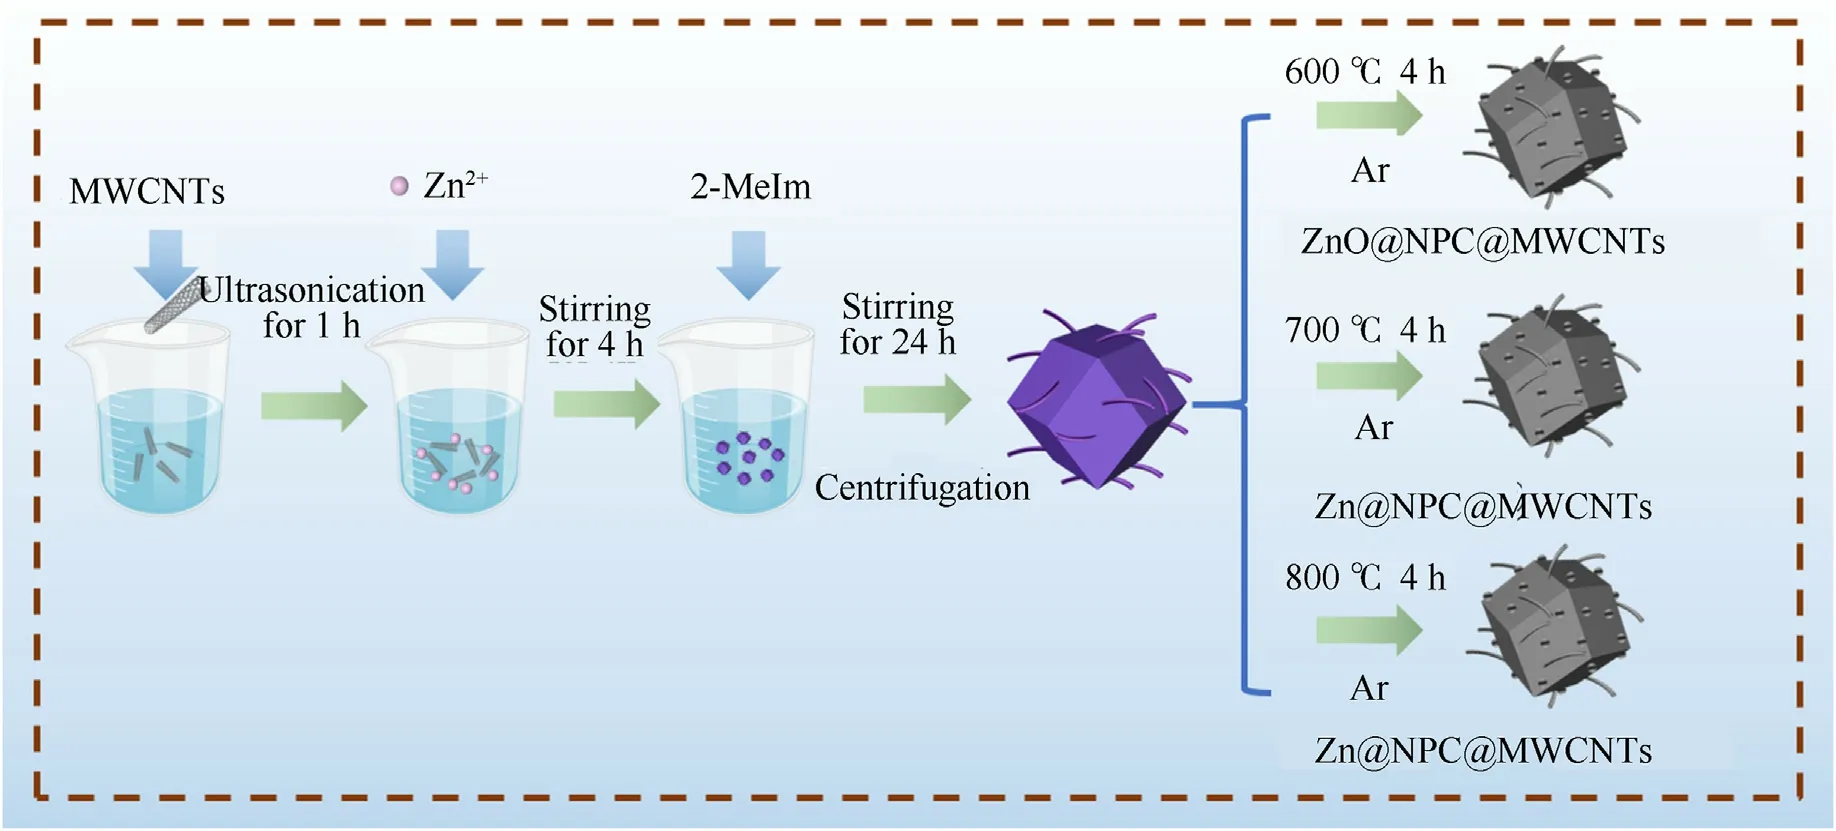
Fig.1.Synthesis schematic diagram for preparation of ZnO@NPC@MWCNTs and Zn@NPC@MWCNTs.
3.Results and discussion
Fig.2(a) describes the X-ray diffraction (XRD) peaks of ZIF-8,MWCNTs,ZIF-8@MWCNTs and simulated-ZIF-8.The peaks located at 26°(002) (JCPDS No.41-1487) is the feature peak for MWCNTs.The diffraction peaks of ZIF-8 are identical to those of simulated-ZIF-8,indicating that the obtained resultants are high purity [23].The samples were pyrolyzed at 600 ℃,700 ℃ and 800 ℃.XRD diffraction peaks were shown in Fig.2(b).The sample 600-3 has feature peaks at 2θ=31.7°,34.4°,36.2°and 56.6°originated from the (110),(002),(101) and (110) crystals planes of ZnO(JCPDS No.36-1451).But for samples 700-3 and 800-3,there are no feature peaks of ZnO and it is difficult to recognize the diffraction peaks associated with Zn species in samples.Because the calcination temperature reaches 700℃ or 800℃,ZnO was reduced to Zn nano-particles[24]during carbothermal reduction,which can be described as
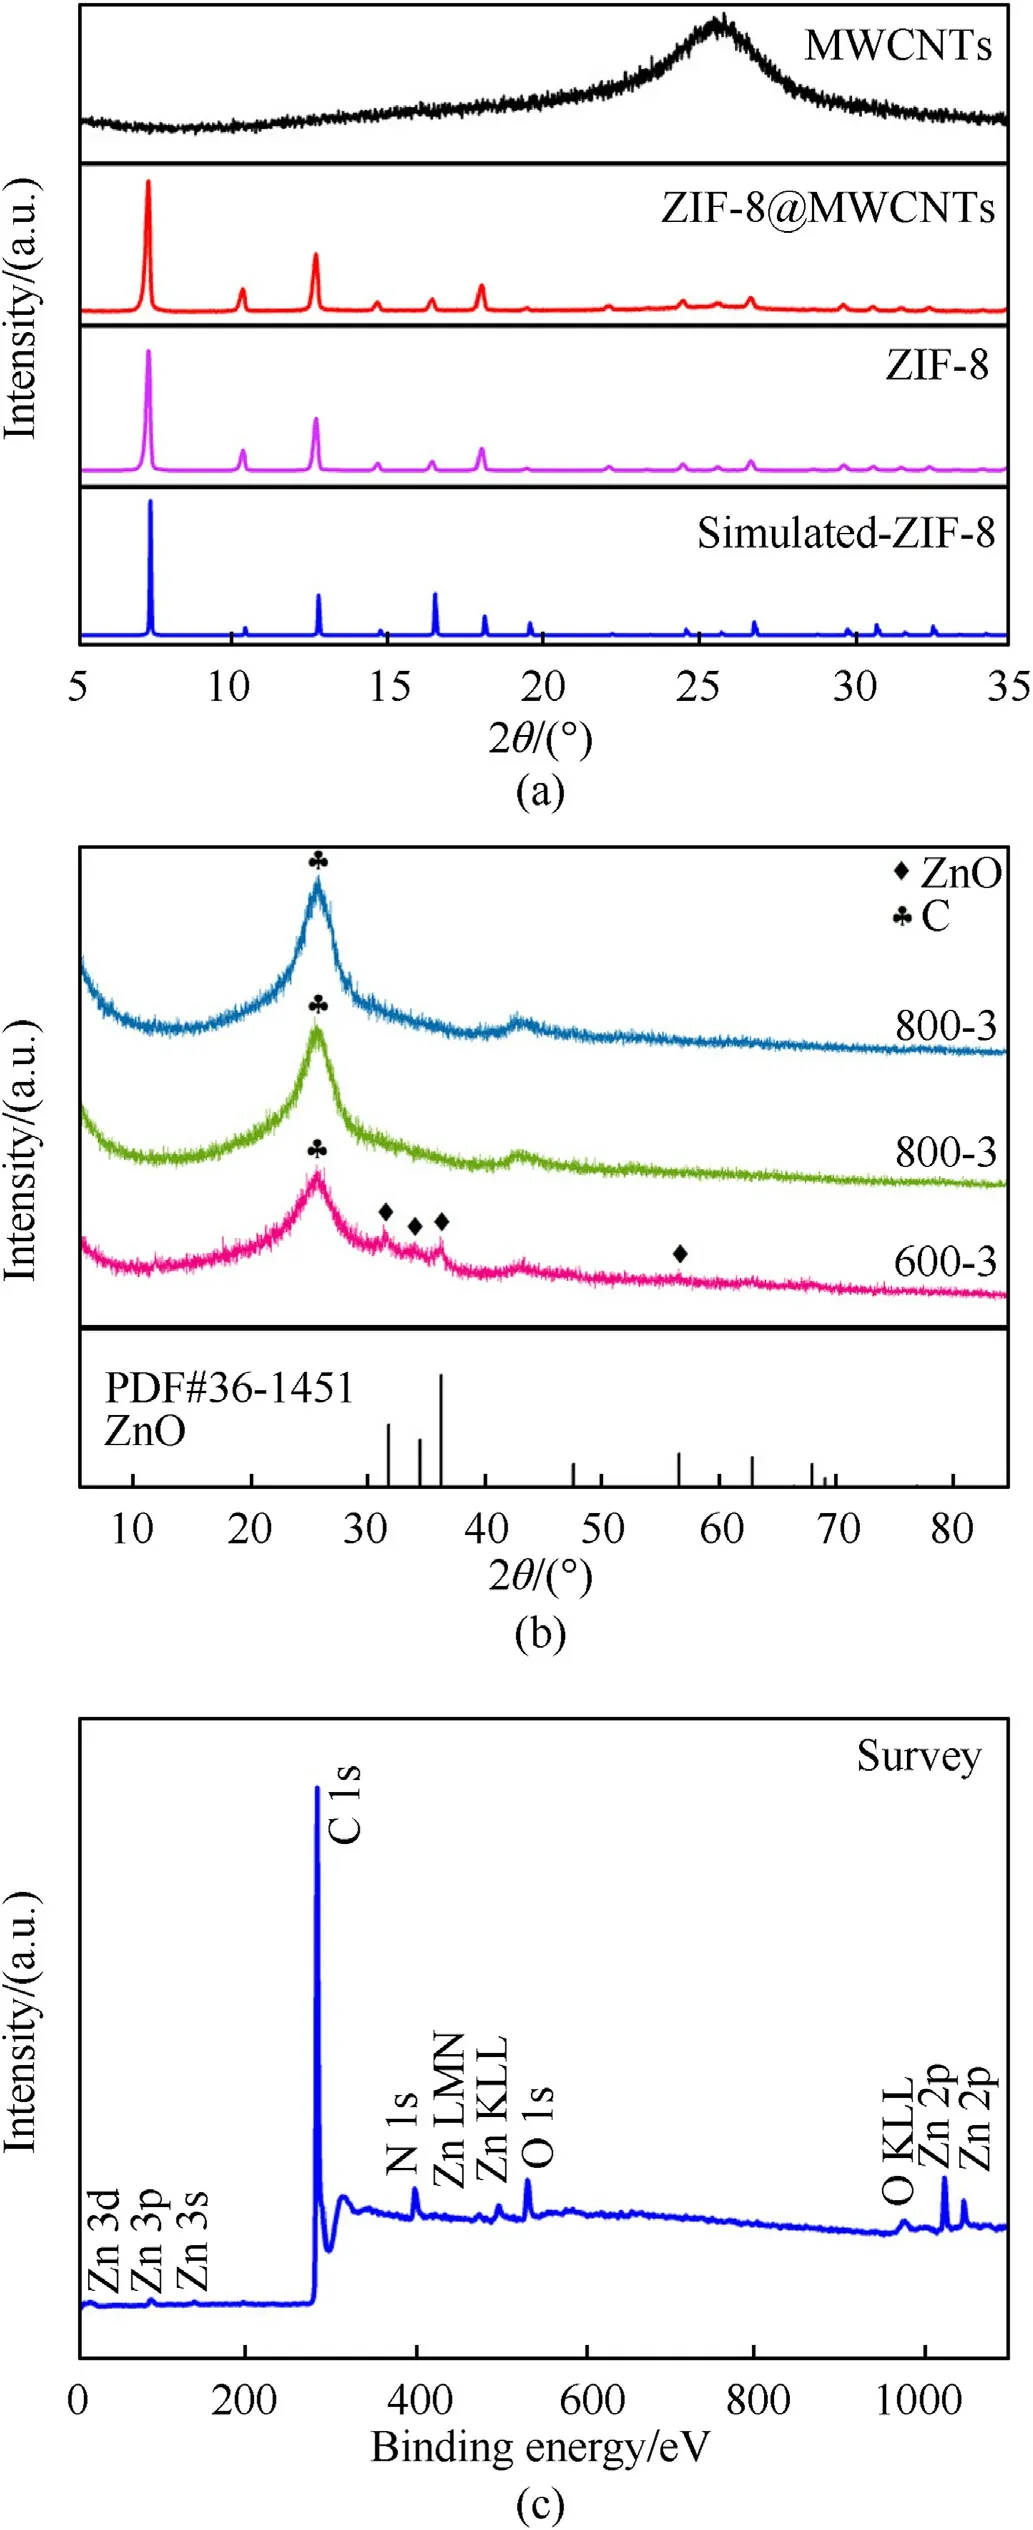
Fig.2.(a) XRD diffraction peaks of ZIF-8,MWCNTs,ZIF-8@MWCNTs and simulated-ZIF-8;(b) XRD diffraction peaks of samples 600-3,700-3 and 800-3;(c) XPS survey scan for sample 800-3.
According to the Tammann temperature rule [25],lots of Zn nano-particles were vaporized as the calcination temperature over 600 ℃ and only a little amount of Zn exists in sample 800-3.Hence,the sample 800-3 is constitutive of C,MWCNTs and Zn.The chemical composition of Zn@NPC@MWCNTs composites for sample 800-3 was investigated via X-ray photoelectron spectroscopy(XPS),as displayed in Fig.2(c).The full spectrum unravels that Zn@NPC@MWCNTs composites contain O,N,Zn and C four elements.
Fig.3(a)shows the Raman spectra of samples 600-3,700-3 and 800-3.The two distinct peaks are attributed to carbon,which is called the band D(~1337 cm-1)and the band G(~1576 cm-1).The band D drives from amorphous carbon,while the band G is mainly ascribed to graphite carbon [2].The value ofID/IGreflects the graphitization degree [26].TheID/IGratios for composites 600-3,700-3 and 800-3 are 0.98,1.02 and 1.05,respectively.Therefore,the graphitization of carbon is declined as the calcination temperature increases,indicating a higher deposition of amorphous carbon and more carbon defects,which can provide more polarization sites,generating the dipole polarization loss under the alternating electromagnetic field [27].
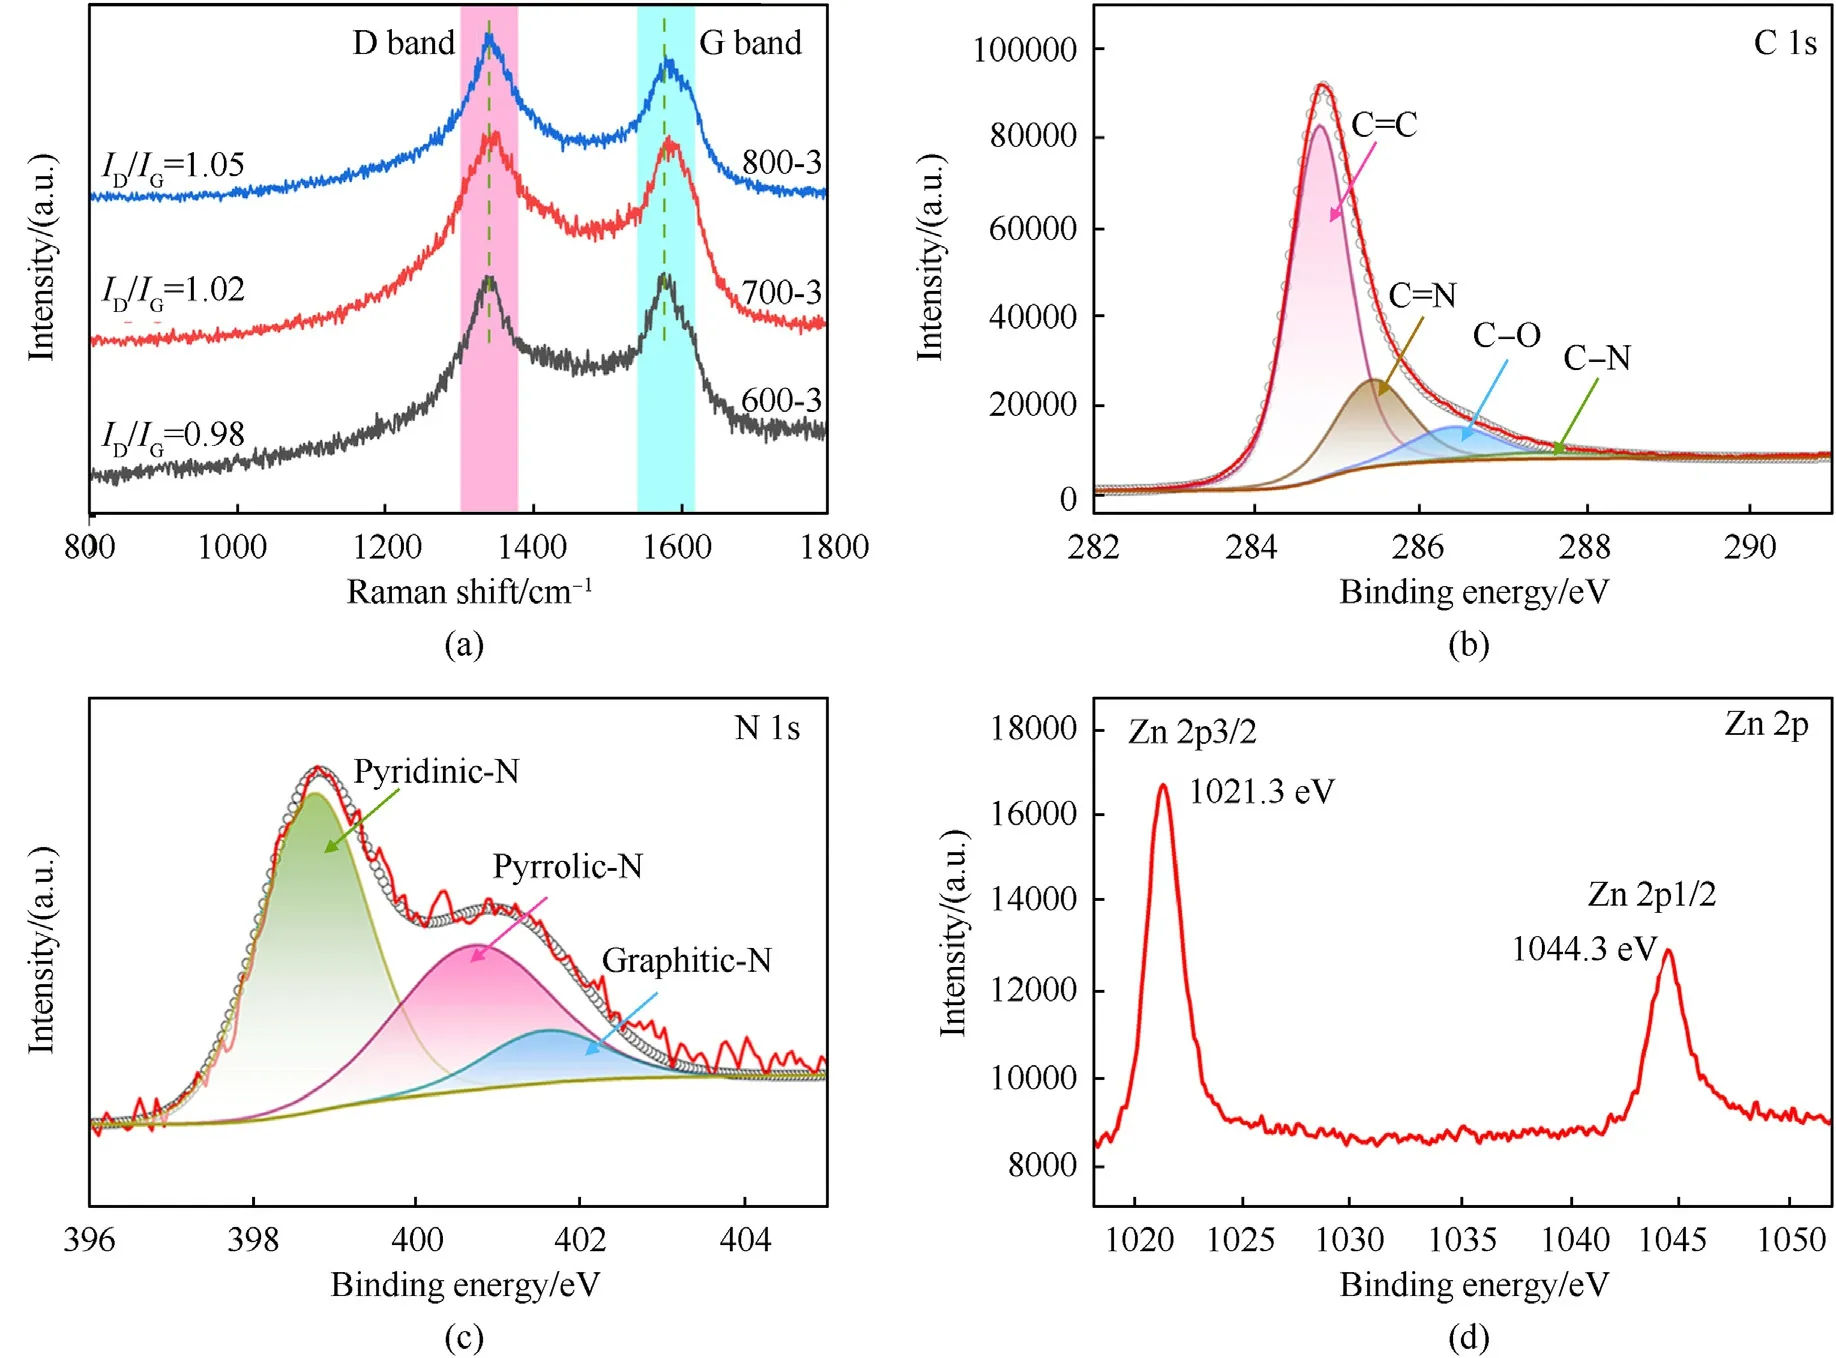
Fig.3.(a) Raman spectra of samples 600-3,700-3 and 800-3;(b) XPS spectra of C 1s;(c) N 1s and (d) Zn 2p of Zn@NPC@MWCNTs nanoparticles for sample 800-3.
There are four peaks in C 1s spectra,as shown in Fig.3(b).The main peak of C=C is 284.75 eV according with the graphite-like sp2C.The peaks at 285.39 eV and 287.48 eV separately correspond to N-sp2C(C=N)and N-sp3C(C-N)bonds[28,29].The peak of C-O at 286.38 eV reflects a diverse bonding structure of C-O bonds,indicating that some oxygen functional groups exist on the surface of Zn@NPC@MWCNTs nanoparticles [30].The ratios of the C=C,C=N,C-O and C-N are 63.8%,24.2%,7.7%and 4.3%,respectively,as exhibited in Fig.S1.The N 1s spectra include three feature peaks:Pyridinic-N (398.75 eV),Pyrrolic-N (400.69 eV) and Graphitic-N(401.56 eV) [31,32](Fig.3(c)).Pyridinic-N and Pyrrolic-N refer to the N atoms,which are located in a π system and separately contribute to the π system with one or two p-electrons [33,34].Graphitic-N refers to the N atoms replacing the C atoms inside of the graphene layers [34],which are more thermodynamically stable at the edges of graphene lattice,in accord with theoretical prediction [29].The Zn 2p3/2 and Zn 2p1/2 signals appeared at 1021.3 eV and 1044.3 eV (Fig.3(d)),respectively,indicating the existence of Zn in the Zn@NPC@MWCNTs composites [35,36].The Zn 2p XPS spectra of samples 600-3 and 700-3 are presented in Fig.S2(a)and Fig.S2(b).It is obvious that the peak intensities of Zn 2p3/2 and Zn 2p1/2 for samples 600-3 and 700-3 are much higher than that of sample 800-3,suggesting that the content of Zn element was decreased with the calcination temperature rising.The C 1s XPS spectra of samples 600-3 and 700-3 are depicted in Fig.S2(c)and Fig.S2(d).The peak intensity of C-O for sample 800-3(Fig.3(b)) is higher than those of samples 600-3 and 700-3,implying that the carbon-oxygen functional group could be enhanced with an increment of calcination temperature.It can be explained that more amorphous carbon will combine into more C-O bonds,which is consistent with the result of Fig.3(a).
The morphology and microstructure of Zn@NPC@MWCNTs were researched through scanning electron microscopy(SEM)and transmission electron microscopy (TEM).As depicted in Fig.4(a)-Fig.4(d),the sizes of ZIF-8 nanoparticles and ZIF-8@MWCNTS are both approximately 500 nm with a dodecahedron porous structure.After the calcination treatment process,the composites still retained the original shape,manifesting this structure has high stability.Moreover,the long and curved MWCNTs are intertwined and established a 3D interconnected network benefiting electron hopping and migration[37],as shown in Fig.4(e).The TEM image of Zn@NPC@MWCNTs hybrids strung by MWCNTs (sample 800-3) is presented in Fig.4(f).The distribution of elements in sample 800-3 was analyzed through EDS mapping,as presented in Fig.S3.Results reveal that three elements N,O and Zn are distributed on the 3D interconnected carbon network frameworks,which is consistent with XPS survey scan in Fig.2(c).
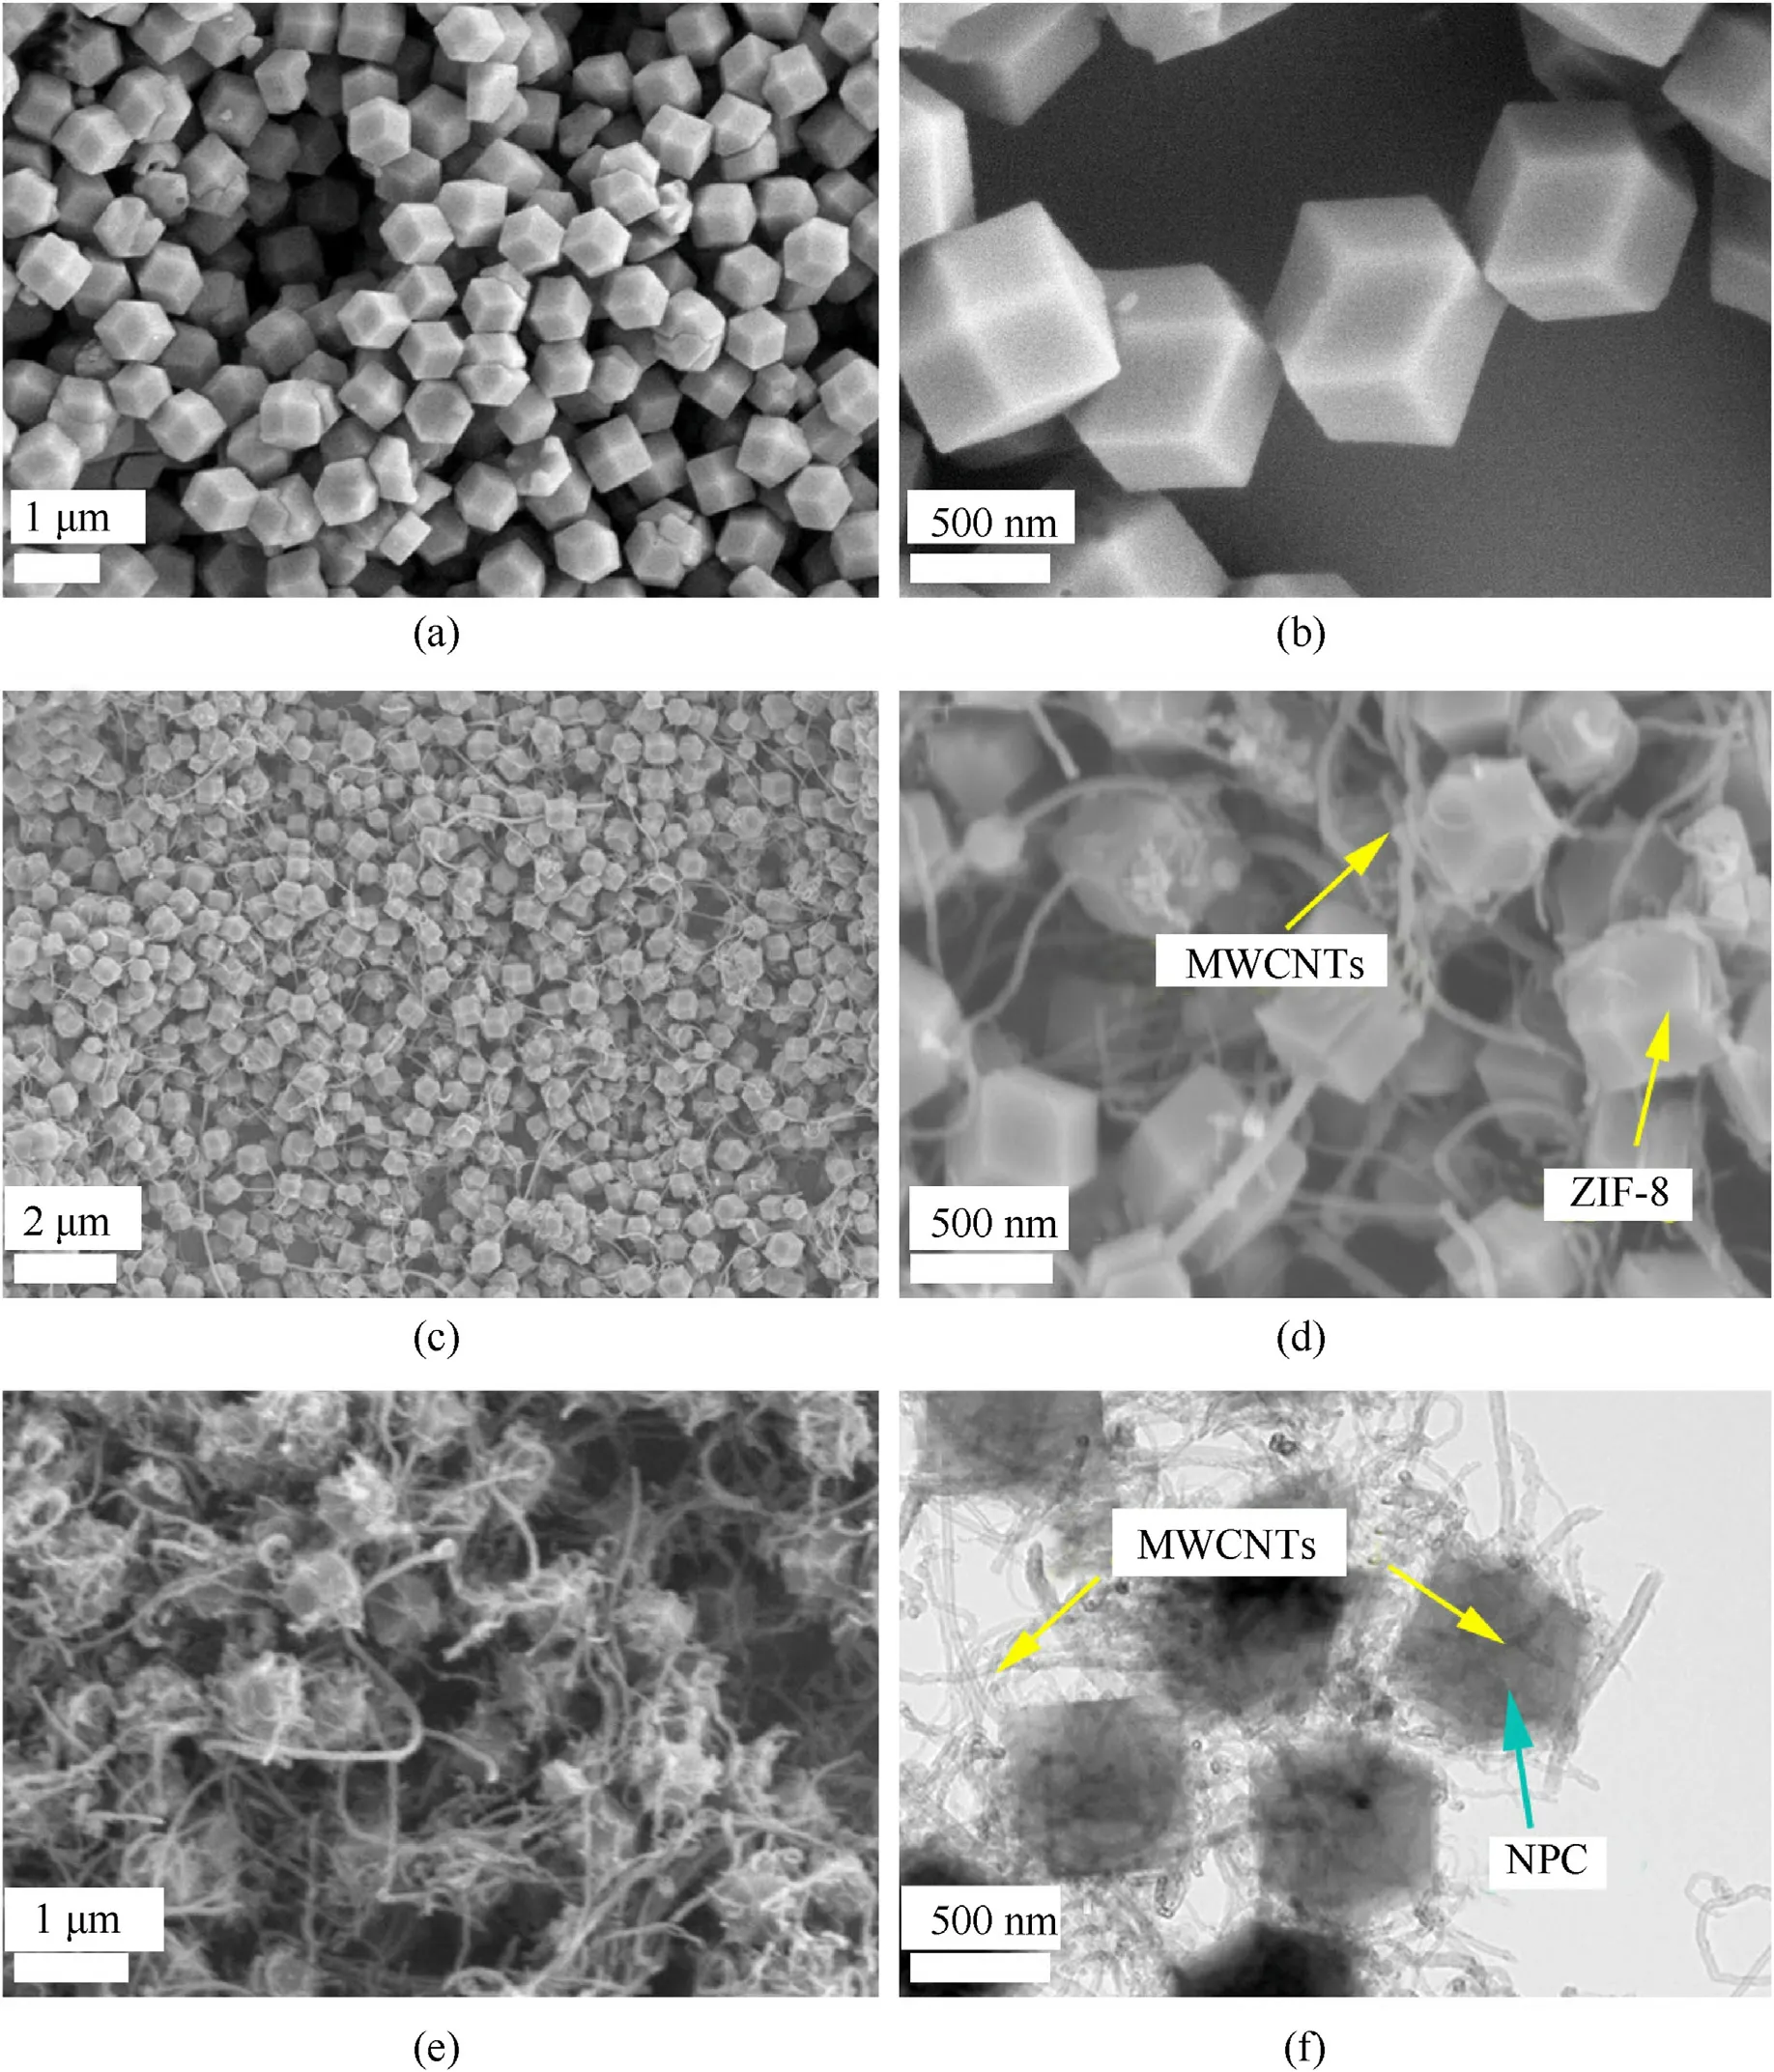
Fig.4.(a)Low and(b)high-resolution SEM images of ZIF-8,(c)low and(d)HR-SEM images of ZIF-8@MWCNTs,(e)SEM and(f)TEM images of Zn@NPC@MWCNTs for sample 800-3.
The electromagnetic parameters of absorbers have an important influence on the EMW absorption performances,which include the relative permittivity (εr=ε′-jε'′) and relative permeability(μr=μ′-jμ'′) [38].ε′,μ′and ε′′,μ′′denote storage faculty and loss capability of electric and magnetic energy,respectively [39,40].Fig.5(a)-Fig.5(d)show the EM parameters of samples 600-1,600-2,600-3.Due to the influence of high-frequency electric field variation on polarization hysteresis [41-43],the ε′of all samples descend with the increase of frequency,which can be called frequency dispersion behavior.However,three samples corresponding to ε′′are relatively stable in the range of the whole frequency.Fig.5(c) and Fig.5(d) exhibit the values of μ′and μ′′for samples 600-1,600-2 and 600-3 change a little in the whole frequency.The dielectric loss tangent (tanδE=ε′′/ε′) and magnetic loss tangent(tanδM=μ′′/μ′)are described in Fig.5(e)and Fig.5(f).Obviously,the tanδEof sample 600-1 is the least.For samples 600-2 and 600-3,the tanδEvalues are not very different and between 0.1 and 0.2.However,the tanδMvalues of three samples change a little.
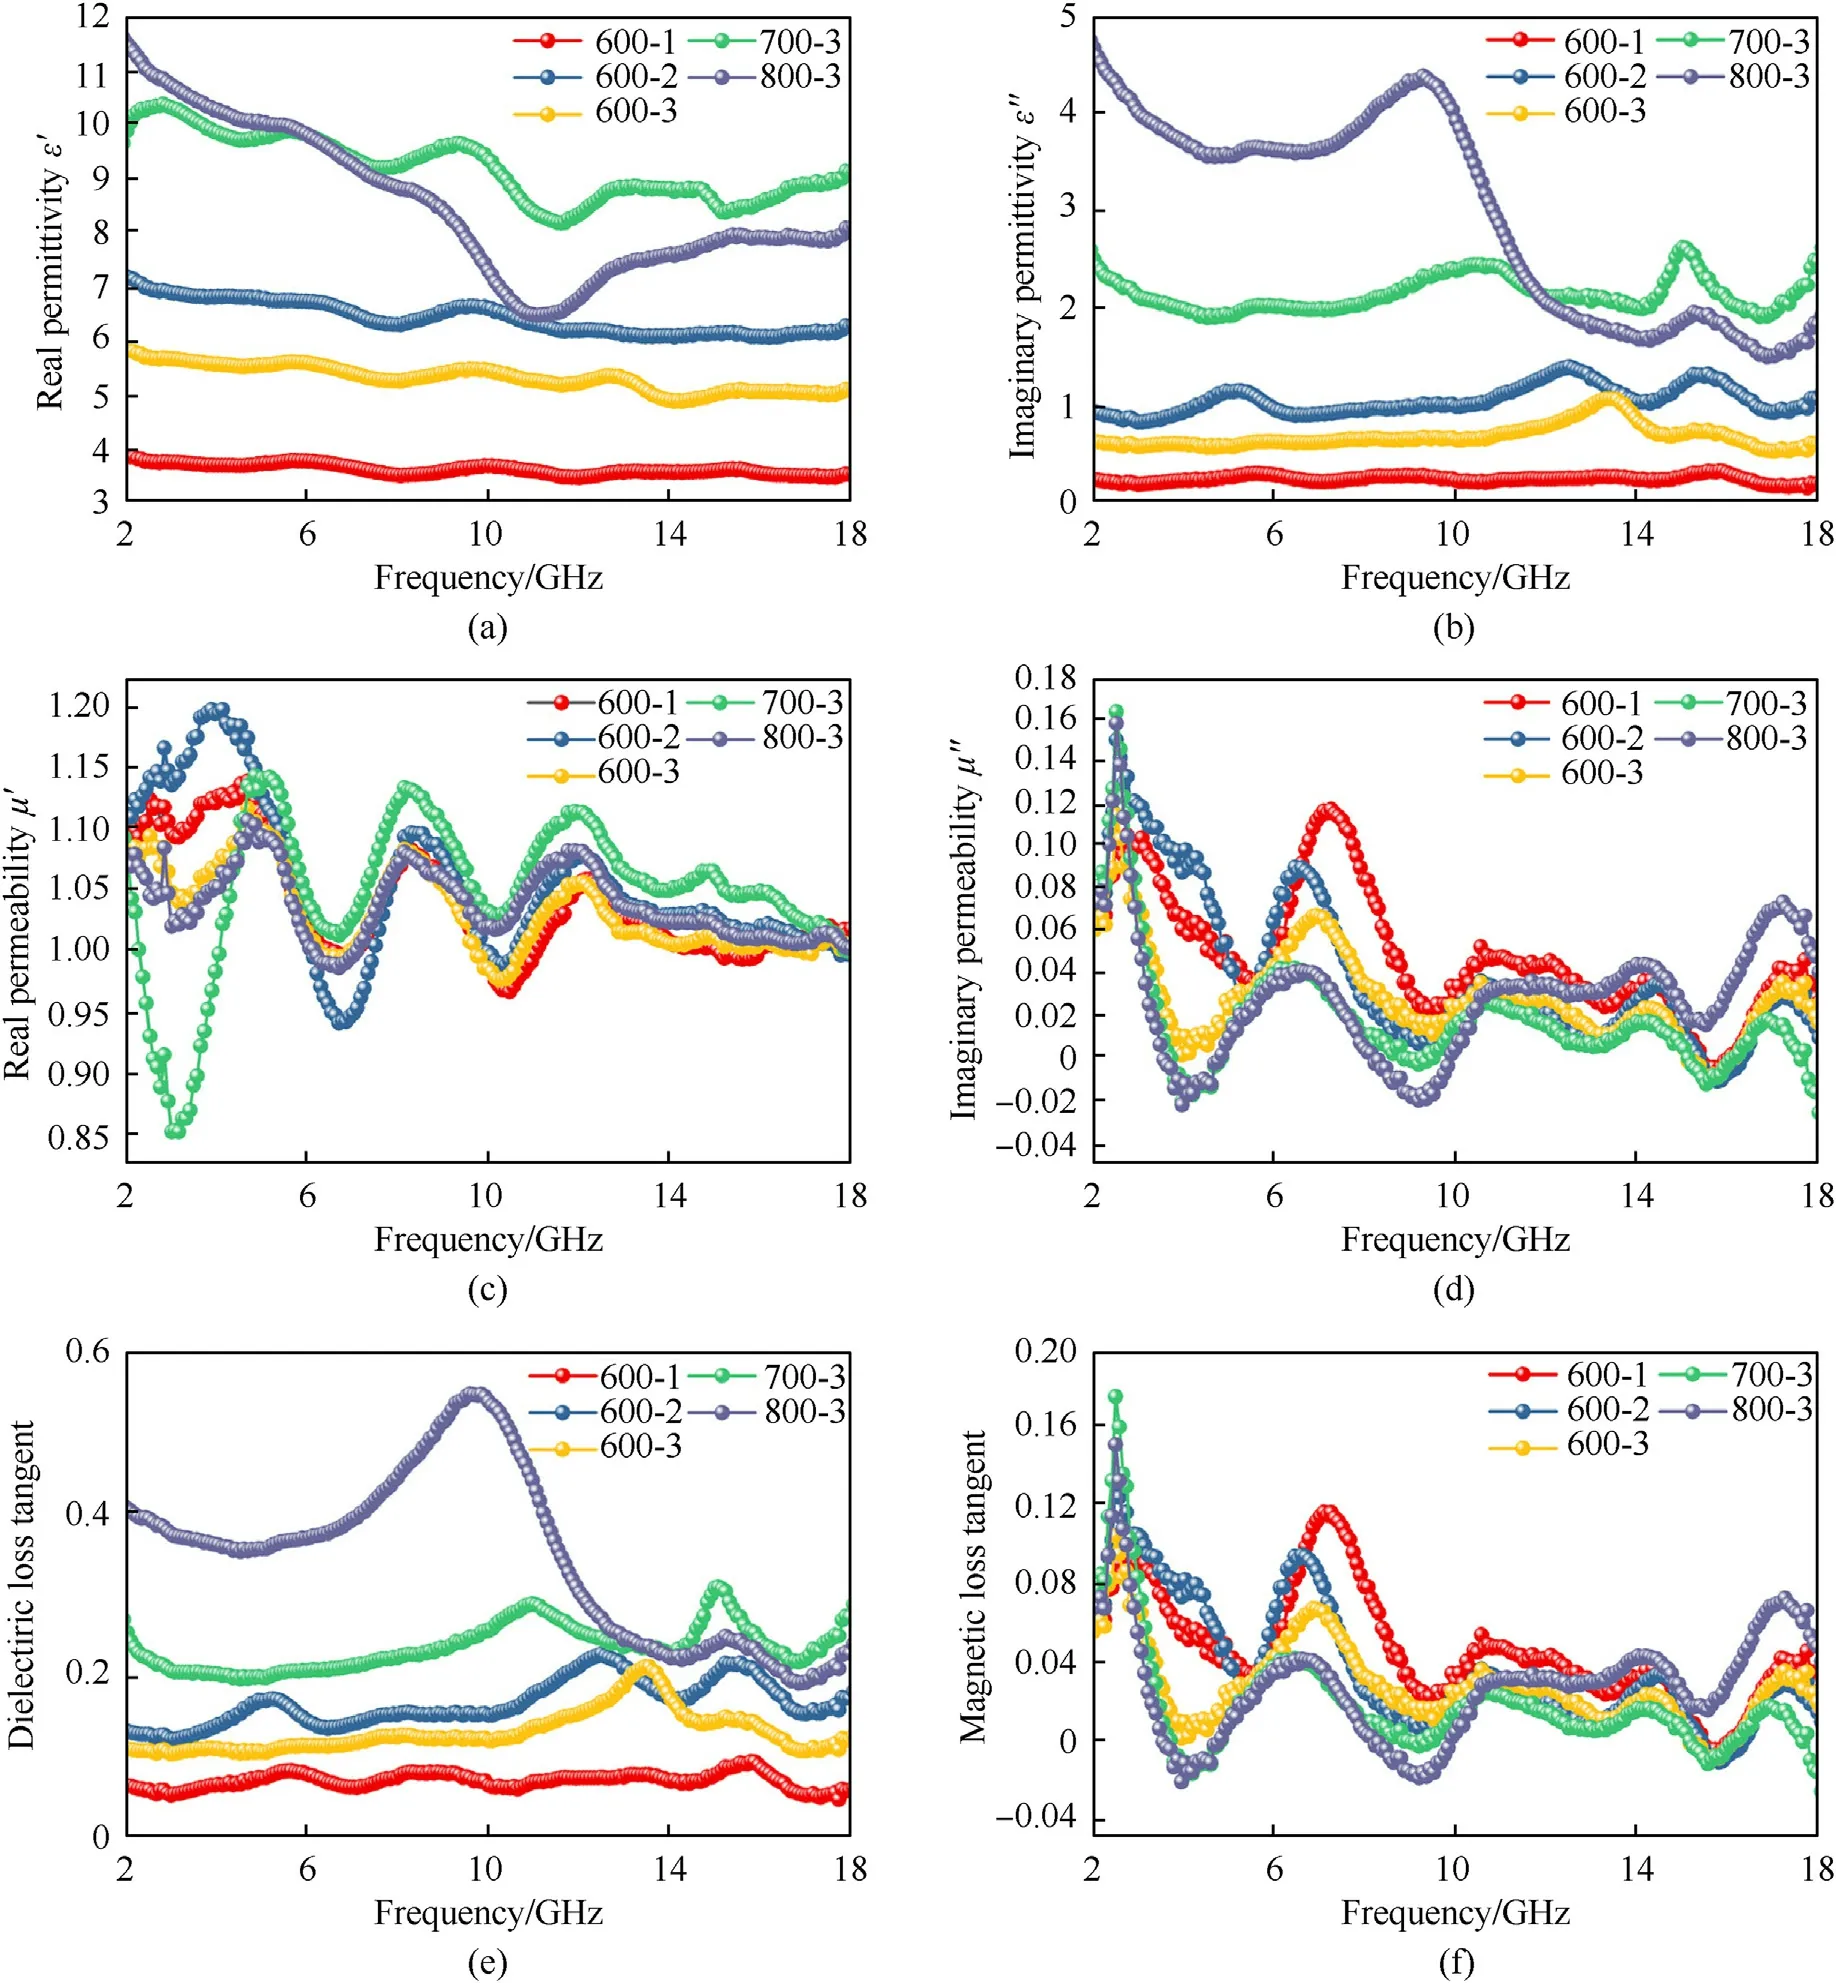
Fig.5.Frequency relationships of electromagnetic parameters of three samples with different molar ratios of MWCNTs calcined at 600 ℃,700 ℃ and 800 ℃:(a)the real part ε′ and(b) imaginary part ε′′ of complex permittivity;(c) the real part μ'and (d) μ′′of complex permeability;(e) the dielectric loss tangent and (f) the magnetic loss tangent.
On the basis of the achieved μrand εr,the sampleRLvalue can be computed in the light of the transmission line theory,which obeys the equations [44,45].
whereZ0andZinare free space intrinsic impedance and the input impedance of absorber,cis the velocity of EMW,dis the thickness of absorber,fis the frequency.
Fig.6(a)-Fig.6(c)exhibits the three-dimension representation ofRLvalues in the range of 1.0-5.0 mm for samples 600-1,600-2,600-3.Fig.6(f)-Fig.6(h)exhibit two-dimension contour reflection losses with different thickness for samples 600-1,600-2,600-3.From Fig.6(a),sample 600-1 shows the weakest EMW absorbing intensity of only-4 dB at 6.9 GHz with 4.5 mm.With the increase of MWCNTs content,theRLvalue first increases and then decreases.TheRLvalue of sample 600-2 is slightly larger than that of sample 600-3,as shown in Fig.6(b)and Fig.6(c).Considering the dielectric loss angle of three samples(Fig.5(e)),it is not ideal if the dielectric loss angle is too large or too small.A moderate dielectric loss angle would be beneficial to impedance matching.Therefore,it is very important to select the appropriate amount of MWCNTs.Owning to sample 600-3 in the medium level,the sample S-3 was also calcined at 700 ℃ and 800 ℃ to research the influence of calcination temperature on the EM wave absorbing performances.From Fig.6(c) and Fig.6(e),it is clear that the electromagnetic wave absorption performances are enhanced as the pyrolysis temperature rises.As shown in Fig.5(a),the ε′values of three samples suggest a trend of decreasing with the frequency increasing in the whole frequency range,the reason as above.Comparing the ε′and ε′′values of samples 600-3,700-3 and 800-3 (Fig.5(a) and Fig.5(b)),sample 600-3 has the lowest ε′and ε′′,indicating that electric energy storage ability of sample 600-3 is weak.For sample 800-3,both the ε′and ε′′values give violent fluctuation in the range of whole frequency,accompanied with some resonance peaks.Based on the Debye equations,the ε′and ε′′can be given as follows[46,47]:
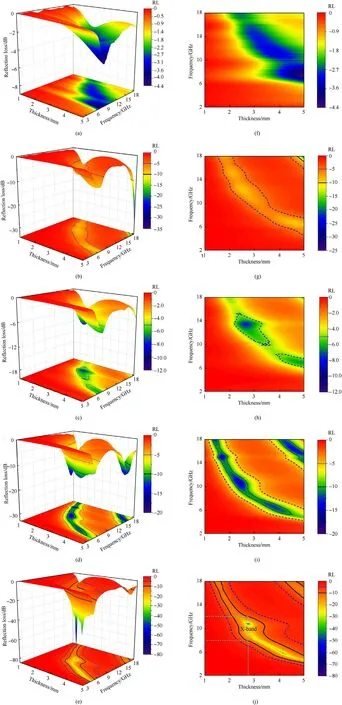
Fig.6.Three-dimension representation of reflection losses:samples(a)600-1,(b)600-2,(c)600-3,(d)700-3 and(e)800-3;Two-dimension contour reflection losses:(f)600-1,(g)600-2,(h) 600-3,(i) 700-3 and (j) 800-3.
Herein ε∞and εsstand for the relative permittivity and the static permittivity under the high-frequency boundary,respectively,τ is the polarization relaxation time,andfis the electromagnetic wave frequency[48,49].According to Eq.(4),the value of ε′is decreased with the frequency increasing.For Eq.(5),the ε′′consists of the conduction loss () and polarization loss () [45].When the frequency increases,the conduction loss would decrease.But the value of ε′′is fluctuating in the frequency range of 2-18 GHz,as shown in Fig.5(b).Therefore,the resonance peaks of ε′′are mainly caused by polarization loss.The dipole polarization and interfacial polarization have an important impact on the permittivity in the gigahertz frequency region[22].
According to Eq.(4)and Eq.(5),the dependence of ε′and ε′′can be expressed as follows [50]:
When ε′and ε′′satisfy Eq.(6),the relationship between ε′and ε′′corresponds to Debye relaxation process and can be portrayed by Cole-Cole semicircle [51].Generally,the polarization mechanism consists of interface polarization,electron polarization,ionic polarization and dipole polarization [19].Interface polarization and dipole polarization represent the main mechanisms due to electron polarization and ionic polarization usually occurring at terahertz region (103-106GHz) [52].To probe the influence of calcination temperature on polarization types,the Cole-Cole semicircles are exhibited in Fig.S4(a)-Fig.S4(c).The Cole-Cole semicircles of samples 600-3 and 700-3 are more than that in sample 800-3.It could be interpreted that the decrease of Zn content could result in a reduction of the heterogeneous interfacial area between MWCNTs/Zn and NPC/Zn owning to the calcination temperature rising.Consequently,the interface polarization related to the space charge distribution of the heterogeneous interface will be reduced.As a result,the distorted Cole-Cole semicircles of sample 800-3 is less than those of sample 600-3 and 700-3.
It is clear that the radius of Cole-Cole for sample 800-3 is larger than those of samples 600-3 and 700-3,and moves to the direction of higher value,implying that the devotion of Debye relaxation for dielectric loss is enhanced with calcination temperature increasing[53].To further investigate the dielectric loss capabilities,the tanδEof samples 600-3,700-3 and 800-3 are depicted in Fig.5(e).Clearly,the sample 800-3 has the biggest tanδEin the 2-13 GHz and the tanδEis approximately 0.22 (13-18 GHz),implying that the dielectric loss capability of sample 800-3 is the largest.
Fig.7(a) shows the frequency relationships ofRLfor samples 600-3,700-3 and 800-3.When the absorbers are 4 mm thickness,theRLof sample 600-3 is greater than-10 dB.The sample 700-3RLis -12.38 dB with 4 mm thickness.However,the sample 800-3 shows the best EM wave absorption performances and theRLattains up to-36.06 dB.The frequency dependence ofRLfor sample 800-3 with different thickness is displayed in Fig.7(b).TheRLvalue of sample 800-3 reaches -53.18 dB in the C-Band (4-8 GHz) with 4.09 mm and the EAB is 2.16 GHz(5.04-7.2 GHz,the occupancy rate is 54%).The minimumRLvalue of sample 800-3 attains to -74.83 dB at 2.749 mm thickness and the EAB is 4 GHz(8-12 GHz),covering the full X-Band.Compared with other electromagnetic wave absorbers recently reported in Table 1,the sample 800-3 exhibit excellent EM wave absorbing properties.

Table 1 Electromagnetic wave absorbing performances of different absorbers.
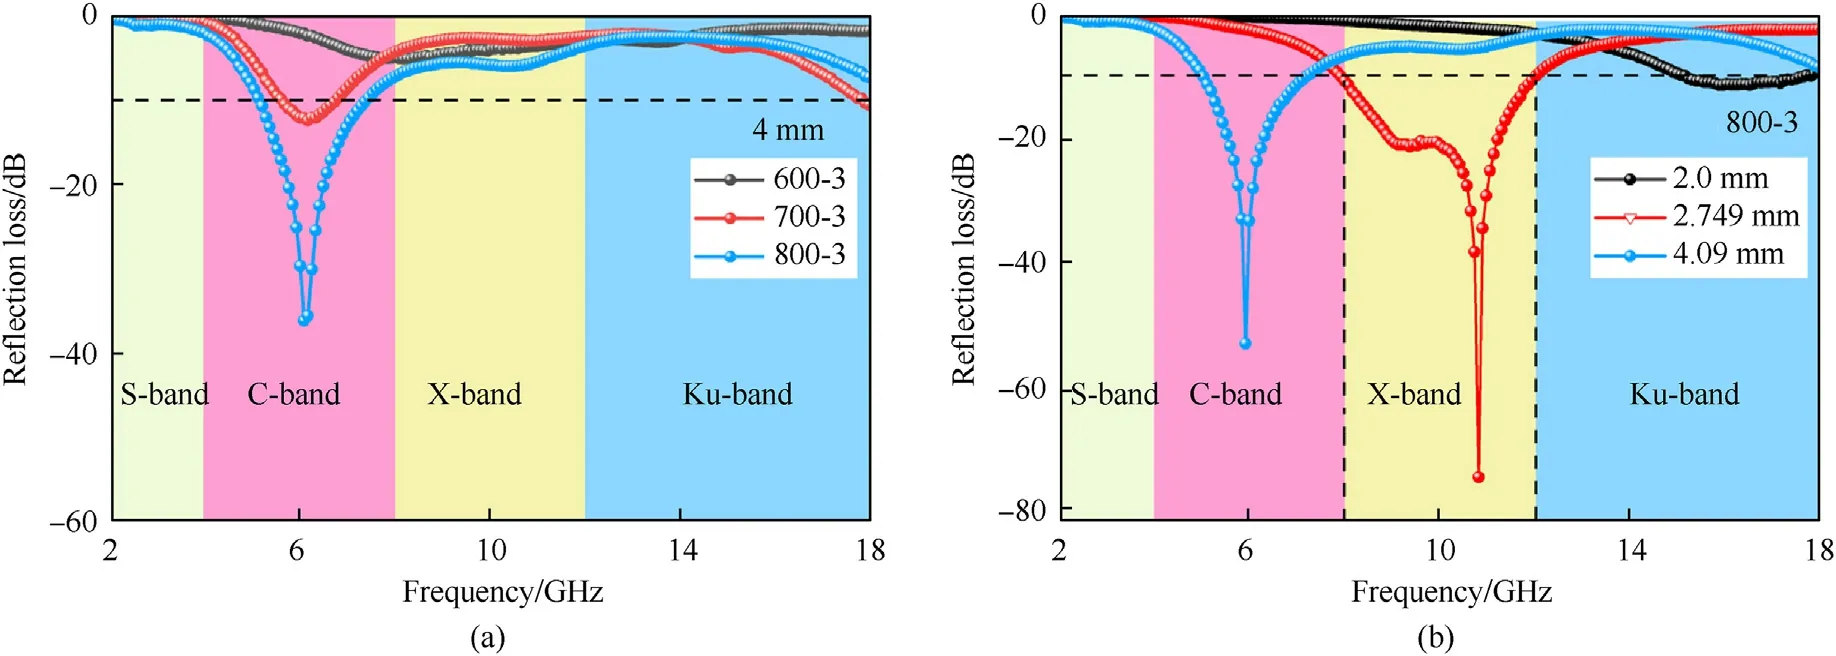
Fig.7.(a) Frequency relationships of reflection loss for samples 600-3,700-3 and 800-3;(b) RL of sample 800-3 with different thickness.
In the light of the quarter-wavelength cancellation model,theRLmincan be realized at a certain frequency when the absorber thickness (tm) complies with the following equation [16]:
where λ is electromagnetic wavelength andn=1,3,5,….In Fig.8(b),the blue circles located at approximately λ/4 curves,corresponding to theRLminvalue.The frequency of absorbing peak and the matching thickness obey the absorption performance,which originates from the combined action of impedance matching characteristic and 1/4 wavelength interference performance.Furthermore,the absorbing peaks shifted toward the lowfrequency region with an increment of the thickness (Fig.8(a)).
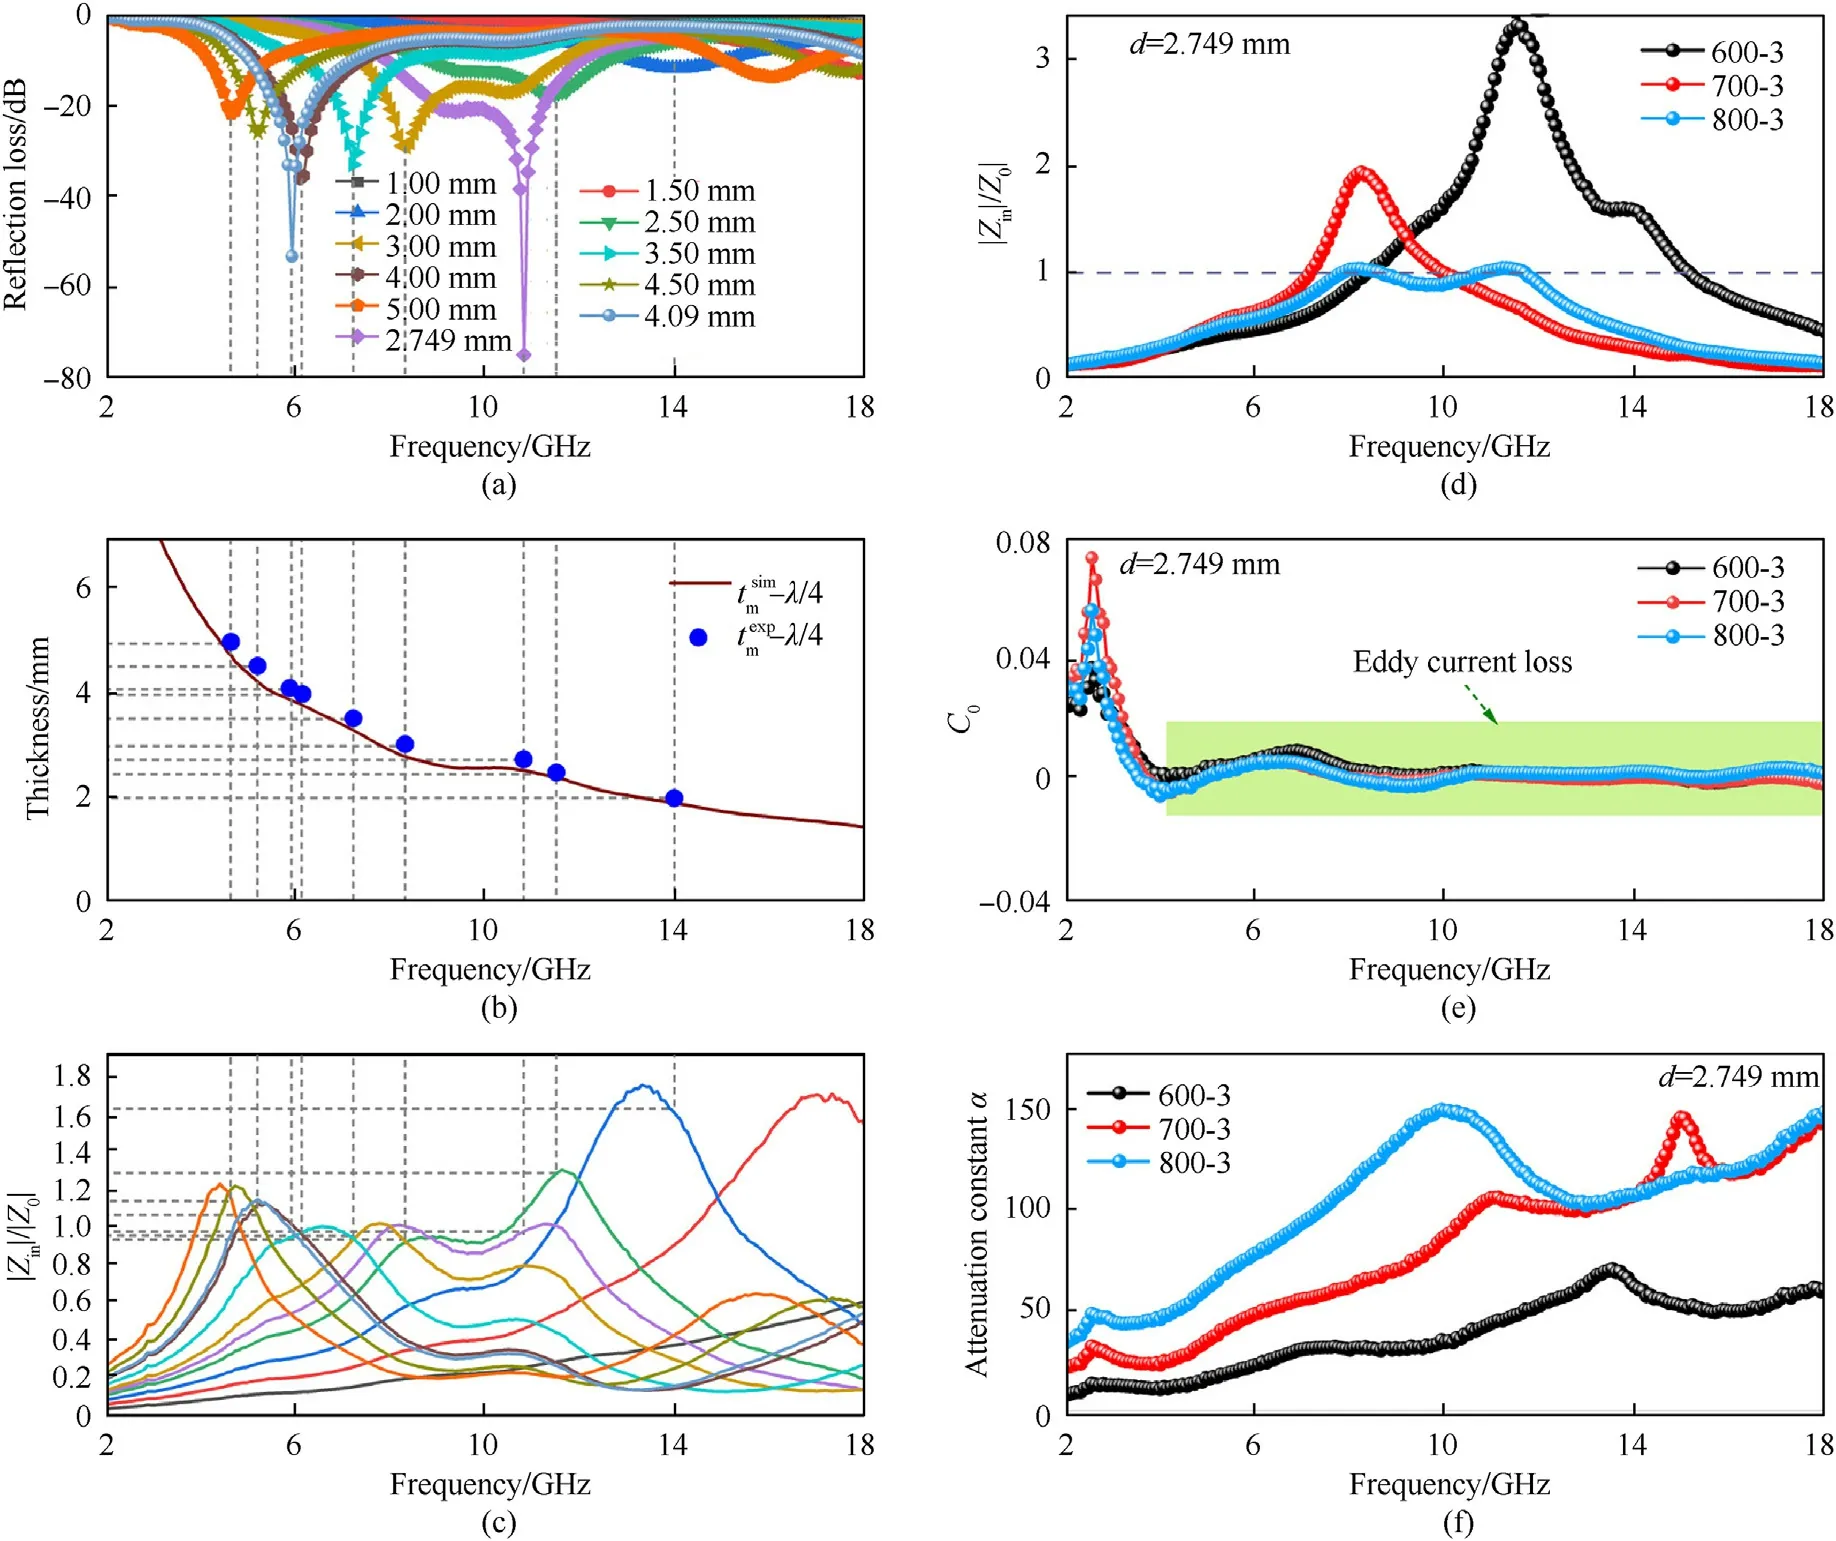
Fig.8.(a) Frequency relationships of RL for sample 800-3;(b) match thickness (tm);(c) relative input impedance of sample 800-3 at the different thickness;(d) the eddy current curve;(e) relative input impedance and (f) attenuation constant α of samples 600-3,700-3,800-3 with a thickness 2.749 mm.
The superior EM wave absorption performances of Zn@NPC@MWCNTs compounds result from good impedance matching and high attenuation during EM wave absorption.Recent researches showed that according to Maxwell-Garnett theory,the porous structure can not only decrease the density of the absorber,but also reduce the effective permittivity,which is good for improving the impedance matching[59].For EMW attenuation,the outstanding impedance matching is an essential factor that can be calculated by the following equation [16]:
If the relative input impedance calculated byZ=|Zin/Z0|obtains 1 or approaches 1 [16],the incident electromagnetic wave would completely shoot into the absorber and be converted into thermal energy,thus achieving zero reflection.Fig.8(c) displays the relationship of the relative input impedance with the absorbing peaks in 2-18 GHz.When the absorbing thickness is 2.749 mm,the value ofZis about 1 and theRLmincan be up to-74.83 dB.In addition,at the thickness of 4.09 mm;the relative impedance is also close to 1 and RL is -53.18 dB at 5.92 GHz,manifesting that the attractive absorbing performances are ascribed to the outstanding impedance matching characteristic [60].The relative input impedance of samples 600-3,700-3 and 800-3 with 2.749 mm thickness in 2-18 GHz in Fig.8(d).It can be seen that the impedance matching of the samples at 600 ℃ and 700 ℃ is poor.
As for magnetic loss,it is another factor affecting electromagnetic wave absorption.As shown in Fig.8(e),theC0value has little fluctuations in 2.0-4.0 GHz and is nearly constant in the following frequency,indicating that the magnetic loss is caused by eddy current loss.Eddy current effect refers to a phenomenon that as the conductor is placed in a changing magnetic field,eddy current would be formed in the material.The effect could also dissipate energy[61].The eddy current effect is determined via the following equation [62]:
where σ refers to the electric conductivity,dstands for the thickness of absorber and μ0represents vacuum permeability.The current loops formed by an interrelated conduction network hampers the alternating of magnetic flux within the material and results in diamagnetism,so the μ′values of samples are lower than 1 in several frequency bands,as shown in Fig.5(c).Moreover,owing to the emergence of nanocrystalline graphite,the conveying of electromagnetic wave in the conductor is attenuated,resulting in skin effect.The greater notable the skin effect,the greater the eddy current loss,which may lead to the magnetic loss,thus the value of μ′′is higher than 0 [63,64],as displayed in Fig.5(d).The tanδMvalues of samples 600-3,700-3 and 800-3 are exhibited in Fig.5(f).The tanδMvalues of three samples are much lower than the tanδEvalues (Fig.5(e)),manifesting that dielectric loss has a dominant effect on EM wave energy depletion,while eddy current loss plays only an auxiliary role.Namely,a good impedance matching is the result of the combination of less eddy current loss and dielectric loss.
Furthermore,the multiple reflections and scattering of EMW inside Zn@NPC@MWCNTs nanoparticles are different directions,which can offer lots of propagation paths for EMW and promote the attenuation of EMW.Besides an excellent impedance matching,the EMW absorbing attenuation is another key factor for absorber,which is usually described by the attenuation constant α and can be determined via the following equation [65,66]:
From Fig.8(f),the sample 600-3 has the lowest α value,elucidating the poorest attenuation ability.However,the sample 800-3 possesses the highest α value in 2-18 GHz,which manifests the strongest attenuation capacity among the three samples,in accord with the results in Fig.6.The α values of three samples abide by the following order: α (800-3) >α (700-3) >α (600-3) in the whole frequency range.Additionally,the dielectric loss (tanδE) and magnetic loss tangent (tanδM) are usually utilized to describe the attenuation abilities of electromagnetic wave for the absorbing materials.The higher value of loss tangent means the greater energy conversion capability of electromagnetic waves.The sample 800-3 possesses the largest ability of dielectric loss among all samples (Fig.5(e),while the magnetic loss tangent is little difference (Fig.5(f)).The result is consistent with the description of attenuation constant,demonstrating that the attenuation mechanism is caused by the dielectric loss.Therefore,the excellent impedance matching and wonderful attenuation ability provide the Zn@NPC@MWCNTs nanoparticles with the outstanding EM wave absorption capabilities.In Fig.S5,the input impedance corresponding to the attenuation constant point A and point B is equal to 1,but theRLcorresponding to point B reaches up to-74.83 dB and point A is not perfect,owing to the bigger attenuation constant of point D compared with that of point C [67].
The EM wave absorption mechanism of Zn@NPC@MWCNTs is described in Fig.9.Firstly,Besides dipole polarization loss,there is also interface polarization loss between Zn,NPC and MWCNTs,which can generate interfacial polarization loss and attenuate electromagnetic power to thermal energy by aligning polar bonds or space charges with alternating electromagnetic field [68].Secondly,when electromagnetic wave shoots into the absorber,the cross-linked network structure is conducive to electron hopping and migration,thereby the induced current could be generated under altering electromagnetic field,resulting in the conduction loss [69].Thirdly,3D cross-linked nanocomposites formed a conductive network,which can generate eddy current loss benefitting to impedance matching and dissipating electromagnetic wave.Finally,the hollow and porous structure can not only be favorable for improving the impedance matching,but also can result in multiple reflections which prolong the propagation path of electromagnetic wave,which is beneficial to attenuate EM waves.
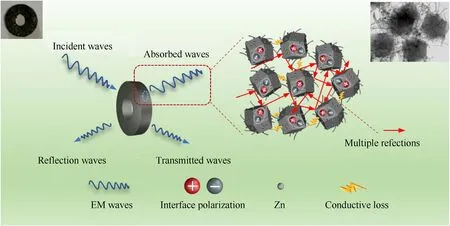
Fig.9.EM wave absorption mechanism of Zn@NPC@MWCNTs.
4.Conclusions
Zn-based ZIF-8 and MWCNTs were used as precursors,Zn@NPC@MWCNTs composites with distinctive 3D interconnected network were successfully fabricated by wet chemical and pyrolysis methods.The excellent absorption performances were obtained by optimizing the electromagnetic parameters.As a result,the minimumRLof sample 800-3 can achieve -74.83 dB at 10.8 GHz with 2.749 mm thickness and the EAB is 4 GHz(8-12 GHz),completely covering the whole X-band.The effective absorbing bandwidth below -10 dB can attain 13.76 GHz(4.24-18 GHz)by modulating the thickness of absorber from 1.0 to 5.0 mm.Therefore,it is believed that the as-prepared Zn@NPC@MWNCTs composites could be a splendid highefficiency EM wave absorber.
Declaration of competing interest
The authors declare that they have no known competing financial interests or personal relationships that could have appeared to influence the work reported in this paper.
Acknowledgements
This work was supported by the Natural Science Foundation of Anhui Province (Grant No.2008085MF217,Grant No.2008085QF287),the University Natural Science Research Project of Anhui Province (Grant No.KJ2021A0912,Grant No.KJ2020A0091,Grant No.KJ2019A0714),the Program Fund for Excellent Young Talents of Higher Education Institutions of Anhui Province (Grant No.gxyq2020042) and Anhui Province Key Laboratory of Simulation and Design for Electronic Information System (Grant No.2019ZDSYSZB02).
Appendix A.Supplementary data
Supplementary data to this article can be found online at https://doi.org/10.1016/j.dt.2022.01.008.
- Defence Technology的其它文章
- Deep hybrid: Multi-graph neural network collaboration for hyperspectral image classification
- Mesoscale study on explosion-induced formation and thermochemical response of PTFE/Al granular jet
- A new Ignition-Growth reaction rate model for shock initiation
- Effect of interface behaviour on damage and instability of PBX under combined tension-shear loading
- Sensitivity analysis and probability modelling of the structural response of a single-layer reticulated dome subjected to an external blast loading
- Experimental study of polyurea-coated fiber-reinforced cement boards under gas explosions

