A new Ignition-Growth reaction rate model for shock initiation
Yng Yng ,Zhuo-ping Dun ,Shu-rui Li ,Lin-sheng Zhng ,Feng-lei Hung ,Yong Hn ,Hui Hung
a State Key Laboratory of Explosion Science and Technology, Beijing Institute of Technology, Beijing,100081, China
b Institute of Chemical Materials, China Academy of Engineering Physics, Mianyang, Sichuan, 621900, China
c Institute of Fluid Physics, China Academy of Engineering Physics, Mianyang, Sichuan, 621900, China
Keywords: Shock initiation Ignition-growth reaction rate model Manganin pressure gauge Insensitive explosive DNAN-Based melt-cast explosive
ABSTRACT Accurately predicting reactive flow is a challenge when characterizing an explosive under external shock stimuli as the shock initiation time is on the order of a microsecond.The present study constructs a new Ignition-Growth reaction rate model,which can describe the shock initiation processes of explosives with different initial densities,particle sizes and loading pressures by only one set of model parameters.Compared with the Lee-Tarver reaction rate model,the new Ignition-Growth reaction rate model describes better the shock initiation process of explosives and requires fewer model parameters.Moreover,the shock initiation of a 2,4-Dinitroanisole (DNAN)-based melt-cast explosive RDA-2 (DNAN/HMX(octahydro-1,3,5,7-tetranitro-1,3,5,7-tetrazoncine)/aluminum) are investigated both experimentally and numerically.A series of shock initiation experiments is performed with manganin piezoresistive pressure gauges and corresponding numerical simulations are carried out with the new Ignition-Growth reaction rate model.The RDA-2 explosive is found to have higher critical initiation pressure and lower shock sensitivity than traditional explosives(such as the Comp.B explosive).The calibrated reaction rate model parameters of RDA-2 could provide numerical basis for its further application.
1.Introduction
Due to the time order of microsecond and pressure order of gigapascal,shock initiation experiments of explosives require great demands on measuring technology [1-10].To obtain detailed information of reactive flow field,the numerical simulation has become an important method to study shock initiation behaviors of explosives.As an indispensable part of shock initiation simulation,the reaction rate model dominates chemical reactions and determines the reliability of numerical results.At present,two kinds of reaction rate models are mainly developed,which are the empirical [11-15]and the mesoscopic [16-20]ones.
The empirical reaction rate models are proposed based on experimental phenomenon.They have been widely used in hydrodynamic software and play important roles in complex engineering explosion simulations,for example,the sympathetic detonation of explosives simulated by the Lee-Tarver reaction rate model [11,12].However,the dependence of model parameters on calibration condition limits the further application of empirical reaction rate models[21-23],as the model parameters need to be recalibrated each time the initial condition is changed.The mesoscopic reaction rate models are generally constructed based on a certain hot-spot ignition mechanism [24].By describing the ignition and growth of hot spots at the mesoscale,macroscopic initiation characteristics can be related to mesoscopic structures and some mesoscopic effects on shock initiation of explosives can be investigated [21,25,26].For instance,the Duan-Zhang-Kim (DZK)mesoscopic reaction rate model proposed by Duan et al.[17,18,27]could well describe the effects of particle size and porosity on the shock initiation of explosives.However,due to the need of multiscale computing technique,mesoscopic reaction rate models are difficult to be used in large-scale engineering simulations.Therefore,it is significant to develop a reaction rate model by combining advantages of the two kinds of models,which could reflect mesoscopic effects and be used in engineering explosion simulations.
Because of the excellent insensitivity,many 2,4-Dinitroanisole(DNAN)-based melt-cast explosives have been developed and used in insensitive munitions[28-31],such as the IMX-101(DNAN/NTO (3-nitro-1,2,4-triazol-5-one)/NQ (nitroguanidine)) [32],IMX-104 (DNAN/NTO/RDX (1,3,5-trinitro-1,3,5-triazacyclohexane))[33],PAX-21 (DNAN/RDX/MNA (N-methyl-4-nitroaniline)/AP(ammonium perchlorate)) [34]et al.However,published researches mainly focus on the detonation property[28,35],biologic toxicity and degradability [36-39]of DNAN-based melt-cast explosives,while those on the shock initiation behavior are rarely reported.
The purpose of this paper is therefore to develop a new Ignition-Growth reaction rate model with broad application and investigate the shock initiation of DNAN-based melt-cast explosive.This paper is organized into the following five sections.After this brief introduction,in Section 2,an ignition rate equation considering the effects of porosity and loading pressure is proposed and the new Ignition-Growth reaction rate model is constructed.In Section 3,the Ignition-Growth model is validated by the shock initiation data with different mesoscopic properties (including particle size and porosity) and compared with the traditional Lee-Tarver reaction rate model.In Section 4,for the DNAN-based aluminized melt-cast explosive RDA-2 (DNAN/HMX/aluminum),shock initiation experiments are performed with manganin piezoresistive pressure gauges and numerical simulations are carried out with the Ignition-Growth reaction rate model.Finally,in Section 5,some conclusions are drawn.
2.Ignition-growth reaction rate model
In shock initiation,there are large amount of local high temperature areas(namely,hot spots)generated at the internal defects inside explosive under the shock impact.The hot-spot ignition process is greatly affected by loading pressure and porosity[10,21],which could be described by an elastic-viscoplastic double-layered hollow sphere hot-spot ignition model [17].This mesoscopic ignition model is constructed based on the pore collapse hot-spot ignition mechanism,and it consists of two hollow spheres of explosive and binder.Under the impact of shock wave,the hot-spot ignition rate is derived by solving the mechanical deformation and temperature rise of the explosive hollow sphere as [17].
where dλ/dt,dΛ/dtand dT/dtare the ignition rate,local reaction rate and rate of temperature rise,respectively.(dT/dt)M.D.represents the rate of temperature rise caused by mechanical deformation.P0is the pressure of impact shock wave andPgis the pressure inside pore.rrepresents the radial location,and respectively,ro,riandrmare the average particle size,pore size and interfacial radius between the two hollow spheres.γeandγbare the viscosity coefficients of explosive and binder,keandkbare their shear strengths.T0,ρ0,Cp,k*,Z,T*andQare the initial temperature,initial density,heat capacity,thermal conductivity coefficient,preexponential factor,activation temperature and reaction heat of the explosive,respectively.
By virtue of the mesoscopic ignition model,ignition rates of the PBX 9501 explosive are calculated with different loading pressures and initial densities.A typical result of ignition rate is shown in Fig.1.Selecting the peak point as a feature point,variations of the peak ignition rate versus the loading pressure and initial density are shown in Fig.2.It is found that the peak ignition rate increases with both the increase of loading pressure and the decrease of initial density,so that a new ignition rate equation could be proposed and expressed as:
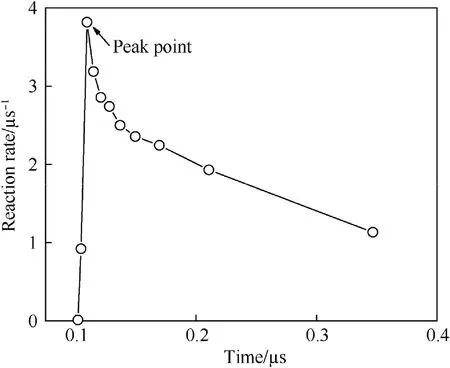
Fig.1.Ignition rate of PBX 9501 calculated by the mesoscopic ignition model.
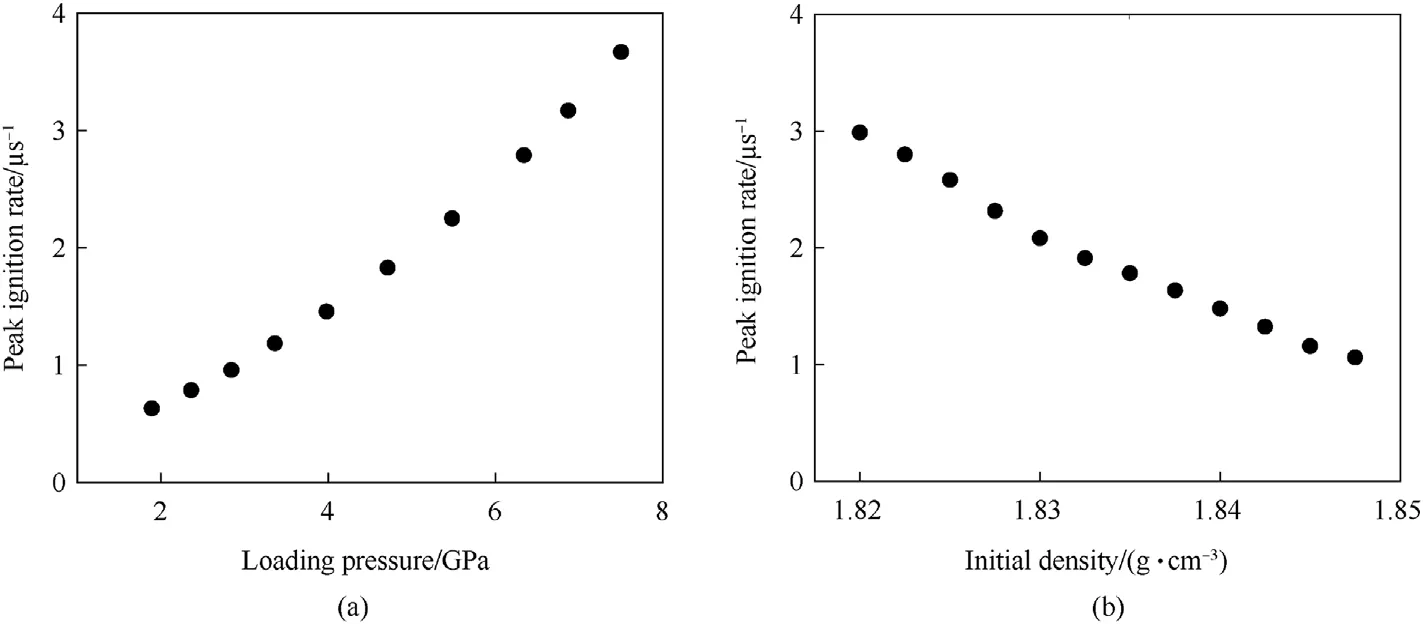
Fig.2.Variations of peak ignition rate of PBX 9501 versus (a) loading pressure and (b) initial density.
wherea1,b1and α are constants,pis the pressure and ρTis the theoretical maximum density (TMD) of explosive.
After ignition,the burning growth of hot spots is generally divided into two sub-stages.The first is a slow burning sub-stage with low pressure,in which chemical reactions of hot spots propagate outward in combustion waves.The latter is a fast reaction sub-stage with high pressure that caused by the convergence of multiple isolated hot spots.In order to describe the burning growth of hot spots accurately,two different reaction rate equations are needed for the two sub-stages.Therefore,together with the ignition rate equation shown as Eq.(6),a new Ignition-Growth reaction rate model is constructed and its three-term reaction rate equation is
where λ is the reaction degree,rois the average particle size and ρTis the theoretical maximum density of explosive.The nine parametersa1,b1,α,a2,b2,n2,G,zandxneed to be calibrated by shock initiation data.
The second term of Eq.(7)describes the slow burning sub-stage,in which the effect of explosive particle size on the burning growth rate is considered.For a smaller explosive particle size,the total burning surface area is larger and then the burning growth rate becomes faster.Moreover,the negative effect of decreased burning surface area on reaction rate caused by burning reactions of adjacent hot spots is also considered by the factor(1-λ)b2[40].The third term describes the fast reaction sub-stage,in which multiple hot spots converge on each other and the reaction rate of explosive increases rapidly[41].
Except for the Ignition-Growth reaction rate model shown as Eq.(7),the equations of state (EOS) for both unreacted explosive and detonation products as well as the mixing rule are also essential parts in shock initiation simulations.The Jones-Wilkins-Lee (JWL)EOS in temperature dependent form is generally utilized for both the unreacted explosive and the detonation products,which is expressed as [42].
wherep,andTrepresent the pressure,relative specific volume and temperature,respectively,andA,B,R1,R2,ω andCvare constants.The EOS parameters of unreacted explosive are determined by fitting the shock Hugoniot relation of explosive and those of detonation products are usually obtained by the experimental data of cylinder test of explosive.According to the mixing rule,the relative specifci internal energyeand relative volumevof the mixture composed of unreacted explosive and detonation products are determined as follows:
whereesandvsare the relative specific internal energy and relative volume of unreacted explosive,respectively,egandvgare those of detonation products.Moreover,in shock initiation simulations,the pressure and temperature of the mixture are assumed to equal to those of unreacted explosive and detonation products (namely,p=ps=pgandT=Ts=Tg).
3.Model verification
To verify the Ignition-Growth reaction rate model,shock initiation of the plastic bonded explosive PBXC03 (containing 87 wt%HMX,7 wt% TATB and 6 wt% binder) [40]are simulated,and the calculated results with different initial densities,particle sizes and loading pressures are compared respectively with experimental data.In numerical simulations,the Ignition-Growth reaction rate model parameters of PBXC03 are calibrated by shock initiation data and listed in Table 1 By considering the effect of initial density on equations of state,the JWL EOS parameters for unreacted explosive and detonation products of PBXC03 with different densities are listed in Table 2 and Table 3,respectively.
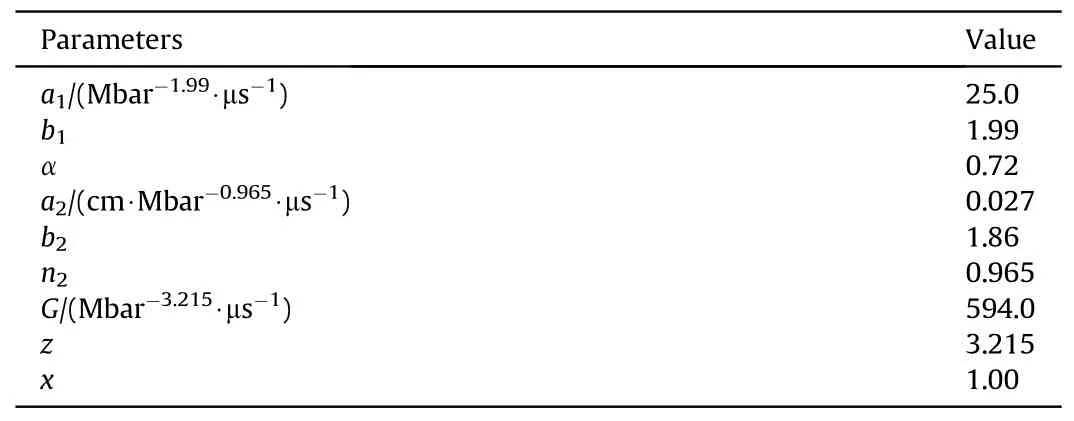
Table 1 Ignition-Growth reaction rate model parameters of PBXC03.

Table 2 JWL EOS parameters for unreacted explosive of PBXC03 with different densities[40].

Table 3 JWL EOS parameters for detonation products of PBXC03 with different densities[40].
The pressure histories at different Lagrange locations in shock initiation of PBXC03 with two different initial densities of 1.836 g/cm3and 1.855 g/cm3are presented in Fig.3.The solid lines represent experimental data and the dashed lines are calculated results.Moreover,the comparison of experimental and calculated pressure growth histories on the leading wave front is shown as Fig.4.It is found that with a lower initial density(namely,a higher porosity),the explosive becomes easier to be initiated,and both the postshock pressure and the pressure on leading wave front grow faster in shock initiation.
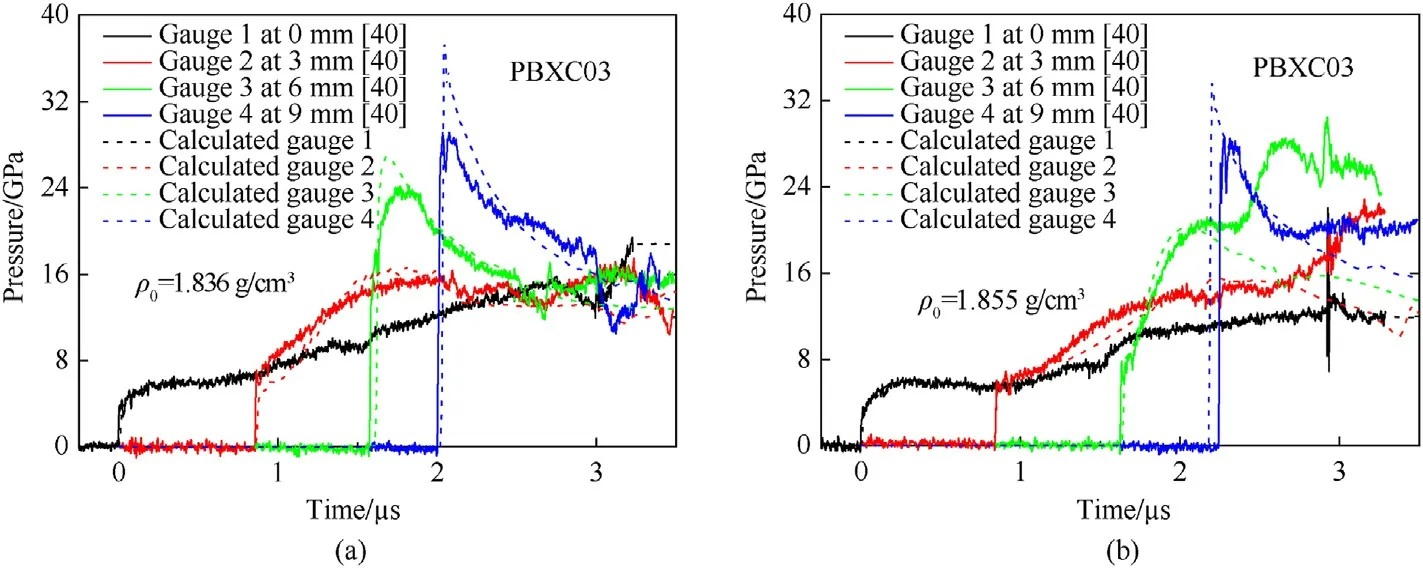
Fig.3.Pressure histories at Lagrange locations of PBXC03 with different initial densities: (a) ρ0=1.836 g/cm3;(b) ρ0=1.855 g/cm3.
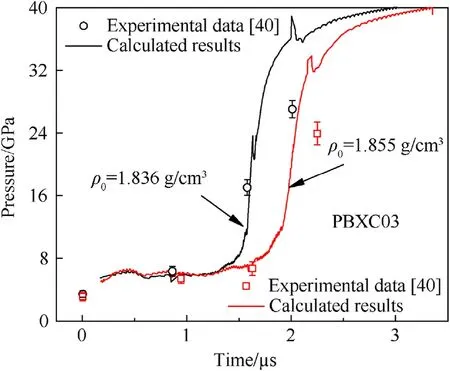
Fig.4.Pressure history on the leading wave front of PBXC03 with different initial densities.
The pressure histories at different Lagrange locations in shockinitiation of PBXC03 with two different particle sizes are shown in Fig.5,which are the medium (70-90 μm) and the coarse(110-130 μm) particles.The experimental and calculated pressure growth histories on the leading wave front is presented in Fig.6.For the explosive with medium particle size,the pressure on leading wave front is found to grow slowly in earlier stage but rapidly in later period.With a smaller particle size,the average pore size is also smaller,then the explosive becomes more difficult to be ignited and the hot-spot ignition rate is lower.But due to the larger burning surface area,the burning growth rates of hot spots increase rapidly,so that the detonation growth is faster in the explosive with smaller particle size.
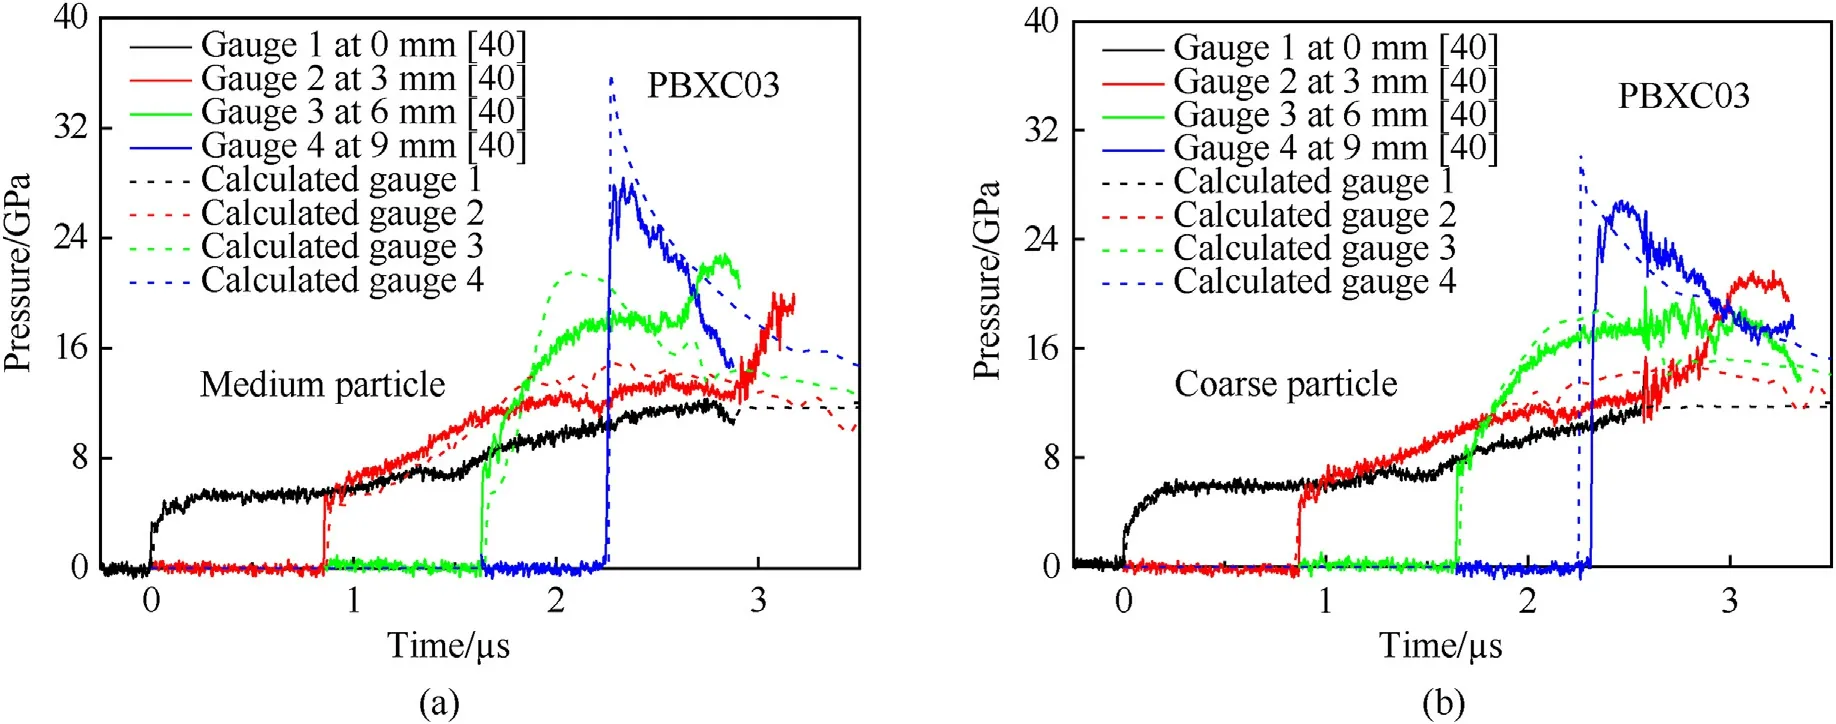
Fig.5.Pressure histories at Lagrange locations of PBXC03 with different particle sizes: (a) Medium particle;(b) Coarse particle.
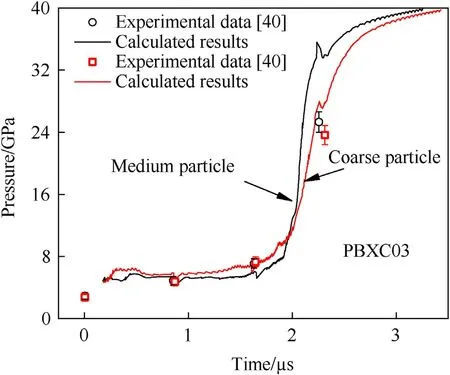
Fig.6.Pressure history on the leading wave front of PBXC03 with different particle sizes.
The pressure histories at different Lagrange locations in shock initiation of PBXC03 with two different loading pressuresp0of 5.2 GPa and 5.9 GPa are presented in Fig.7.The comparison of experimental and calculated pressure growth histories on the leading wave front is shown in Fig.8.With the increase of loading pressure,more hot spots could be ignited inside the explosive.The ignition rate and the burning growth rate are both larger.Thus,the detonation growth rate of explosive increases with the loading pressure.
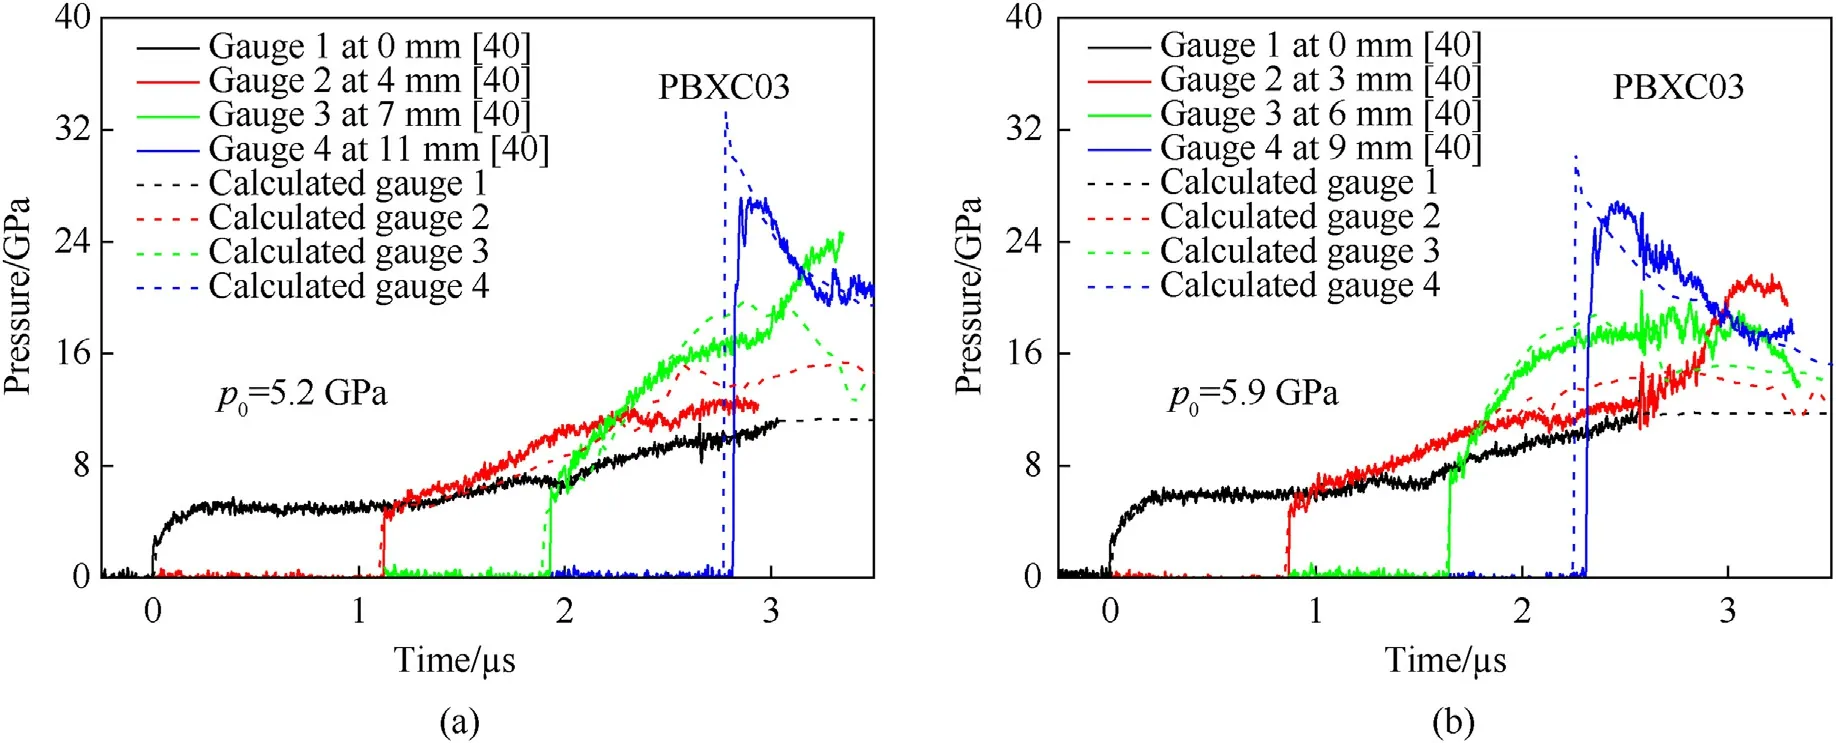
Fig.7.Pressure histories at Lagrange locations of PBXC03 with different loading pressures: (a) p0=5.2 GPa;(b) p0=5.9 GPa.
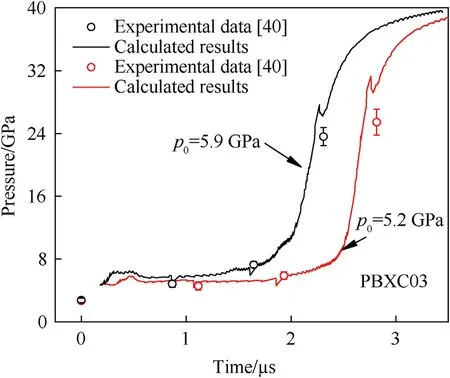
Fig.8.Pressure history on the leading wave front of PBXC03 with different loading pressures.
According to above comparison in Fig.3-Fig.8,both the arrival times of shock wave and the wave profiles of post-shock pressure calculated by the Ignition-Growth reaction rate model are in excellent agreement with the experimental data.It indicates that with only one set of model parameters,the Ignition-Growth reaction rate model could well describe the effects of initial density,particle size and loading pressure on the shock initiation of explosives.
Moreover,the Ignition-Growth reaction rate model is compared with the most popular Lee-Tarver reaction rate model.The latter model has been commonly used in engineering explosion simulations at present and its three-term reaction rate equation is expressed as follows [12]:
where ρ is the current density,ρ0is the initial density,andI,G1,G2,a,b,c,d,e,g,x,yandzare constants.
Urtiew et al.[43]measured the pressure history in shock initiation of the plastic bonded explosive PBX 9501(containing 95 wt%HMX and 5 wt%binder)at 25 ℃ with manganin pressure gauges as presented in Fig.9 in solid lines.By virtue of the experimental data,the Ignition-Growth reaction rate model parameters of PBX 9501 are determined and listed in Table 4,in which the Lee-Tarver reaction rate model parameters of PBX 9501 calibrated by Tarver et al.[2]are also listed.Therefore,together with the JWL EOS parameters for unreacted explosive and detonation products of PBX 9501 shown in Table 5,shock initiation simulations of the PBX 9501 explosive are performed with the two reaction rate models respectively.

Table 4 Reaction rate model parameters of PBX 9501 at 25 ℃.

Table 5 JWL EOS parameters for unreacted explosive and detonation products of PBX 9501[2].
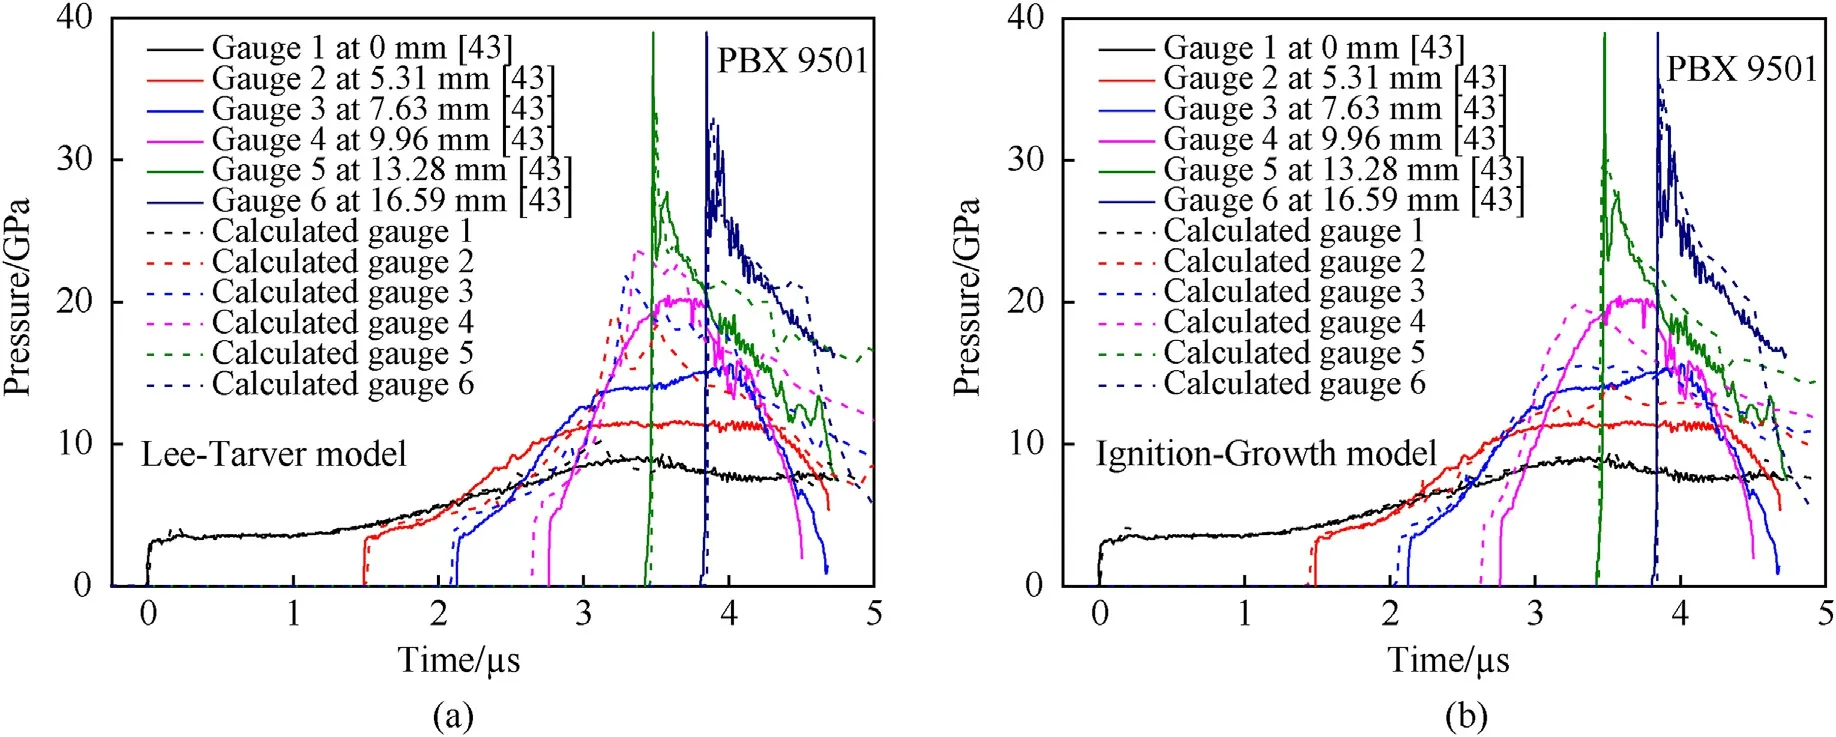
Fig.9.Calculated results and experimental data of PBX 9501 by (a) Lee-Tarver model and (b) Ignition-Growth model.
Calculated results of the Lee-Tarver reaction rate model and the Ignition-Growth reaction rate model are shown respectively in Fig.9(a)and Fig.9(b).Both the two models could predict the arrival times of shock wave at different Lagrange locations,but a large difference is found in their calculated post-shock pressure profiles.As compared in Fig.10,the post-shock pressure profile obtained by the Lee-Tarver reaction rate model is in a typical shape of spike.The pressure growth rate is obviously low at first and increases rapidly after a period,and the calculated peak pressure is much larger than experimental data.However,the post-shock pressure profile obtained by the Ignition-Growth reaction rate model is in the shape of hump,which is the same as the experimental profile.The pressure growth rate increases gradually and the pressure growth history is almost consistent with the experimental data.The great agreement indicates that the Ignition-Growth reaction rate model could better reproduce the shock initiation of explosives and requires fewer model parameters than the Lee-Tarver reaction rate model.
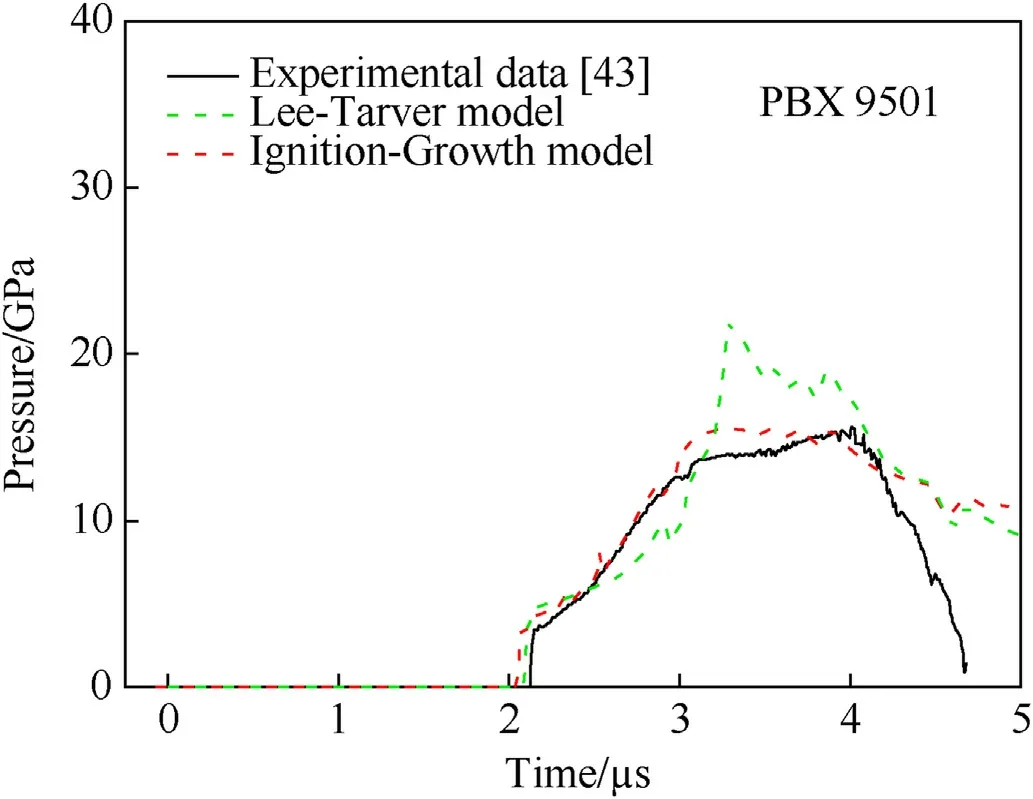
Fig.10.Comparison of pressure profiles of PBX 9501 at 7.63 mm Lagrange location.
4.Shock initiation of DNAN-based melt-cast explosive
In this section,shock initiation of the DNAN-based insensitive aluminized melt-cast explosive RDA-2 is investigated by experiments and numerical simulations.The RDA-2 explosive is composed of DNAN,HMX,aluminum powder.Its density is 1.861 g/cm3.
4.1. Shock initiation experiments
Embedded manganin piezoresistive pressure gauges could measure the pressure growth histories at different Lagrange locations in shock initiation.An H-type manganin piezoresistive pressure gauge is used as shown in Fig.11.Under the shock impact,pressure variation leads to the variations of resistance and voltage due to the piezoresistive effect of manganin.Together with the piezoresistive relation of gauge,the pressure growth history in shock initiation could be obtained by the voltage variation recorded by oscilloscope.The piezoresistive relation of the used H-type manganin piezoresistive pressure gauge is [44]:
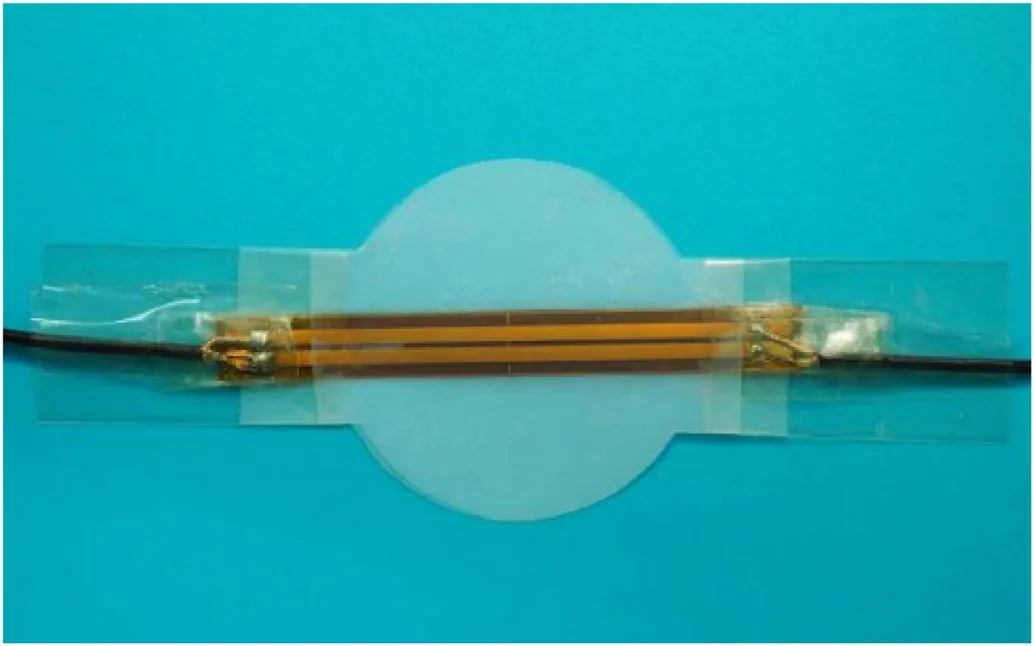
Fig.11.H-type manganin piezoresistive pressure gauge packaged by Teflon film.
wherepis the pressure(GPa),R0(≈0.2 Ω)and ΔRare respectively the initial resistance and the resistance increment of gauge.Moreover,in order to prolong the measuring time and insulate the gauge from reaction products,pressure gauges are usually packaged by Teflon films in the thickness of 0.1 mm or 0.2 mm.
By virtue of manganin piezoresistive pressure gauges,an onedimensional Lagrange measuring system is constructed to measure the shock initiation process of RDA-2 explosive.Fig.12 shows the photography of experimental device.The plane shock wave generated by a plane wave lens and a TNT booster is firstly attenuated by an air gap and an aluminum board,and then initiates the tested RDA-2 explosive.While the plane wave lens is initiated by the detonator,the probe is triggered simultaneously and the constant-current source starts supplying power to manganin piezoresistive pressure gauges.There are four pressure gauges embedded in the tested explosive to measure the pressure histories at four different Lagrange locations.
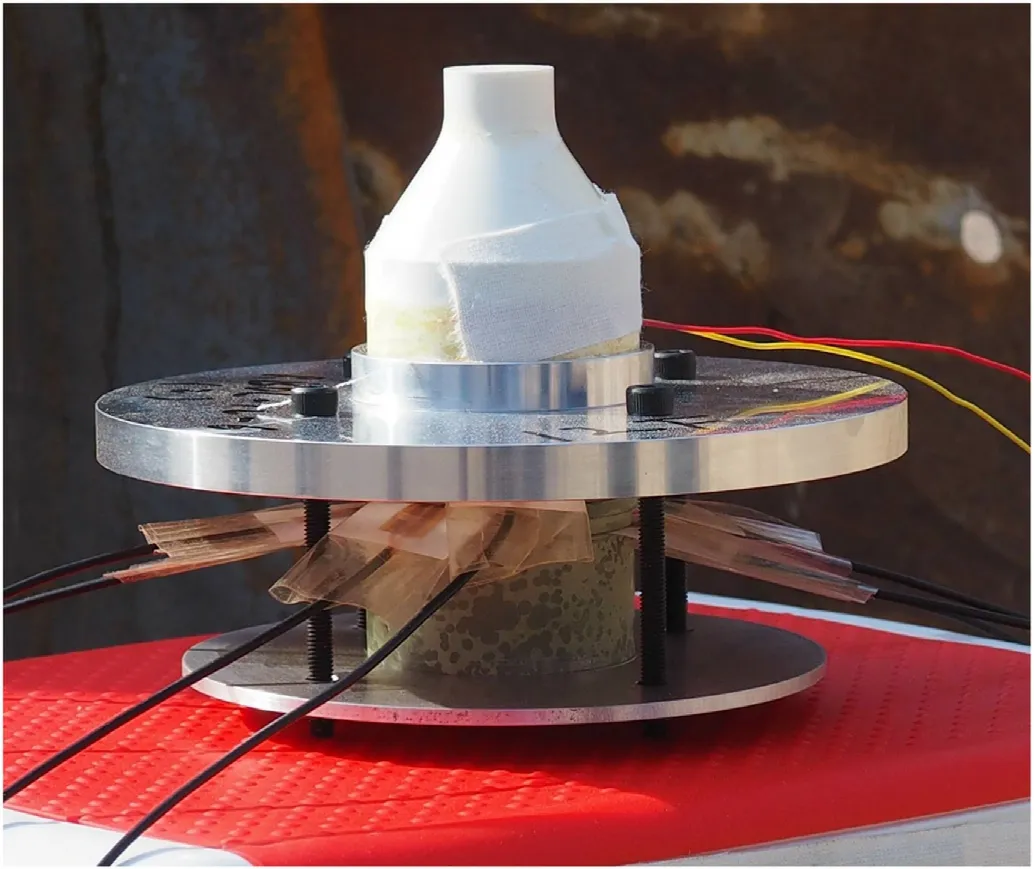
Fig.12.One-dimensional Lagrange measuring system with manganin pressure gauges.
The plane wave lens is 50 mm in diameter and the size of TNT booster is Φ 50 mm × 10 mm.The aluminum board is 12 mm in thickness,and the loading shock pressure can be adjusted by changing the thickness of air gap.The tested RDA-2 explosive is also 50 mm in diameter,which is composed of three thin slices and one thick slice in the thickness of 25 mm.One pressure gauge is placed between the tested explosive and the aluminum board to measure the loading shock pressure at 0 mm Lagrange location,and other three pressure gauges are placed between the four RDA-2 slices.Thus,different Lagrange locations could be measured by altering the thickness of thin slices.
4.2. Numerical simulation
Using the Ignition-Growth reaction rate model proposed inSection 2,shock initiation simulations of the RDA-2 explosive are performed.The measured pressure histories at 0 mm Lagrange location are input as the boundary condition.The Ignition-Growth reaction rate model parameters of RDA-2 are listed in Table 6.The JWL EOS parameters for unreacted explosive and detonation products of RDA-2 are listed in Table 7.Moreover,the effect of Teflon films on reactive flow field is also considered and the Teflon is described by the Grüeneisen EOS,which is expressed as
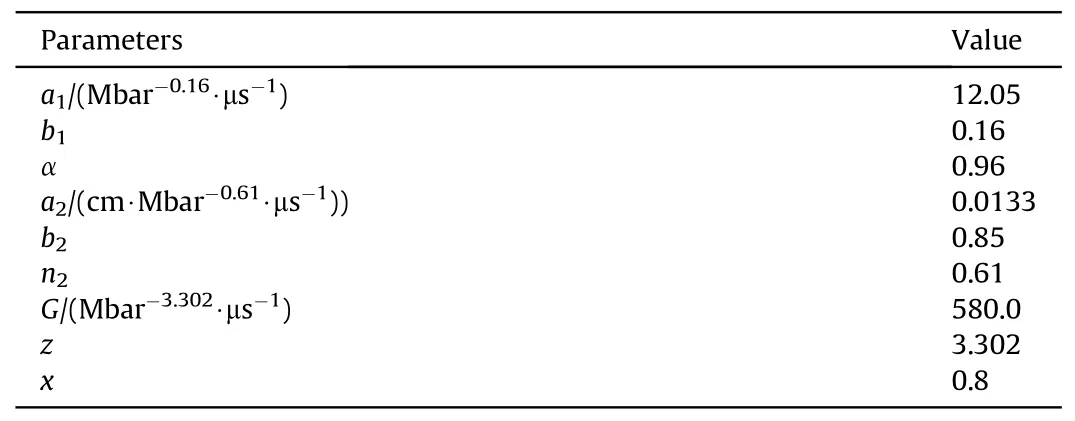
Table 6 Ignition-Growth reaction rate model parameters of RDA-2.

Table 7 JWL EOS parameters for unreacted explosive and detonation products of RDA-2[45].
wherepis the pressure,C,S1,S2,S3andaare constants,γ0is the Grüeneisen coefficient,Eis the relative internal energy and μ=ρ/ρ0-1 is the compression coefficient.The Grüeneisen EOS parameters of Teflon are listed in Table 8.

Table 8 Grüeneisen EOS parameters of Teflon [27].
5.Results and discussion
Four shock initiation experiments of RDA-2 explosive were performed with different loading pressures.In two of them,the air gaps are 8 mm in thickness and the corresponding loading pressures are about 7.3 GPa.The other two experiments use the air gaps in the thickness of 6 mm and their loading pressures are about 8.6 GPa.The measured pressure histories of RDA-2 under the two loading pressures are presented in solid lines in Fig.13,which the experimental results with the same loading conditions are combined.The dashed lines in Fig.13 represent the calculated results ofshock initiation simulations of RDA-2 explosive.It is found that at some Lagrange locations,the experimental profiles drop rapidly during ascents and the pressure growth histories are not recorded completely,such as the 10 mm location in Fig.13(a).The measurement interruptions are most likely caused by micro-jets,which are easily generated at the defects (such as pores) with large sizes inside the aluminized melt-cast explosives,indicate the premature breakdown of pressure gauges caused by micro-jets,which are easily generated at the defects (such as pores) with large sizes inside explosives.
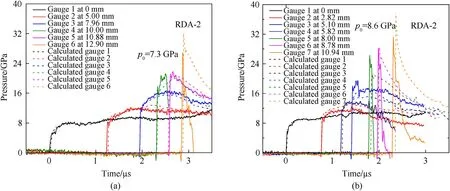
Fig.13.Experimental and calculated pressure histories of RDA-2 explosive: (a) p0=7.3 GPa;(b) p0=8.6 GPa.
As shown in Fig.13,both the calculated arrival times of shock wave and the calculated post-pressure growth histories are in excellent agreement with experimental data.It indicates that the Ignition-Growth reaction rate model proposed in this paper could well describe the shock initiation of RDA-2 explosive.In shock initiation,the pressure on leading wave front keeps increasing with Lagrange locations and finally the shock wave transformed into detonation at a certain location inside the RDA-2 explosive.The detonation is formed near 10.88 mm and 8.00 mm under the loading pressures of 7.3 GPa and 8.6 GPa,respectively.It indicates that under a larger loading pressure,the larger number of ignited hot spots as well as the larger ignition rate and burning growth rate make the pressure on leading wave front increase faster,so that the distance of SDT (shock to detonation transformation) of RDA-2 explosive becomes shorter.
Moreover,for a certain Lagrange location in shock initiation process of RDA-2,such as 7.96 mm in Fig.13(a),the pressure of explosive leaps from zero while the leading wave front arrives,and then increases slowly due to chemical reaction.After a period,the pressure reaches a peak value and begins to decrease,so that the pressure growth profile of RDA-2 is in a shape of hump.With the increase of Lagrange location,both the pressure on leading wave front and the peak value of post-shock pressure increase gradually,and the pressure peak gets closer to the leading wave front.While the pressure peak appears on the leading wave front,the detonation is formed inside explosive.Besides,under the two different loading pressures,the post-shock pressures at 0 mm Lagrange locations both hardly increase.The unapparent pressure growth indicates a low chemical reaction rate of RDA-2 explosive at this location.
Using arrival times of shock wave at each Lagrange location,the leading wave front trajectories in shock initiation of RDA-2 explosive under two different loading pressures are obtained and shown in Fig.14.The horizontal axis represents the Lagrange location and the vertical axis represents the arrival time of shock wave.As expected,under a larger loading pressure,the chemical reaction rate is larger and the leading wave front propagates faster inside the explosive.
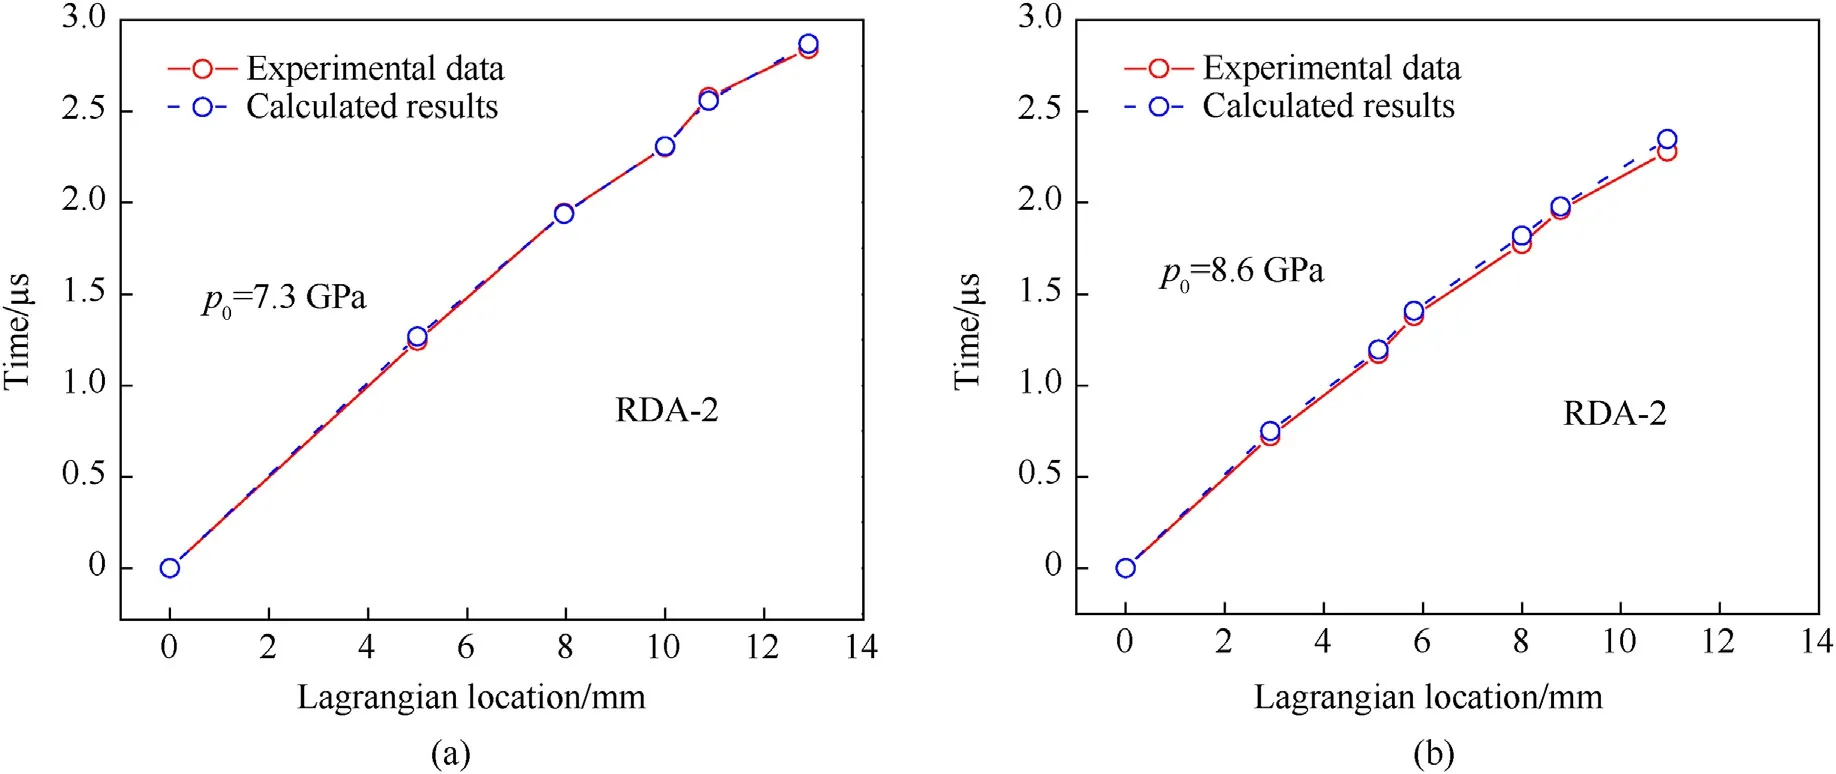
Fig.14.Leading wave front trajectories in shock initiation of RDA-2 explosive: (a) p0=7.3 GPa;(b) p0=8.6 GPa.
Variations of reaction degree and reaction rate at different Lagrange locations in shock initiation of RDA-2 are calculated.The calculated results of 7.3 GPa loading pressure are shown in Fig.15.In shock initiation of the RDA-2 explosive,the reaction rate on leading wave front is low and the peak reaction rate appears after leading wave front arrives for a period.It indicates that the chemical reaction degree of RDA-2 is low at first near the leading wave front and the chemical reaction mainly takes place after the leading wave front.Therefore,the pressure profile of RDA-2 explosive presented in Fig.13 is in the shape of hump,which the pressure on leading wave front is low and the post-shock pressure increases significantly.
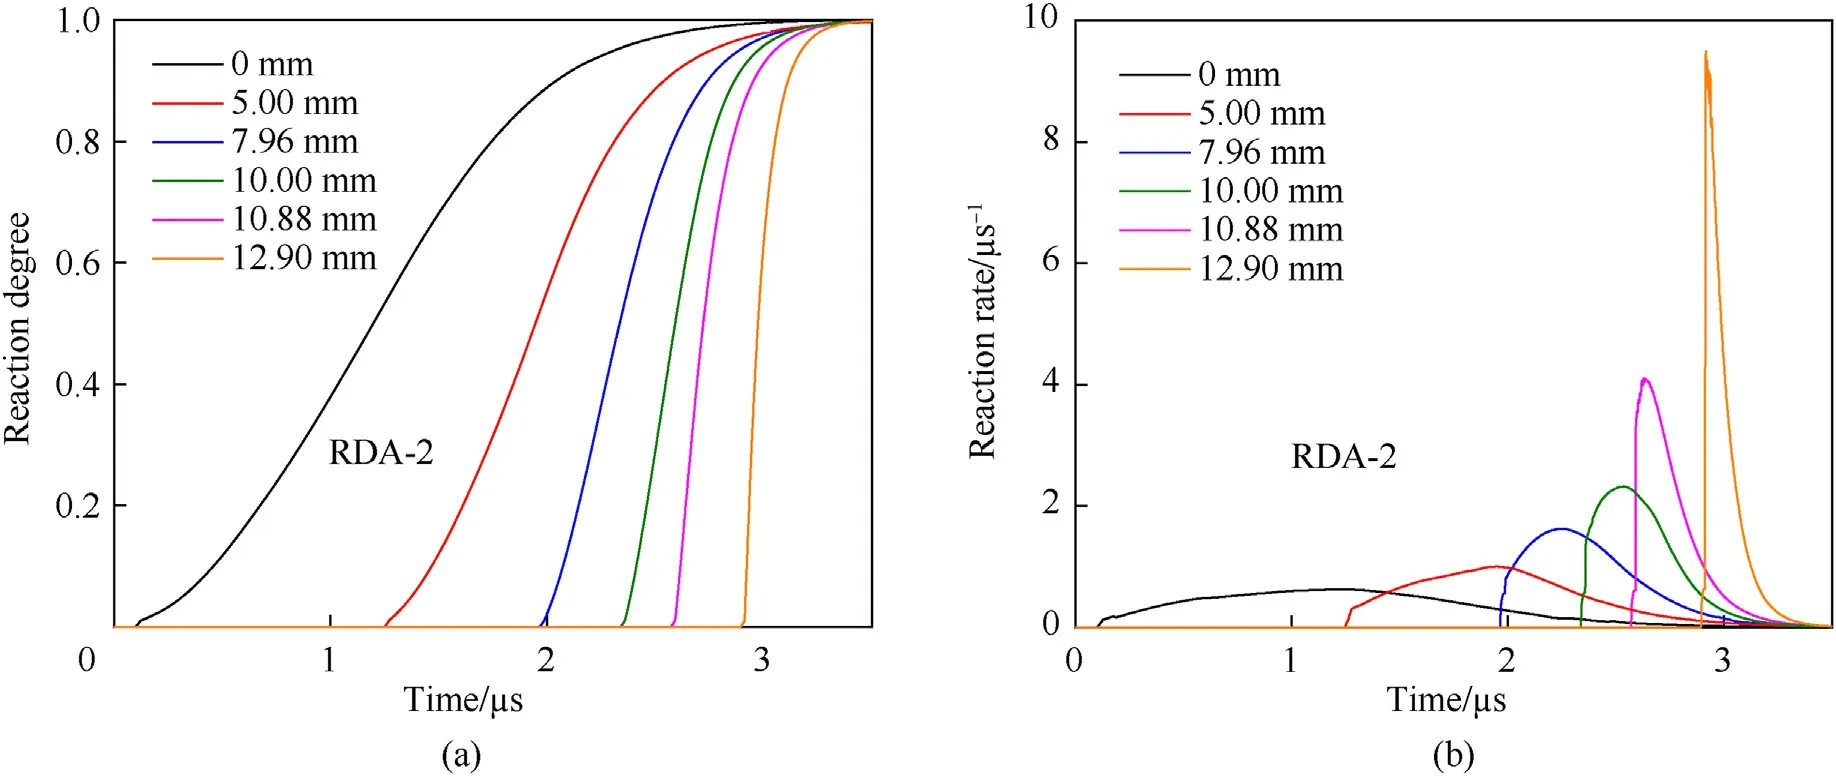
Fig.15.Calculated results of (a) reaction degree and (b) reaction rate of RDA-2 explosive under 7.3 GPa loading pressure.
Furthermore,the effect of initial density on the hot-spot ignition of RDA-2 explosive is investigated by using the first term of Eq.(7).Under the same loading condition,hot-spot ignition processes of RDA-2 are calculated with four different initial densities(including 1.841 g/cm3,1.851 g/cm3,1.861 g/cm3and 1.871 g/cm3).The calculated the degree of hot-spot ignition and ignition rate histories with different initial densities are shown in Fig.16.It is found that the ignition rate of RDA-2 grows faster with a lower initial density(namely,a larger porosity)and the explosive becomes easier to be ignited.Thus,the shock sensitivity of RDA-2 explosive is greatly affected by its initial density.
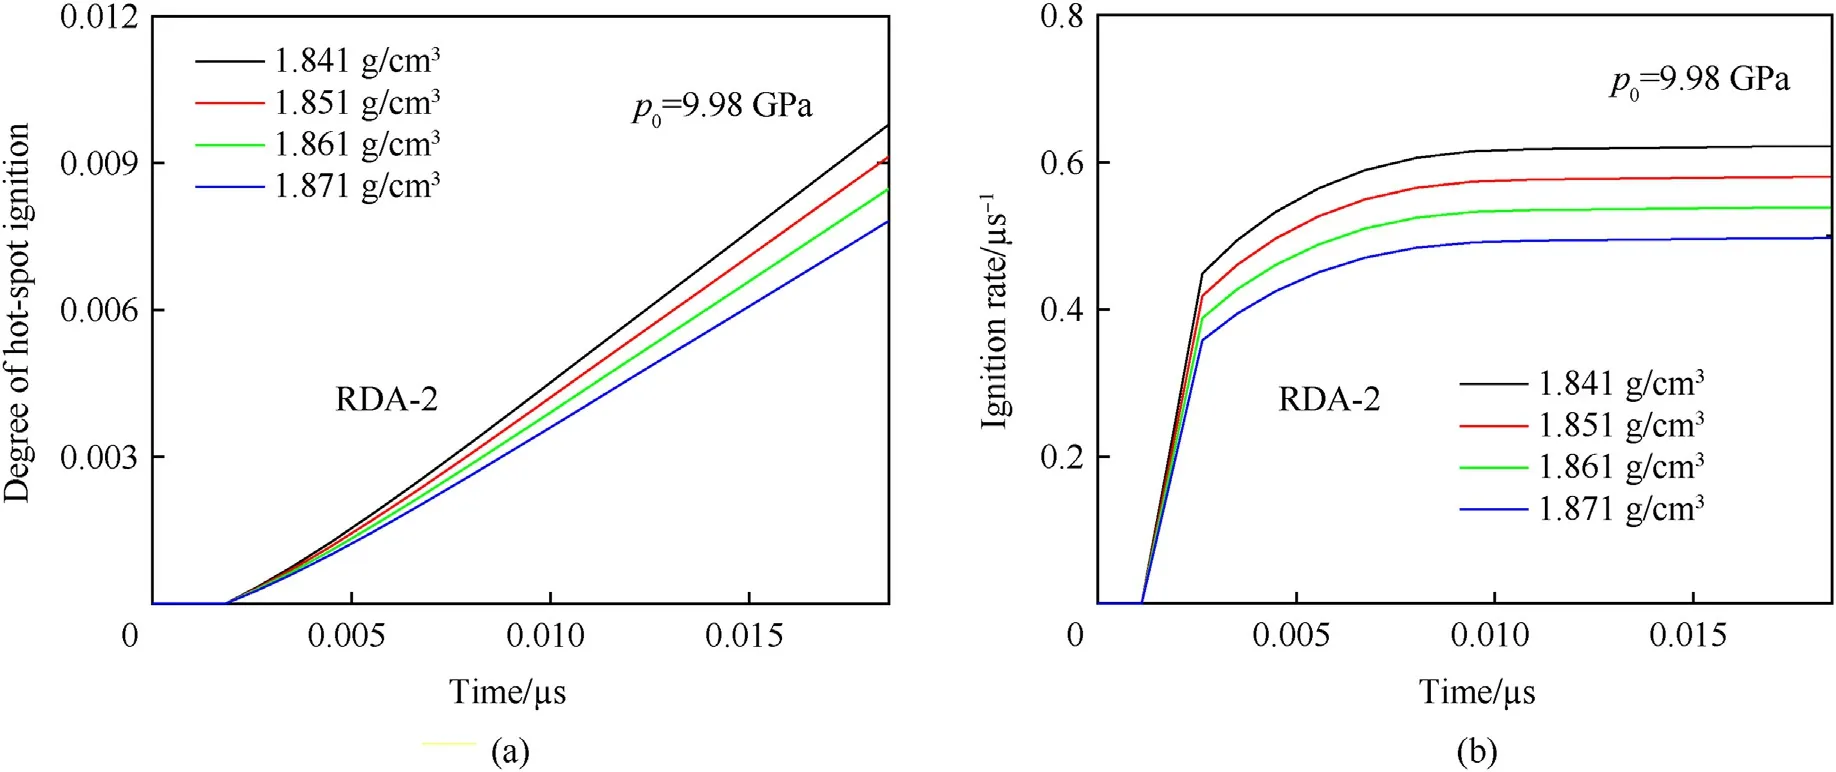
Fig.16.Calculated (a) the degree of hot-spot ignition and (b) ignition rate of RDA-2 explosive with different initial densities.
By virtue of the Ignition-Growth reaction rate model,run distances to detonation of the RDA-2 explosive are calculated under different loading pressures.The calculated results are plotted in logarithmic coordinates as shown in Fig.17.Then the POP relation of RDA-2 could be obtained by fitting the calculated results:
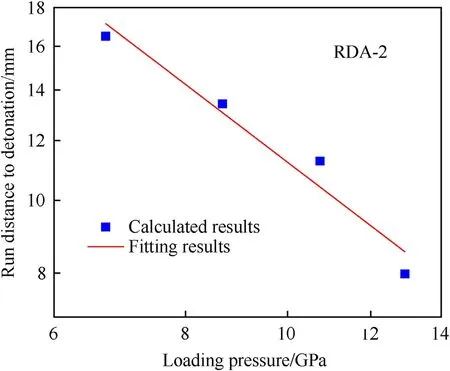
Fig.17.POP plot of RDA-2 explosive.
whereLis the run distance to detonation(mm)andPis the loading pressure (GPa).Moreover,compared with the POP relations of different explosives at the initial temperature of 25 ℃ shown in Fig.18 [46-48],the RDA-2 explosive is much more insensitive under shock impact and has better shock safety than traditional explosives,such as the PBX 9501 and Comp B.
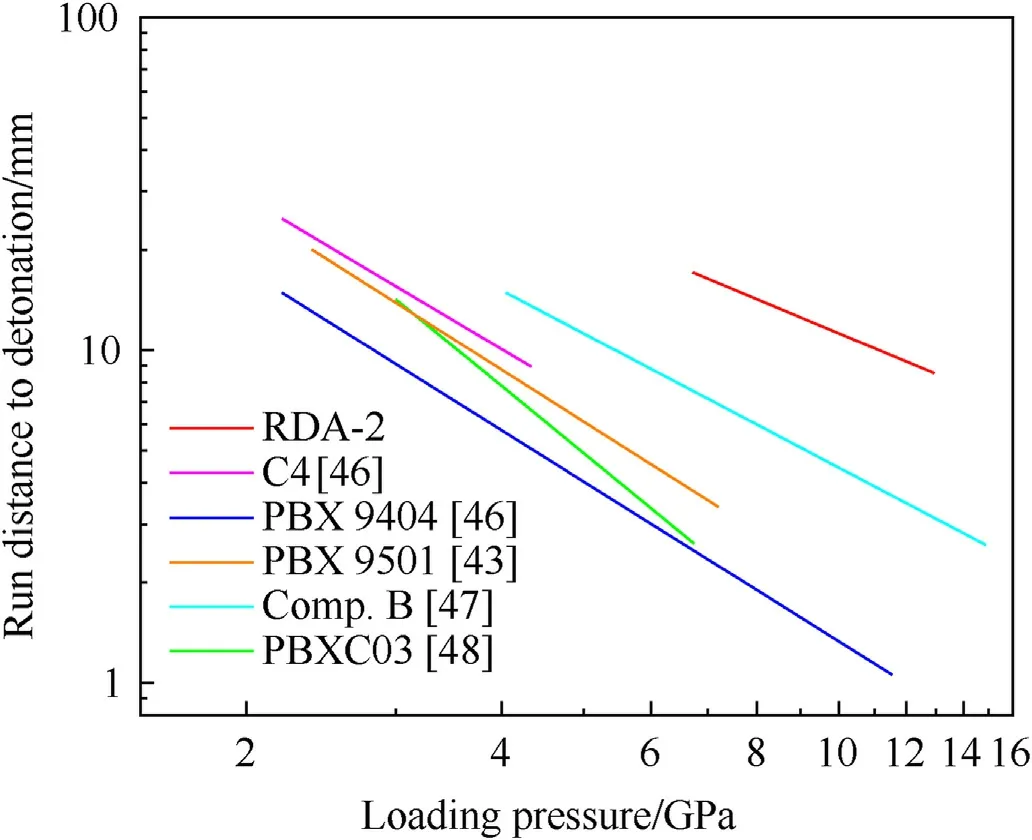
Fig.18.Comparison of POP plots of different explosives.
6.Conclusions
A new Ignition-Growth reaction rate model is proposed,by which the shock initiation process of PBXC03 and PBX 9501 are simulated.The calculated results are in excellent agreement with experimental data.Using only one set of model parameters,the Ignition-Growth model could describe the effects of initial density,particle size and loading pressure on the shock initiation of explosives.Compared with the Lee-Tarver reaction rate model,the new Ignition-Growth model describes better the burning growth reaction after hot-spot ignition and reproduces more accurately the pressure growth histories in shock initiation.Furthermore,together with the Ignition-Growth model and the Lagrangian tests performed by manganin piezoresistive pressure gauges,shock initiation characteristics of the new DNAN-based melt-cast explosive RDA-2 are investigated both experimentally and numerically.The calculated result of POP plot indicates that the shock sensitivity of RDA-2 is lower than traditional explosives,such as the Comp B explosive.Moreover,complete pressure histories of the aluminized melt-cast explosive RDA-2 are difficulty measured by traditional manganin piezoresistive pressure gauges.So it is essential to further investigate the effects of mesoscopic structures on shock initiation and develop new measuring methods for aluminized melt-cast explosives.
Declaration of competing interest
The authors declare that they have no known competing financial interests or personal relationships that could have appeared to influence the work reported in this paper.
Acknowledgements
This work was supported by the Innovative Group of Material and Structure Impact Dynamics(Grant No.11521062).The authors acknowledge Professor Zhen-yu Zhang of the National University of Defense Technology for the assistance with numerical simulation.
- Defence Technology的其它文章
- Numerical and experimental evaluation for density-related thermal insulation capability of entangled porous metallic wire material
- Mesoscale study on explosion-induced formation and thermochemical response of PTFE/Al granular jet
- Effect of interface behaviour on damage and instability of PBX under combined tension-shear loading
- Sensitivity analysis and probability modelling of the structural response of a single-layer reticulated dome subjected to an external blast loading
- Deep hybrid: Multi-graph neural network collaboration for hyperspectral image classification
- Experimental study of polyurea-coated fiber-reinforced cement boards under gas explosions

