AstroSat Observations of the Be/X-Ray Binary XTE J1946+274 During 2018 and 2021 Outbursts
Amar Deo Chandra , Jayashree Roy , and P.C.Agrawal
1 Indian Institute of Science Education and Research Kolkata, Mohanpur 741246, West Bengal, India; amar.deo.chandra@gmail.com
2 Inter-University Center for Astronomy and Astrophysics, Post Bag 4, Pune 411007, Maharashtra, India; jayashree@iucaa.in
3 Department of Astronomy and Astrophysics, Tata Institute of Fundamental Research, Homi Bhabha Road, Mumbai 400005, Maharashtra, India
Abstract We present the timing and spectral studies of the Be/X-ray binary XTE J1946+274 during its 2018 and 2021 giant outbursts using observations with the SXT and LAXPC instruments on the AstroSat satellite.Unlike the 1998 and 2010 outbursts,where a giant outburst was followed by several low intensity periodic outbursts,the 2018 and 2021 outbursts were single outbursts.The X-ray pulsations are detected over a broad energy band covering 0.5–80 keV from the compact object.We construct the spin evolution history of the pulsar over two decades and find that the pulsar spins-up during the outbursts but switches to spin-down state in the quiescent periods between the outbursts.Energy resolved pulse profiles generated in several bands in 0.5–80 keV show that the pulse shape varies with the energy.The energy spectrum of the pulsar is determined for the 2018 and 2021 outbursts.The best fit spectral models require presence of cyclotron resonant scattering feature at about 43 keV in the energy spectra of both the outbursts.We find indication of possible reversal in the correlation between the cyclotron line energy and luminosity which needs to be ascertained from future observations.Using the best fit spectra the X-ray luminosity of XTE J1946+274 is inferred to be 2.7×1037 erg s-1 for the 2018 observations and 2.3×1037 erg s-1 for the 2021 observations.We discuss possible mechanisms which can drive outbursts in this transient Be X-ray binary.
Key words: accretion – accretion disks – stars: neutron – (stars:) pulsars: general – X-rays: binaries – stars:emission-line – Be – X-rays: bursts
1.Introduction
Be/X-ray binary (Be/XRB) systems are transient X-ray astrophysical laboratories consisting of a neutron star, and an early Oe/Be type massive companion star (Reig 2011).These accretion powered compact objects are known to show transient X-ray outbursts which are categorized into two classes depending on their luminosity.The X-ray outbursts in these systems are powered by the accreted matter from the decretion disk in the equatorial plane of the massive star which is formed from the ejecta from the rapidly spinning massive star (Porter & Rivinius 2003).The more frequent Type I outbursts are less luminous (typical luminosity <1037erg s-1)and are usually phase locked with the periastron passage of the compact object when it disrupts the disk of the Be star leading to the beginning of an X-ray outburst (Cheng et al.2014).In case the decretion disk around the Be star is not completely destroyed during the first encounter with the compact object,X-ray outburst(s)occur during successive periastron passage(s)of the compact object.The Type I outbursts usually last for about 20%–30%of the orbital period of the binary system and are modulated at the orbital period of the system(Ziolkowski 2002).On the other hand, Type II outbursts are more luminous (typical luminosity >1037erg s-1), rare and these outbursts are likely triggered by episodes of sudden mass ejection from the Be star (Kriss et al.1983; Okazaki &Negueruela 2001) but the underlying mechanism causing the sudden mass loss has remained elusive (Reig 2011; Cheng et al.2014).Type II outbursts usually last for a few weeks to a few months (≿0.5 Porb) but sometimes they last for a few orbital periods of the system and are not locked to any particular orbital phase (Ziolkowski 2002; Cheng et al.2014).
XTE J1946+274 was discovered by the All Sky Monitor(ASM) onboard the Rossi X-ray Timing Explorer (RXTE)(Smith et al.1998) mission.The object was localized within a 6°×26°error box within the ASM field of view.A new object was also detected around the same location (localized to a 5°×8°error box)at the same time by the Burst And Transient Source Experiment (BATSE) onboard the Compton Gamma-Ray Observatory(CGRO)and named GRO J1944+26(Wilson et al.1998).Pulsations with a period of 15.83 s were detected in GRO J1944+26 by Wilson et al.(1998)using BATSE data.Follow-up pointed observations of XTE J1946+274 with the Proportional Counter Array (PCA) aboard the RXTE also detected 15.8 s pulsations, confirming that BATSE and RXTE had recorded the same object: XTE J1946+274/GRO J1944+26 (Smith et al.1998).Heindl et al.(2001) detected a cyclotron line at ~35 keV in the energy spectrum extracted from the PCA and the High Energy X-ray Timing Experiment(HEXTE) onboard the RXTE.Campana et al.(1999) studied the RXTE/ASM 2–10 keV monitoring observations spanning about a year since the beginning of the 1998 outburst and observed a total of five outbursts.They also found hint of an 80 d modulation in the X-ray flux and suggested 80 d(or double of this) to be the orbital period of the system.Campana et al.(1999)suggested that the first outburst in 1998 September was likely a giant (Type II) outburst as it had different rise and decay timescales compared to the following four outbursts and was comparatively brighter by about a factor of 2.The 80 day modulation in X-ray outburst flux was suggested to be half of the ~170 day orbital period (Wilson et al.2003).The binary XTE J1946+274 was also observed with the Indian X-ray Astronomy Experiment (IXAE)during 1999 September 18–30 and 2000 June 28–July 7 (Paul et al.2001).They detected 15.8 s pulsations and deduced pulse profiles in 2–6 keV and 6–18 keV bands which were found to be similar double-peaked profiles in both the observations.They also detected intrinsic spin-up of the pulsar during the outburst and suggested that the binary system had an eccentric orbit.The source XTE J1946+274 was in an active state during 1998 September-2001 July,after which it became dormant dropping below the detection limit of RXTE/PCA.
The companion star of XTE J1946+274, which is optically faint (B ~18.6) but bright in the infrared (H ~12.1), was identified by Verrecchia et al.(2002)and suggested to be a Be star.The distance to the source was inferred to be about 8–10 kpc based on the observed extinction (Verrecchia et al.2002).Wilson et al.(2003)estimated the distance to the source to be d=9.5±2.9 kpc based on the correlation between the neutron star spin-up rate and the observed flux.Recent estimates using the Gaia telescope pin down the distance to~10 kpc (Arnason et al.2021).The eccentricity and orbital inclination of the binary system were estimated to be about 0.2–0.3 (Wilson et al.2003;Marcu-Cheatham et al.2015) and 46° (Marcu-Cheatham et al.2015) respectively.The projected semimajor axis of the system was deduced to be about 471 lt-s(Marcu-Cheatham et al.2015).The mass of the companion star is not constrained but is expected to be about 10–16 M⊙(Wilson et al.2003).In 2010 a giant outburst from XTE J1946+274 was detected by the Swift/BAT hard X-ray transient monitor (Krimm et al.2010).The hallmarks of the 2010 outburst were similar to those observed in the 1998 outburst viz.a giant outburst followed by several low intensity periodic outbursts which were not tied to any particular orbital phase.The 2010 extended outburst lasted for about a year before the source returned to quiescence in 2011 June.
XTE J1946+274 was detected during its quiescent state using the Chandra-ACIS observations on 2013 March 12(Arabací et al.2015).Arabací et al.(2015) detected optical signatures of an ongoing mass ejection event from the companion star and presence of a large Be circumstellar disk which intriguingly did not fuel X-ray outbursts.Tsygankov et al.(2017) analyzed the same Chandra-ACIS observations from 2013 and suggested that the hard spectrum of XTE J1946+274 below the propeller line was most likely due to accretion from the cold disk.A single outburst, lasting for about four weeks,was detected from XTE J1946+274,around 2018 June which was unlike the extended outbursts seen in 1998 and 2010.The pulsar was dormant until around 2021 September 20(MJD 59 477) when it was detected by the Monitor of All-sky X-ray Image(MAXI)mission(Nakajima et al.2021).The 2021 outburst lasted for about four weeks after which the pulsar returned back to quiescence.
The broad-band energy spectrum of XTE J1946+274 is typical of X-ray pulsars(Filippova et al.2005).The continuum spectrum can be described by a power law with a high-energy exponential cutoff model.A cyclotron absorption line at~35 keV was detected by Heindl et al.(2001) using RXTE observations during the 1998 outburst of the pulsar.The presence of a cyclotron line with energy shifting between 35 and 40 keV was inferred independently by Doroshenko et al.(2017a) using BeppoSAX observations of the 1998 outburst.However, Müller et al.(2012) ruled out the presence of a cyclotron line in the 35–38 keV range using the RXTE observations during its 2010 outburst.Müller et al.(2012)instead suggested the presence of a cyclotron line around 25 keV which led the authors to surmise that the cyclotron energy could possibly vary during different outbursts of the source.However, using Suzaku data during the same outburst,Maitra & Paul (2013) and Marcu-Cheatham et al.(2015)detected the presence of a cyclotron absorption line around 35–38 keV but failed to detect any absorption feature around 25 keV.In a recent study, Gorban et al.(2021) detected a cyclotron absorption feature at ~38 keV using NuSTAR observations of the 2018 outburst of the pulsar.
In this paper, we investigate the timing and spectral characteristics of XTE J1946+274 using X-ray observations from the AstroSat mission during the 2018 and 2021 outbursts of this pulsar.We consider simultaneous X-ray observations from the Soft X-ray Telescope(SXT)and the Large Area X-ray Proportional Counter (LAXPC) instruments onboard AstroSat in this study.We describe observations from the AstroSat satellite followed by SXT and LAXPC data analysis procedures in Section 2.We show results related to the timing studies of this pulsar in Section 3.We derive broad-band (0.5–80 keV)energy resolved X-ray pulse profiles which are followed by results from the broad-band spectral analysis of the pulsar.The X-ray luminosity of the source is inferred based on the broadband spectral analysis.We explore salient features of an assemblage of outbursts shown by this source since its discovery in 1998 and discuss possible mechanisms whichcan drive these mysterious outbursts in this Be/XRB.We summarize our findings in Section 4.
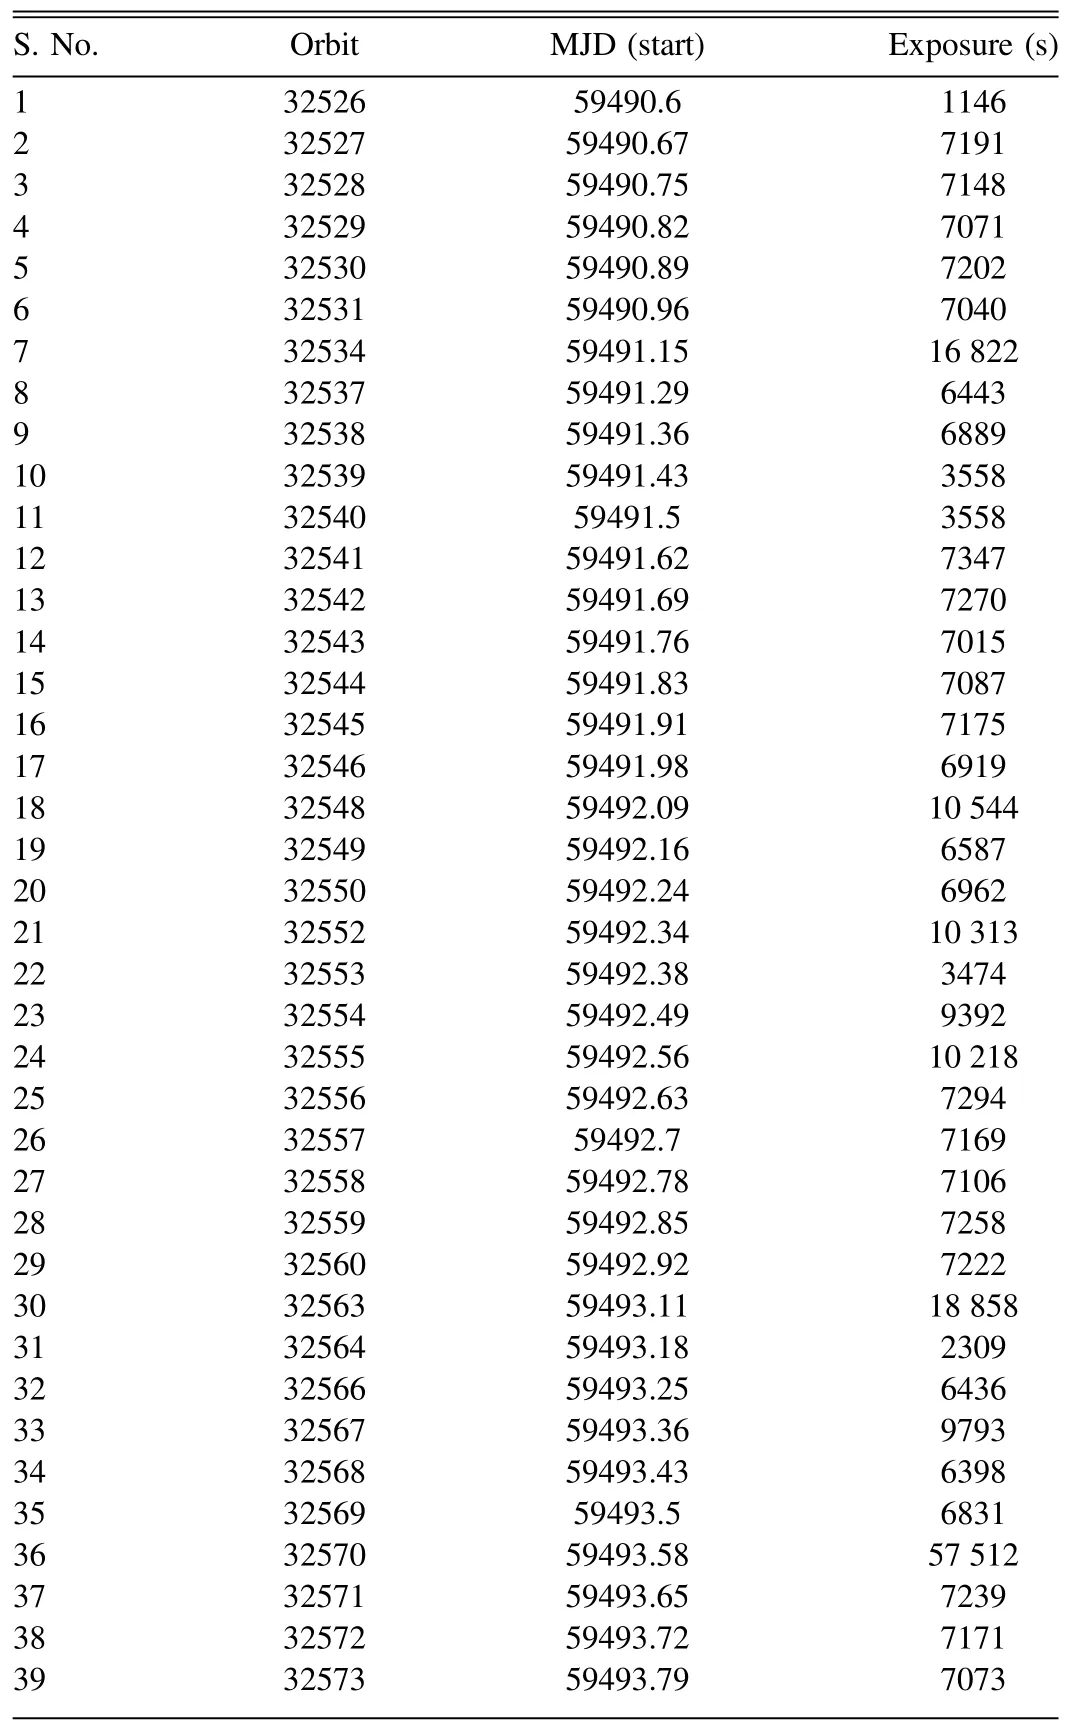
Table 1 Log of AstroSat LAXPC20 Observations from the 2021 Outburst Used in this Study
2.Observations and Data Reduction
Target of Opportunity (ToO) observations of XTE J1946+274 were performed by AstroSat approximately two weeks after the source underwent a new outburst on 2021 September 20 detected by the MAXI mission (Nakajima et al.2021).The X-ray observations were spread over almost 39 contiguous orbits from 2021 October 3 until 2021 October 6.In this study,we have analyzed data from the SXT and the LAXPC instruments covering orbits 32526–32573 yielding a total exposure of about 285 ks.The log of AstroSat 2021 observations used in our study is expressed in Table 1.The total exposure time shown in Table 1 for 2021 observations is about 340 ks.The recorded data in each orbit have an overlap with the orbits before and after that orbit which are filtered appropriately during the analysis using the LAXPC analysis software.The actual observation time for the 2021 observations is about 285 ks as mentioned earlier.The epochs of AstroSat observations overlapping on the MAXI light curve during the 2021 outburst are displayed in Figure 1.The reported epoch of the beginning of the 2021 outburst (Nakajima et al.2021) is marked by a dashed vertical line in Figure 1.We have also analyzed archival AstroSat observations from the 2018 outburst of this pulsar spread over almost 18 contiguous orbits from 2018 June 9 until 2018 June 10.The log of AstroSat 2018 observations used in our study is featured in Table 2.
2.1.Soft X-Ray Telescope
The science instruments on AstroSat and their salient features are presented in Agrawal (2006).The SXT instrument is a soft X-ray reflecting telescope sensitive in the 0.3–8 keV range onboard AstroSat with an effective area of ~90 cm2at 1.5 keV.A detailed description of SXT can be found in Singh et al.(2016,2017).The 2021 SXT observations of XTE J1946+274 were in the Fast Window (FW) mode while the 2018 SXT observations were done in the Photon Counting (PC)mode having coarser timing resolution of 2.3775 s.The FW mode has a time resolution of ~0.3 s, free from pile-up effect and especially meant to observe bright sources.The SXT Level-1 data from 39 orbits were processed using SXTPIPELINE version AS1SXTLevel2-1.4b5http://www.tifr.res.in/~astrosat_sxt/sxtpipeline.htmlreleased on 2019 January 3, to generate Level-2 data for each orbit.The Level-2 SXT data of individual orbits are merged using Julia code http://astrosat-ssc.iucaa.in/sxtData.6http://www.tifr.res.in/~astrosat_sxt/dataanalysis.htmlA circular region with 4′and 15′radius centered on the source was used to extract source light curves and spectra for the 2021 FW mode and 2018 PC mode observations respectively.Similarly, circular regions having radius of 4′ and 15′, were used to extract background light curves for the 2021 and 2018 observations respectively.Light curves and spectra were generated using XSELECT utility in HEASOFT package7http://heasarc.gsfc.nasa.gov/(version 6.30).We used SkyBkg_comb_EL3p5_Cl_Rd16p0_v01.pha background file and sxt_pc_mat_g0to12.rmf response file provided by the SXT instrument team.Further we applied SXT arf generation tool(sxtARFModule8https://www.tifr.res.in/~astrosat_sxt/dataanalysis.html) to generate vignetting corrected arf ARFTESTS1_Rad4p0_VigCorr.arf using the arf provided for FW mode SXT arf sxt_fw_excl00_v04_20190608.arf by the SXT instrument team.et al.(2017).The calibration details of the LAXPC instrument are given in Antia et al.(2017).The latest calibration details of the LAXPC instrument are written in Antia et al.(2022).We utilized LAXPCSOFT9http://astrosat-ssc.iucaa.in/laxpcDatasoftware to reduce Level-1 raw data file to Level-2 data.The LAXPC Level-2 data products are discussed in Chandra et al.(2020, 2021).The standard routines10http://astrosat-ssc.iucaa.in/uploads/threadsPageNew_LAXPC.htmlavailable in LAXPCSOFT were used to generate the light curves and energy spectrum.The LAXPC30 detector suffered abnormal gain changes and was switched off on 2018 March 8.In the third observation(O3), the LAXPC10 detector was operating at low gain and so we only considered data from the LAXPC20 detector in our study.
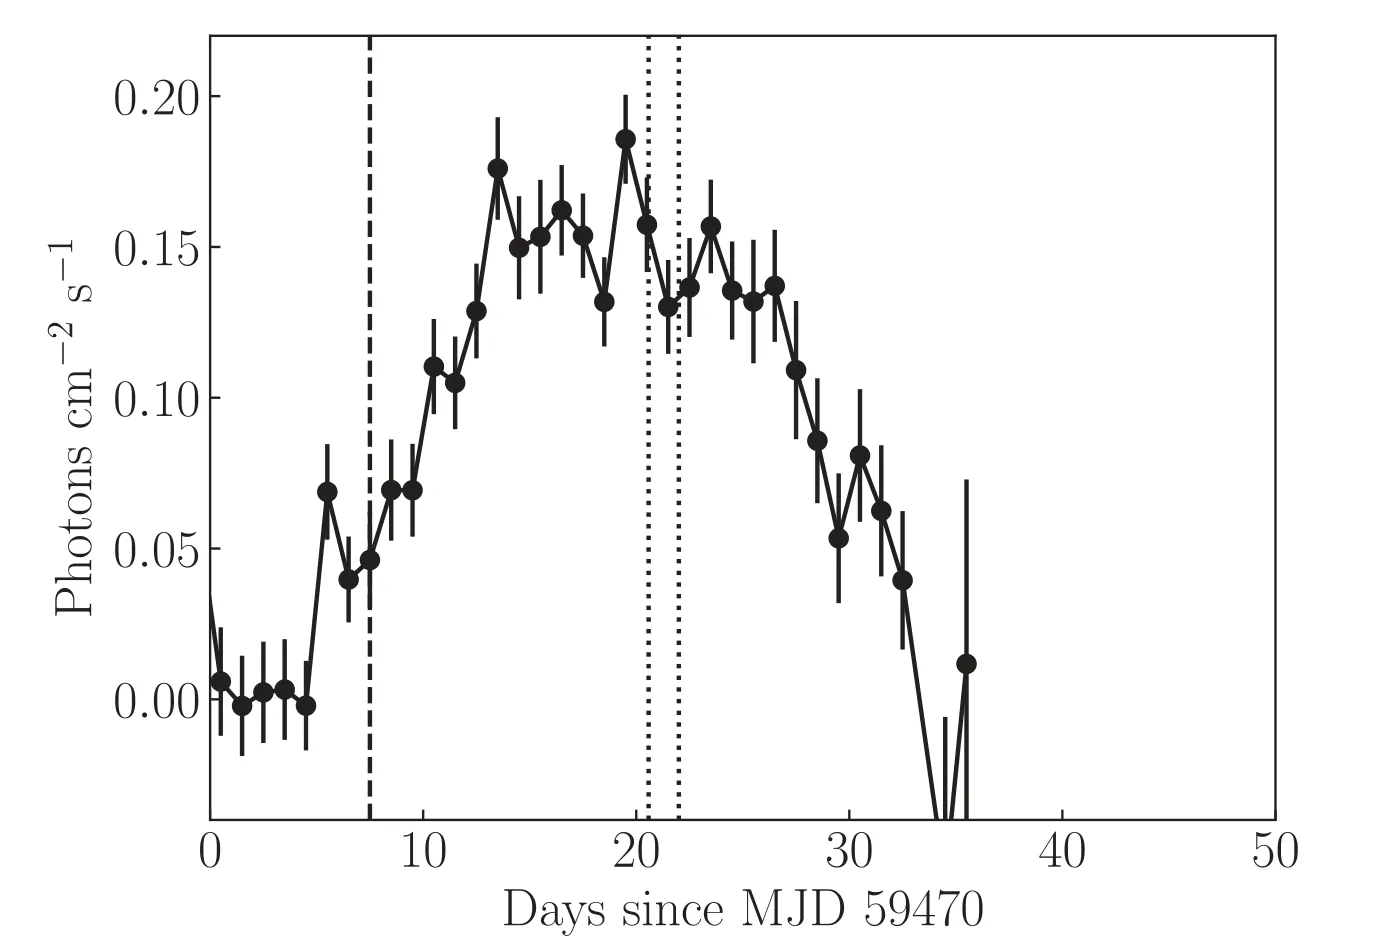
Figure 1.MAXI one day averaged light curve of the 2021 outburst of XTE J1946+274 in the 2–20 keV energy band.The duration of overlapping AstroSat LAXPC20 observations is indicated by dotted vertical lines.The beginning of the outburst detected by the MAXI mission is shown by a dashed vertical line.
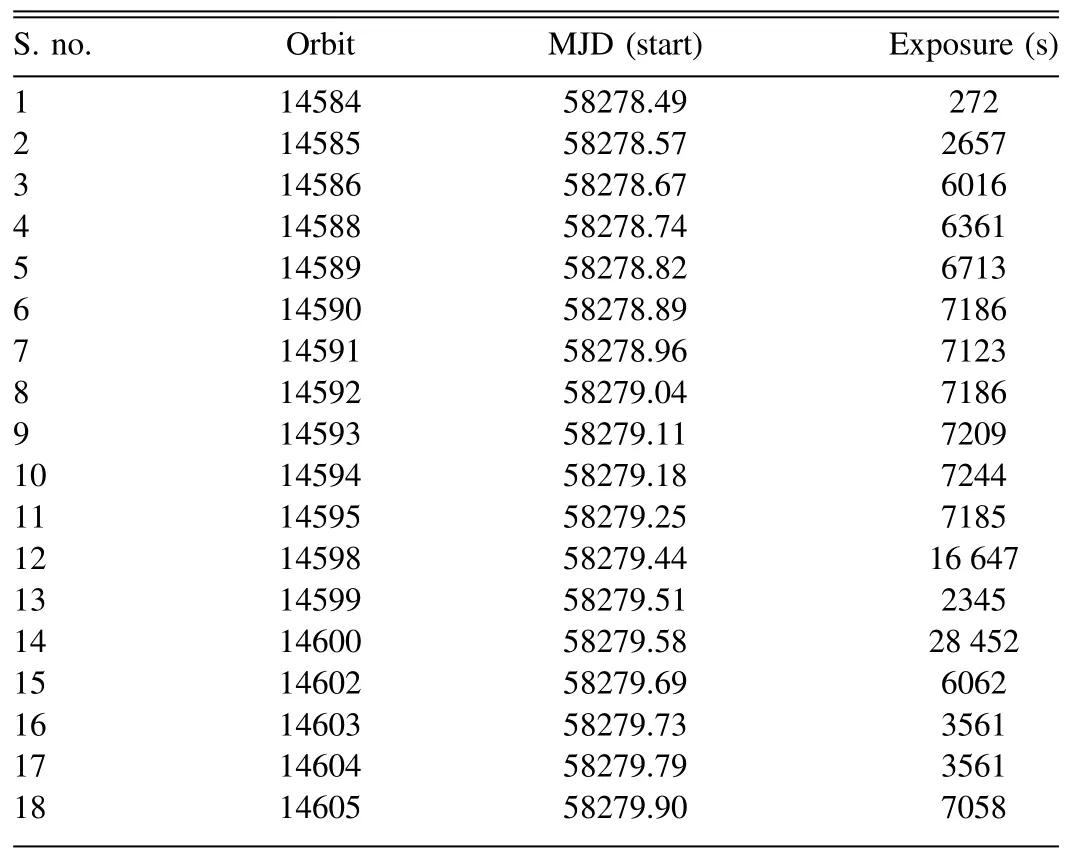
Table 2 Log of Archival AstroSat LAXPC20 Observations from the 2018 Outburst Used in this Study
We correct the X-ray photon arrival times to the solar system barycenter using the AstroSat barycentric correction utility“as1bary.”The orbit files for barycentric correction are generated using AstroSat orbit file generator.11http://astrosat-ssc.iucaa.in:8080/orbitgen/We relied on the HEASOFT software package (version 6.30) for our analysis.
2.2.Large Area X-Ray Proportional Counter
The LAXPC instrument onboard the AstroSat satellite consists of three identical collimated detectors (LAXPC10,LAXPC20 and LAXPC30).The arrival times of each detected X-ray photon is recorded with a time resolution of 10 μs.The details of the characteristics of the LAXPC instrument are available in Roy et al.(2016),Yadav et al.(2016)and Agrawal
3.Results and Discussions
3.1.Timing Studies
The light curves have been generated using 2 s averaged count rates in 0.5–3 keV from SXT FW mode 2021 observations while light curves in 3–6 keV, 6–12 keV, 12–20 keV,20–30 keV, 30–40 keV and 40–80 keV energy bands were derived from LAXPC20 observations (Figure 2).Broad-band X-ray pulsations (P ~15.7s) are clearly seen in the light curves.Broad-band (0.5–80 keV) energy resolved pulsations are also observed in the light curves generated using the 2018 AstroSat observations of this pulsar.
We use the FTOOLS subroutine efsearch to obtain the best estimated pulse period of XTE J1946+274 from all the 285 ks LAXPC20 2021 observations in the 3–20 keV energy band.For this timing analysis we have extracted data only from the top layer of the LAXPC20 detector to get the best signal-tonoise ratio (SNR).The pulse period obtained from our timing analysis is 15.757818±0.000040 s.The pulsation peak inferred using efsearch was fitted with a Gaussian whose width provided the error on the estimated period.Similarly,the best estimated pulse period of XTE J1946+274 from the entire set of 140 ks LAXPC20 2018 observations is 15.757119±0.000086 s.Thereafter, we investigate the temporal evolution of the spin period of the source by estimating the pulse period for each 15 ks successive LAXPC20 observation segment and construct the evolution of the pulsar spin period since its discovery in 1998 which is shown in Figure 3.
It is observed that the pulsar spins-up during the outbursts but switches to spin-down state in the quiescent periods between the outbursts.This is consistent with the general finding of Malacaria et al.(2020) based on monitoring the pulsation periods of 39 accreting pulsar binaries, of which 28 are Be pulsars with the Fermi/Gamma Ray Burst Monitor(Fermi/GBM, Meegan et al.2009), that almost all the pulsars in the Be binaries undergo rapid spin-up during the outburst due to high accretion torque but at the end of the outburst they again switch to spin-down mode.It is also found that the spinup rates are higher(factor of ~2–5)compared to the spin-down rates.Over a long time the net spin period evolution exhibits a spin-up though at a very low rate of ~10-14s s-1.We estimate the changes in spin rates between the outbursts assuming that the pulsar spin-down rate is monotonic during the dormant periods.The estimated rates of spin changes during the dormant periods MJD 51727.5–55353, MJD 55677–58275 and MJD 58311–59481 are ~-8.26×10⁻¹²s s-1,~5.27×10⁻¹¹s s-1and ~6.89×10⁻¹¹s s-1respectively.Note that during the period MJD 51727.5–55353 the pulsar is in a dormant state, and yet the pulsar is showing a modest spin-up contrary to the general trend.However,the spin-up rate is an order of magnitude smaller compared to the spin-up rates generally deduced during the outbursts.

Figure 4.Plot of spin period derivative vs.12–50 keV pulsed flux from Fermi/GBM observations of the pulsar.The best fit estimate of the spin period derivative has been derived from linear fit to the data of spin evolution of the pulsar from Fermi/GBM observations.Values derived from the 2010,2018 and 2021 outbursts have been shown by pentagon,star and squares respectively.The values of the two parameters measured from the series of bursts from 2010 are depicted in different colors.The first, second, third, fourth and fifth bursts are marked in black, blue, green, gray and orange colors respectively.
Figure 4 plots a comparison between the spin period derivative and the 12–50 keV pulsed flux from Fermi/GBM observations of this pulsar.The values derived from a series of outbursts from 2010 are displayed in different colors.The values derived from the first, second, third, fourth and fifth outbursts are shown in black, blue, green, gray and orange colors respectively.There is suggestion of a linear trend between the pulsed flux in the 12–50 keV band and the spin-up rate.Based on correlation between the spin-up rate and flux it has been suggested that an accretion disk was present during the 1998 outburst of this pulsar (Wilson et al.2003).It is also observed from Figure 4 that the maximum 12–50 keV pulsed flux during the giant outburst in 2010 was about twofold more than that during the following four smaller outbursts.Interestingly, the maximum pulsed flux in the 12–50 keV energy band during the 2018 and 2021 outbursts of this pulsar are comparable to that during the giant outburst in 2010 suggesting that the underlying mechanism for these outbursts might be similar.Interestingly,from the estimated spin-up rates using Fermi/GBM observations, the low intensity outbursts have spin-up rate about a factor of 2 smaller than that estimated for giant outbursts.
3.2.Broad-band Energy Resolved Pulse Profiles
The background subtracted folded profiles in the 0.5–3 keV,3–6 keV, 6–12 keV, 12–20 keV, 20–30 keV, 30–40 keV and 40–80 keV energy band obtained from SXT and LAXPC20 observations from the 2018 and 2021 outbursts of this source are shown in Figure 5.We have extracted LAXPC20 data only from the top layer for 3–6 keV, 6–12 keV and 12–20 keV energy bands while data from all the layers have been extracted for 20–30 keV, 30–40 keV and 40–80 keV energy ranges.Broadly, the pulse profiles in the various energy bands appear similar for the 2018 and 2021 outbursts.It is, however, clearly observed that the pulse profiles evolve with energy in both the outbursts as also observed during earlier outbursts of this source(Wilson et al.2003; Maitra & Paul 2013; Arabací et al.2015;Marcu-Cheatham et al.2015;Doroshenko et al.2017a;Gorban et al.2021).On closer examination, one finds noticeable differences in the pulse shape and its amplitude.During the 2018 outburst,the pulse shape in 0.5–3 keV is composed of two peaks with the second peak relatively stronger than the first peak.The first peak has an asymmetric leading side while the leading side of the second peak has comparatively less asymmetricity.During the 2021 outburst, the SNR of the profile in this energy band is comparatively less and although two distinct peaks are observed, the asymmetricity on the leading edge of the first peak seems to have disappeared.
In both the outbursts, as the energy increases, the first peak gradually becomes relatively stronger, almost comparable to the amplitude of the second peak in the 12–20 keV energy band, and becomes the dominant peak above 20 keV.This transition in relative amplitudes of the two peaks has been observed during the 1998 outburst (Wilson et al.2003;Doroshenko et al.2017a), 2001 outburst (Wilson et al.2003), 2010 outburst (Maitra & Paul 2013; Marcu-Cheatham et al.2015) and 2018 outburst (Gorban et al.2021) of the source.The separation in phase between the two peaks is around 0.45 which may be attributed to emission from opposite poles of the neutron star.Interestingly, the phase separation of~0.45 is maintained as the two peaks slowly move toward later phases which is clearly observed in the 3–30 keV energy band.An additional emission component is clearly visible as a bump on the falling edge of the profile around pulse phase of 0.9 which is unclear during the 2018 outburst.Indications of weak emission components are discernible in the saddle between the two peaks in the 12–20 keV energy band and on the falling edge of the second peak in the 6–12 keV energy band which is prominent in the 2018 outburst.The minimum between the two peaks observed around phase ~0.4 becomes less shallow with increasing energy up to 20 keV and gradually disappears above 30 keV.Intriguingly,the minimum shifts to around phase ~0.6 in the 20–30 keV energy range.This shift in the minimum between the two peaks can also be observed during the 1998 outburst (Doroshenko et al.2017a), 2001 outburst (Wilson et al.2003) and 2018 outburst (Gorban et al.2021) of this source.Intriguingly, almost no shift in the minimum with energy is observed during the peak of the 1998 outburst of the source(Wilson et al.2003).The asymmetric nature of the first peak on the leading edge persists over a broad-band energy range from 0.5–80 keV although the asymmetricity slightly decreases in the 3–12 keV energy band.
We have investigated dependence of the Pulsed Fraction(PF, defined as PF = (Imax-Imin) (Imax+Imin) whereImaxandIminare the maximum and minimum intensities in the folded profile respectively.Plots of PF vs.energy are featured in Figure 6 for the 2018 and 2021 outbursts.The PF is highly energy dependent and varies with energy as shown in Figure 6.The PF increases with energy during both the 2018 and 2021 outbursts and peaks in the energy band of 30–40 keV before decreasing at higher energies.However, during the 2018 outburst, the increase in PF from 0.5–3 keV to 30–40 keV energy band is gradual while during the 2021 outburst a slight jump in PF from 0.5–3 keV to 3–6 keV energy band is observed.Enhancement in the PF with energy has also been observed in several X-ray pulsars and a geometrical model has been proposed to explain the observed manifestation(Lutovinov & Tsygankov 2009).However, there is some hint of decrease in the PF above 40 keV which may be attributed to the morphology of the accretion column of the pulsar.The asymmetricity of folded profiles in X-ray pulsars has been ascribed to various factors such as antipodal magnetic poles
(Parmar et al.1989;Leahy 1991;Riffert et al.1993; Bulik et al.1995; Kraus et al.1995; Sasaki et al.2012) or multi-polar magnetic fields (Greenhill et al.1998) or the asymmetric accretion stream in the vicinity of the neutron star (Basko &Sunyaev 1976; Wang & Welter 1981; Miller 1996).

Figure 5.Folded pulse profiles of XTE J1946+274 from the 2018 outburst are shown in different energy ranges(a)0.5–3 keV,(b)3–6 keV and 6–12 keV,(c)12–20 and 20–30 keV and(d)30–40 keV and 40–80 keV.The folded profiles in 0.5–3 keV,3–30 keV and 30–80 keV energy ranges are binned in 32 bins,128 bins and 64 bins respectively using MJD 58 278.49 as the epoch.Similar pulse profiles constructed from the 2021 outburst are shown in the same energy bands on the right side of the figure.The epoch used for folding profiles from 2021 observations is MJD 59490.57.

Figure 6.PF in different energy ranges vs.energy inferred from SXT and LAXPC20 observations of the 2018 and 2021 outbursts of the pulsar shown in the left and right panels respectively.
3.3.Spectral Studies
3.3.1.Spectral Studies Using 2018 Observations
We have extracted the energy spectra for the 2018 and 2021 outbursts by using the LAXPCSOFT software for the entire observation periods.We have performed a combined spectral fitting of SXT and LAXPC20 spectra using XSPEC 12.12.1(Arnaud 1996) in the energy range 0.5–80 keV for the 2018 outburst (Figure 7).The spectral fitting of combined SXT and LAXPC data is confined to 0.5–80 keV due to reliable spectral response in this energy range.A 2 per cent systematic was included in the spectral analysis to take care of uncertainties in the response matrix.The broad-band spectrum(0.5–80 keV)is fitted using the HIGHECUT, NEWHCUT, NPEX(Mihara 1995) and FDCUT (Tanaka 1986) models available in XSPEC.We applied the tbabs model (Wilms et al.2000) to take care of the broad-band absorption in the spectrum during spectral fitting.The abundance and atomic cross-section utilized in the photoionization model(tbabs)are angr and vern respectively.In addition, the iron emission line at ~6.6 keV was added to the combined best fit model.The results of the broad-band spectral analysis for the 2018 observations are given in Table 3.A gain correction has been applied to the SXT spectrum using the XSPEC command gain fit where the slope was frozen at unity and the offset obtained from the fit is expressed in Table 3.A constant factor has been included in the model to allow for cross calibration difference between the SXT and LAXPC spectrum.We freeze the constant factor at unity for the LAXPC spectrum while allowing this factor to vary for the SXT spectrum.The spectrum of the pulsar during the outburst is found to be slightly hard (Γ ~0.5).The absorption NHis deduced to be ~1×1022cm-2.We observe deviations in the fitted spectrum around 43 keV(Figure 7).An absorption line with a Gaussian optical depth profile gabs was added to the model.This model accounts for cyclotron resonant scattering features (CRSFs) in the spectrum of X-ray pulsars.
From the best fit spectrum the unabsorbed X-ray flux of XTE J1946+274 in the 0.5–80 keV energy interval in 2018 outburst is deduced to be in the range of ~2.1–2.5×10⁻⁹erg cm-2s-1which implies X-ray luminosity to be in the range of~2.3–2.7×1037erg s-1for a distance of 9.5 kpc for the source.
3.3.2.Spectral Studies Using 2021 Observations
We have performed broad-band (2–80 keV) spectral fitting of the SXT and LAXPC20 spectra for the 2021 observation(Figure 8).The broad-band spectral fitting is confined to the 2–80 keV energy range owing to relatively poorer SNR of the spectra compared to the 2018 AstroSat observations.We relied on the same models for spectral fitting as used earlier for the 2018 observations.The procedures of applying gain correction and accounting for cross calibration differences between the SXT and LAXPC20 spectra are already described in the previous section.The energy of the iron emission line was frozen at 6.4 keV during the spectral fitting.The results of the broad-band spectral fitting for the 2021 observations are given in Table 4.The spectrum of the pulsar during the 2021 outburst is found to be relatively soft (Γ ~0.9) compared to that of the 2018 outburst.The absorption NHis deduced to be ~3×1022cm-2from the four spectral models used to describe the broadband spectra.A Gaussian optical depth profile gabs was used to fit deviations in the fitted spectrum around 43 keV (Figure 8).The unabsorbed X-ray flux of XTE J1946+274 in the 0.5–80 keV energy interval for the 2021 outburst is estimated to be 2.1×10⁻⁹erg cm-2s-1which implies X-ray luminosity to be 2.3×1037erg s-1for a distance of 9.5 kpc for the source.
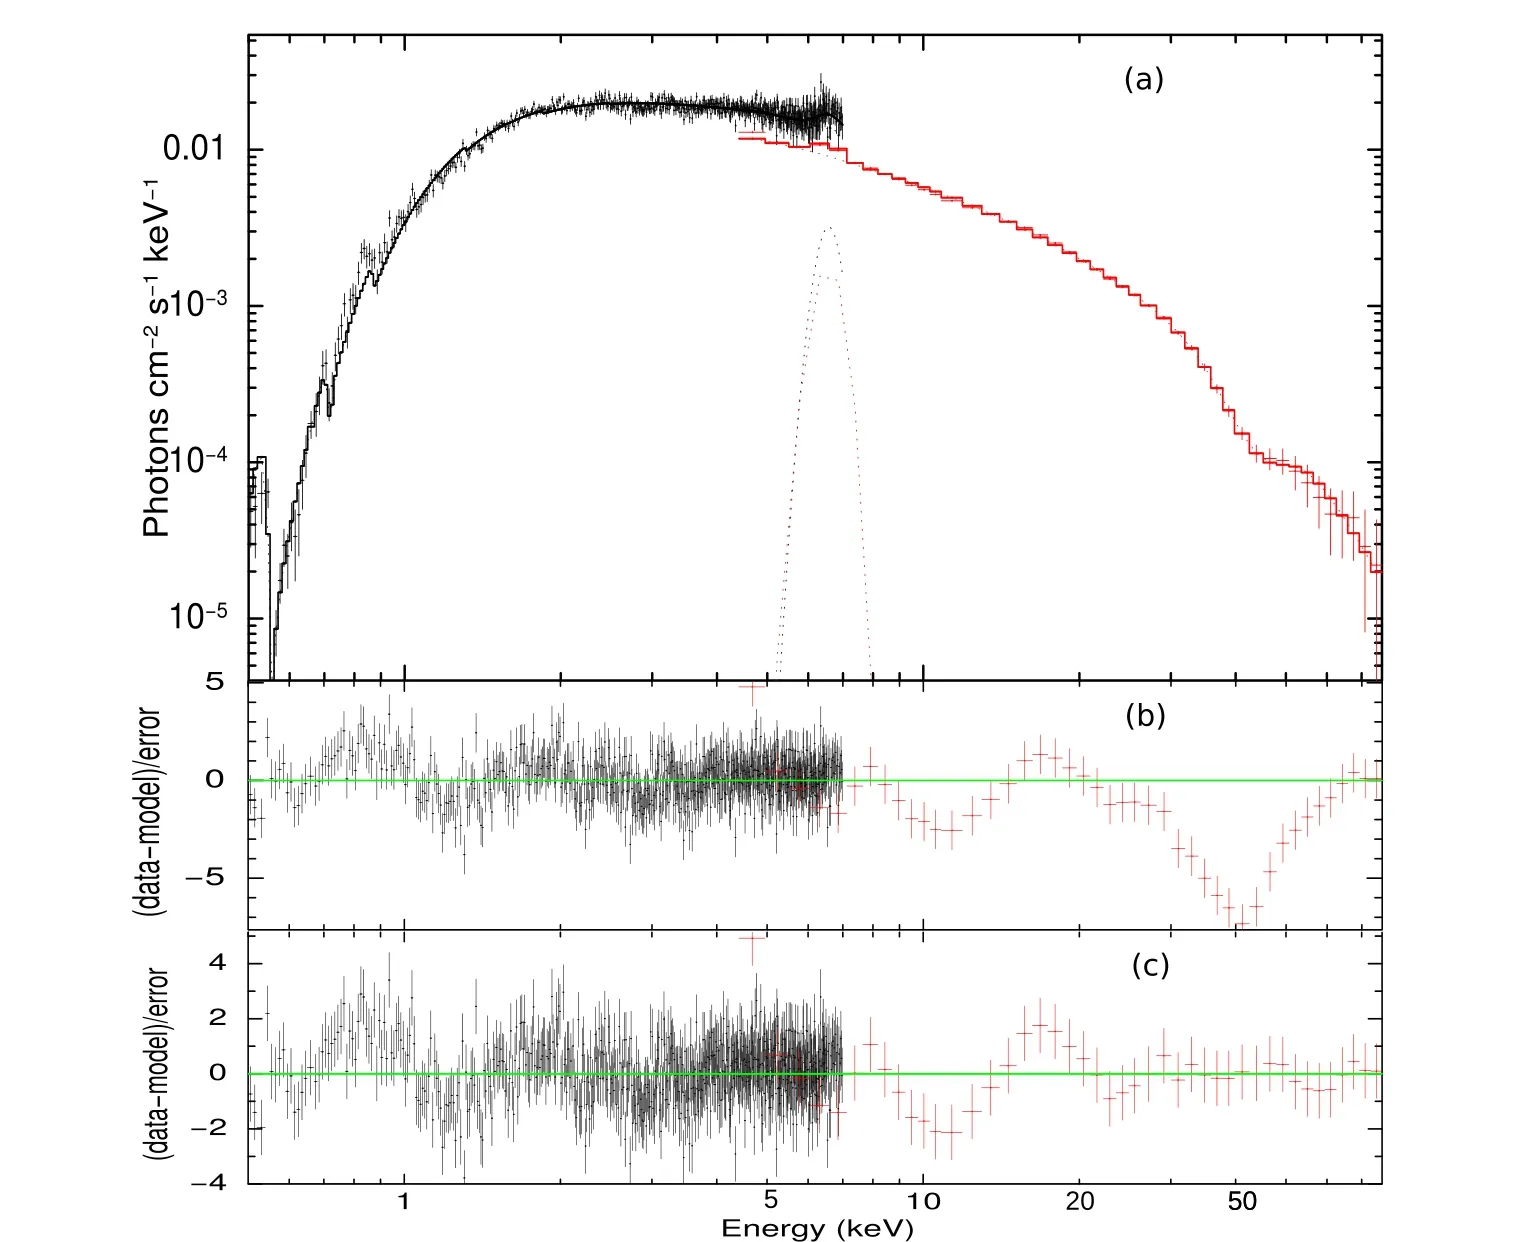
Figure 7.(a)Simultaneous fitted SXT and LAXPC spectrum of 2018 outburst using the power law with high energy cut-off model.The best-fitting model is shown by the solid line along with the spectral data.(b) The residuals between the data and the model are displayed without fitting for any cyclotron line absorption features.Prominent absorption residuals around 43 keV are clearly seen in the panel.(c)The residuals between the data and the model are shown after fitting a cyclotron line around 43 keV.The cyclotron line is detected with a significance of more than 3σ.
Table 5 summarizes characteristics of the cyclotron lines detected during different outbursts in this pulsar since its discovery in 1998.It is observed that the cyclotron line energy lies in the range of about 35–43 keV, except for the report of detection of a CRSF at ~25 keV in the RXTE observations during the 2010 outburst (Müller et al.2012).The six BeppoSAX observations of the 2010 outburst in 2010 October-November,listed in Table 5,lead to detection of cyclotron line at energy ranging from 35 to 40.8 keV.This suggests that either the line energy varies with the orbital phase or source intensity.The two Suzaku results,one based on the analysis by Maitra&Paul(2013),lead to energy of CRSF as 38.3 keV while analysis of the same Suzaku data by Marcu-Cheatham et al.(2015)yields a line energy of 35.16 keV.This suggests that the deduction of the line energy is dependent on the fitted model.This also casts doubt on the reality of the differences in the energy of the line inferred from different observations.
3.4.Accretion Regimes in XTE J1946+274
The pulse profiles are a manifestation of the complex plasma dynamics in the vicinity of the neutron star.The accreted material channeled along the magnetic field lines of the neutron star hits the surface of the neutron star and forms a mound which emits blackbody thermal radiation (Becker &Wolff 2007).As more accreted material falls near the surface of the neutron star, the thermal radiation from the mound increases and forms a shock at the interface between the mound and the infalling matter.This shock front rises away from the neutron star surface and forms an accretion column underneath(Basko & Sunyaev 1976).The formation and growth of these accretion columns are governed by the tug of war between gravity and radiation pressure.Depending on the X-ray luminosity, two regimes of accretion viz.sub-critical and super-critical accretion take place.The threshold luminosity which separates these two accretion modes is known as the critical luminosity (LX,crit, Becker et al.2012).The accretion stream is decelerated by thermal electrons through Coulomb forces in the sub-critical accretion mode (LX<LX,crit) and radiation is emitted along the local magnetic field lines giving rise to a “pencil-beam”pattern.In the other accretion regime(LX>LX,crit),formation of an accretion column takes place and maximum radiation is emitted perpendicular to the magnetic dipole axis resulting in a “fan-beam”pattern.The critical luminosity is given by Becker et al.(2012),

Figure 8.(a)Simultaneous fitted SXT and LAXPC spectrum for the 2021 outburst using the power law with high energy cut-off model.The solid line shows the bestfitting model along with the spectral data.(b) Prominent absorption residuals around 43 keV are clearly seen in the panel without fitting for any cyclotron line absorption features.(c)A cyclotron line around 43 keV is fitted to the model and residuals between the data and the model are shown in the panel.The significance of detection of the cyclotron line is more than 3σ.
where Λ is a constant parameter (Λ=1 for spherical accretion and Λ <1 for disk accretion,Becker et al.2012),w depends on the spectrum in the accretion column and w=1 for the dominant bremsstrahlung emission inside the accretion column(Becker&Wolff 2007)and M*,R*and B*are the mass,radius and magnetic field of the neutron star respectively.Using typical neutron star parameters M*=1.4 M⊙, R*=10 km,Λ=0.1 and w=1,LX,crit= 1.49 × 1037erg s-1B112615, where B12is the surface magnetic field strength (Becker et al.2012).For a surface magnetic field of about 3.1×10¹²G in XTE J1946+274 (Heindl et al.2001), the estimated critical luminosity is LX,crit~5×1037erg s-1.
An updated version of the critical luminosity was calculated by Mushtukov et al.(2015) given by,
where κeffis the effective opacity,d(d ≪R*)is the diameter of a bright axisymmetric spot created on the neutron star surface due to heating by the accreting matter,κT≈0.34 cm2g-1is the Thomson scattering opacity for solar composition material and(Mushtukov et al.2015).
In the sub-critical emission regime, the accreted matter can be decelerated by the radiation shock followed by Coulomb interactions for moderate sub-critical luminosities(LX≾LX,crit)while at even lower luminosities (LX≾LX,Coul) the radiation shock and Coulomb braking mechanism disappear and the accreted matter falls through a gas-mediated shock before hitting the neutron star surface (Langer & Rappaport 1982;Becker et al.2012).The Coulomb luminosity LX,Coulis given by Becker et al.(2012),
where τ*~20 is the Thomson depth required for the accreted gas to be effectively stopped via Coulomb interactions(Beckeret al.2012).Using typical neutron star parameters Λ=0.1,τ*=20,M*=1.4 M⊙,R*=10 km and B*~3.1×10¹²G for XTE 1946+274 we obtain LX,Coul~8×1036erg s-1.Thus,the accretion luminosities during the 2018 and 2021 outburst of this pulsar are ~2.7×1037erg s-1and ~2.3×1037erg s-1which lie in the sub-critical regime (LX<LX,crit) such that LX>LX,Coul.In this accretion regime, the emission beam pattern can be described by a combination of a “pencil-beam”and a“fan-beam”(ref.schematic illustration shown in Figure 1 of Becker et al.2012).It should be noted that XTE J1946+274has been observed during outbursts by and large in this subcritical accretion regime and hence the pulse profiles and likely the underlying beam pattern do not show any significant temporal evolution.Several pointed observations of the pulsar during different luminosity levels in future outbursts of this pulsar can be helpful to probe luminosity dependent profile evolution in this pulsar in more detail.
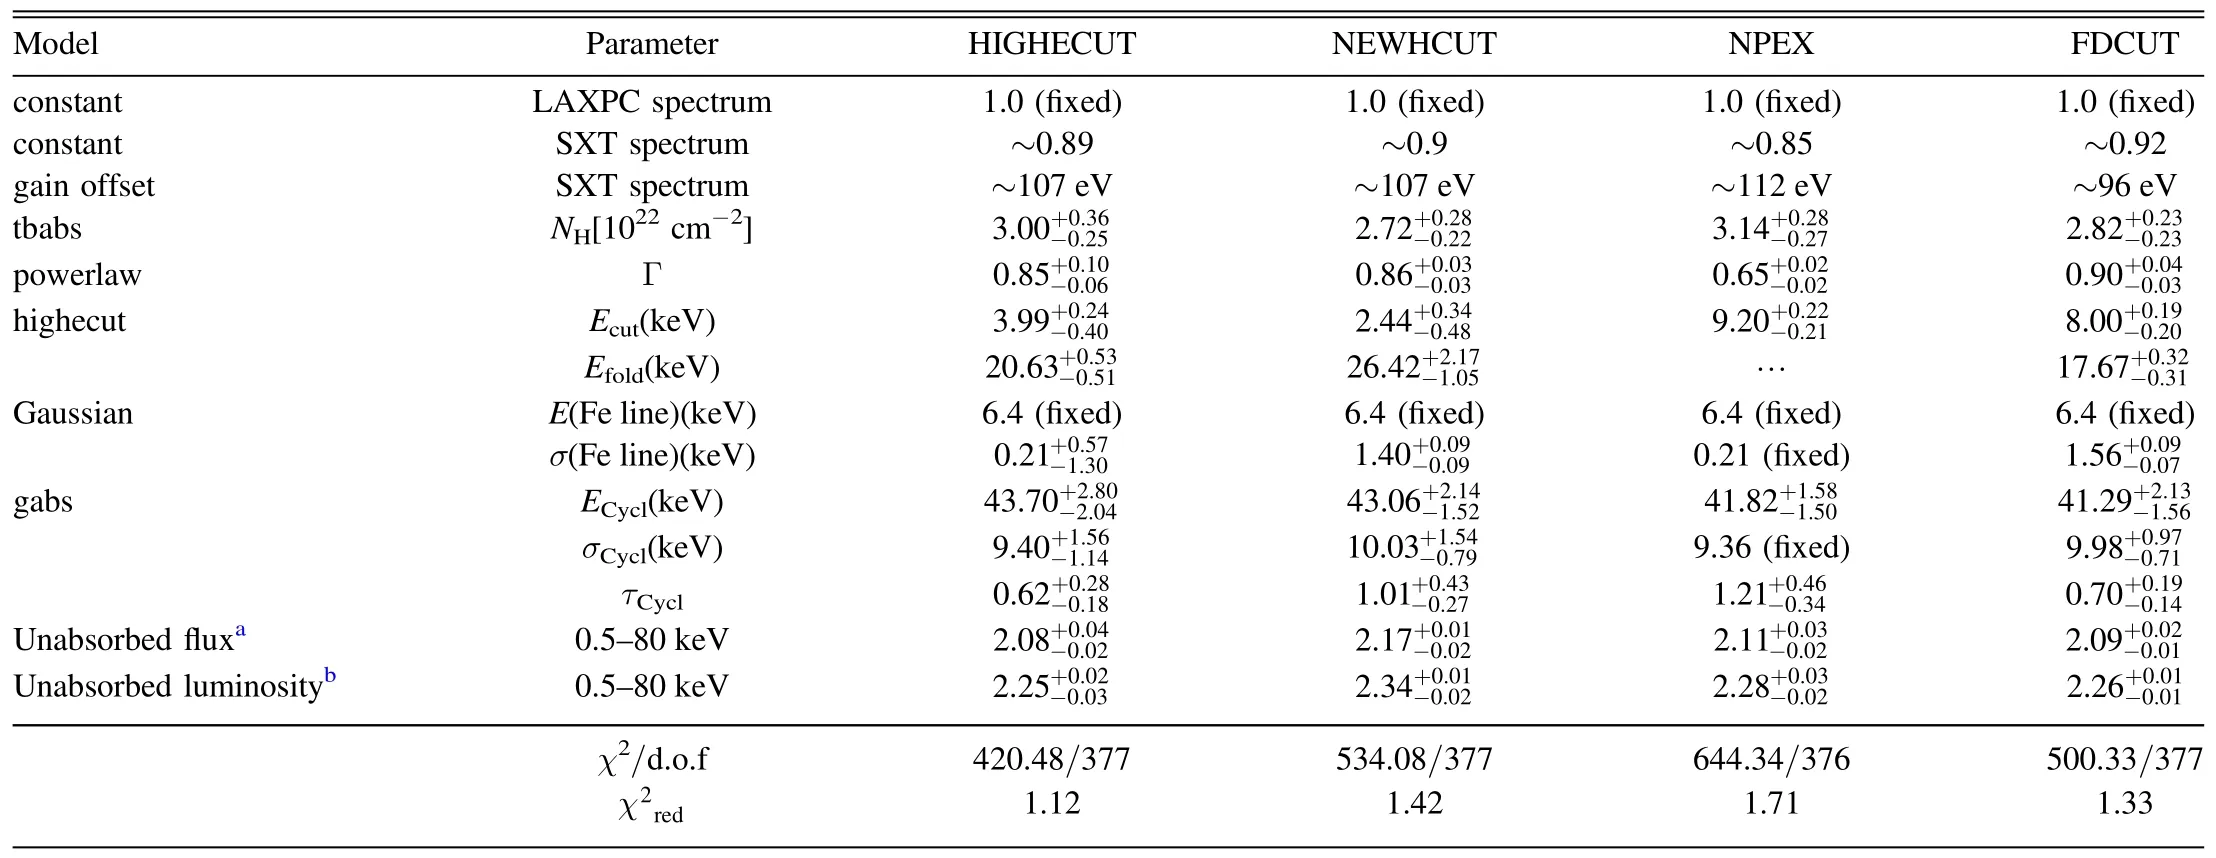
Table 4 SXT and LAXPC Simultaneous Spectral-fit Results for XTE J1946+274 using Data from 2021 AstroSat Observations of XTE J1946+274
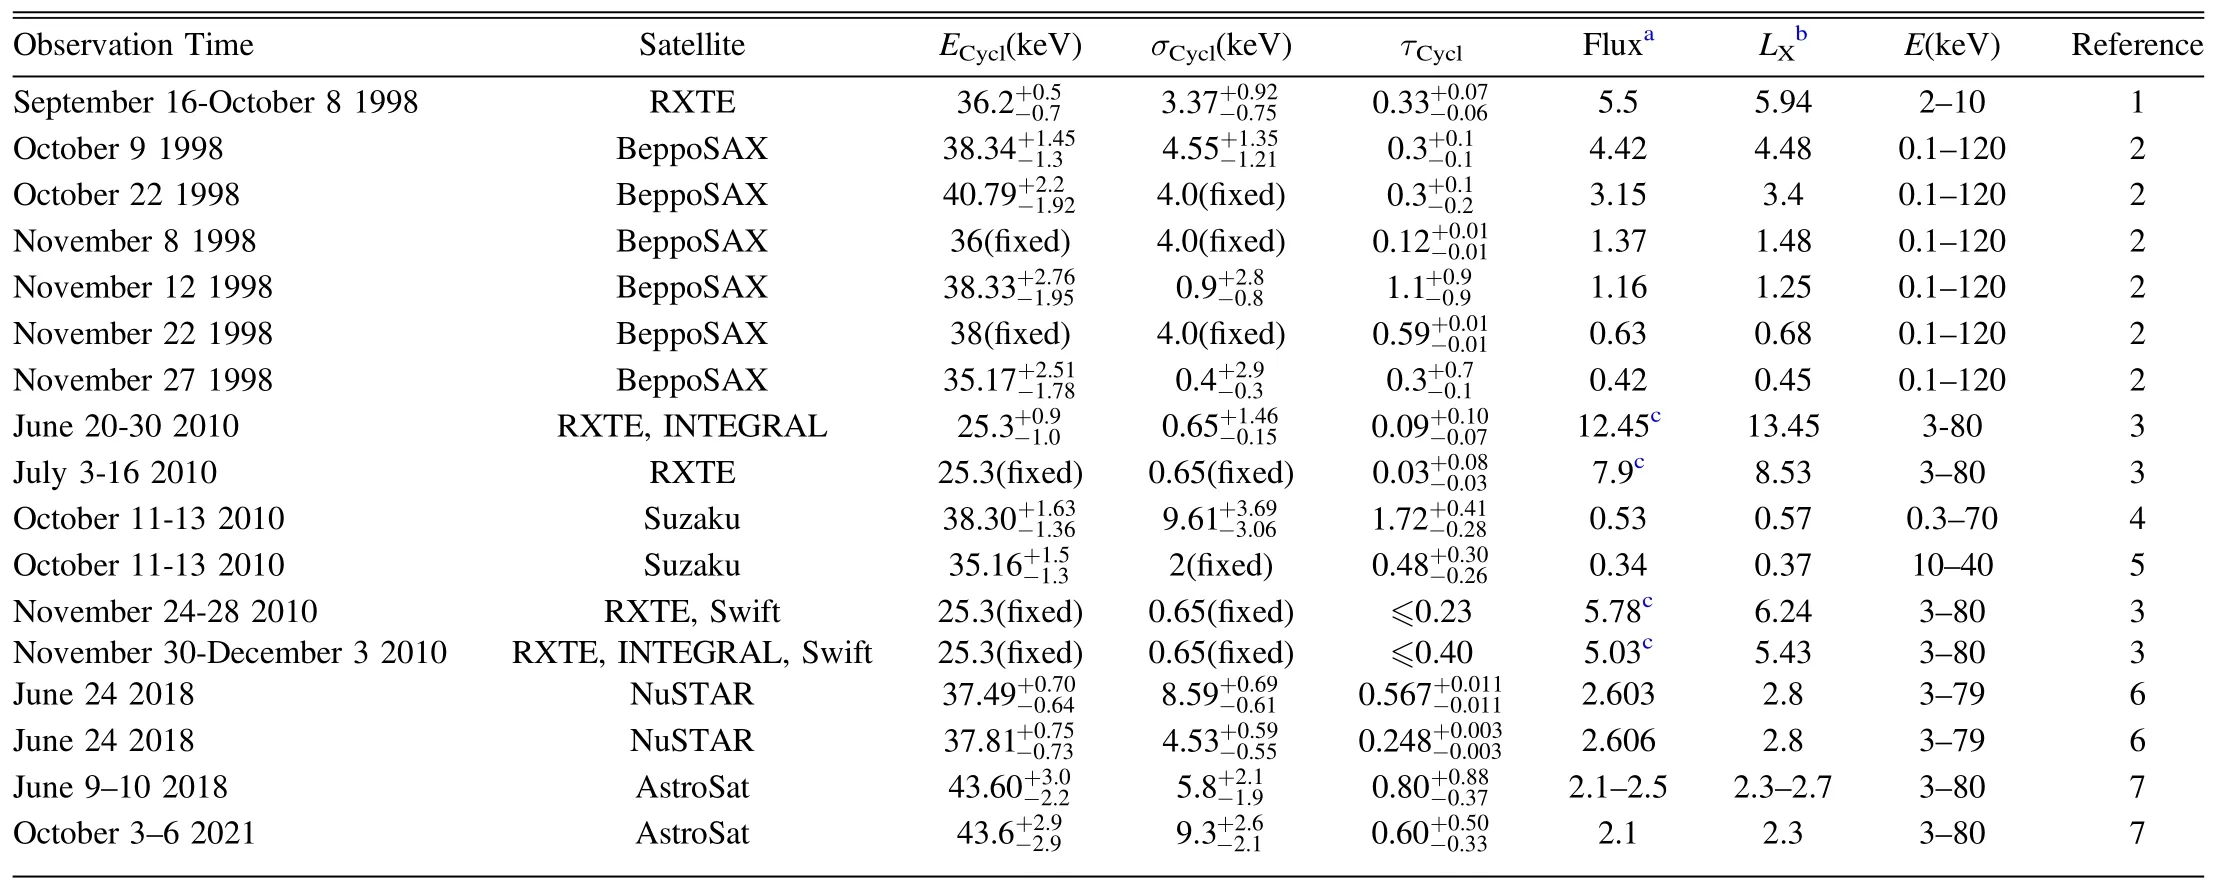
Table 5 List Showing Characteristics of Cyclotron Lines Detected during Outbursts in the X-Ray Pulsar XTE J1946+274
3.5.Exploring Dependence of Peak Separation on X-Ray Luminosity
We compute the relative separation between the two peaks in the pulse profiles (the two peaks are clearly detected for energies below 20 keV)and explore its possible dependence on X-ray luminosity using the 2018 and 2021 AstroSat/LAXPC observations and from the pulse profiles reported in literature(Wilson et al.2003; Doroshenko et al.2017a; Gorban et al.2021).It should be noted that although the pulse profiles evolve with energy, the relative separation between the two peaks in the pulse profiles remains nearly constant with energy for energies below 20 keV.Above 20 keV the second peak in the pulse profile usually becomes flat and it becomes difficult to estimate the relative separation between the two peaks in the pulse profiles.We observe a possible anti-correlation between the separation of the peaks in the pulse profiles and the X-ray luminosity as shown in Figure 9.The vertical dotted lines drawn in Figure 9 signify the estimated Coulomb luminosity(LX,Coul~8×1036erg s-1) and critical luminosity(LX,crit~5×1037erg s-1) of the pulsar.Indication of correlation between the separation of the peaks in the pulse profiles and the X-ray luminosity has been observed in another Be X-ray binary pulsar SXP 1062 by Cappallo et al.(2020).We note this trend is opposite to what is noticed in XTE J1946+274.It has been suggested that the critical luminosity marks the transition in the beam profile shape from “pencil-beam”to“fan-beam”(Becker et al.2012).Changes in the beam pattern of the pulsar with luminosity would manifest as changes in the pulse shape and separation between the peaks in the folded profiles.It is expected that as the pulse profile becomes dominated by the “fan-beam”pattern with concomitant formation of an accretion column with increasing luminosity(LX≿LX,crit,Becker et al.2012),photons are primarily emitted from the side of the accretion column and so the separation between the peaks in the folded profile should also increase.
3.6.Exploring Dependence of Cyclotron Line Energy on X-Ray Luminosity
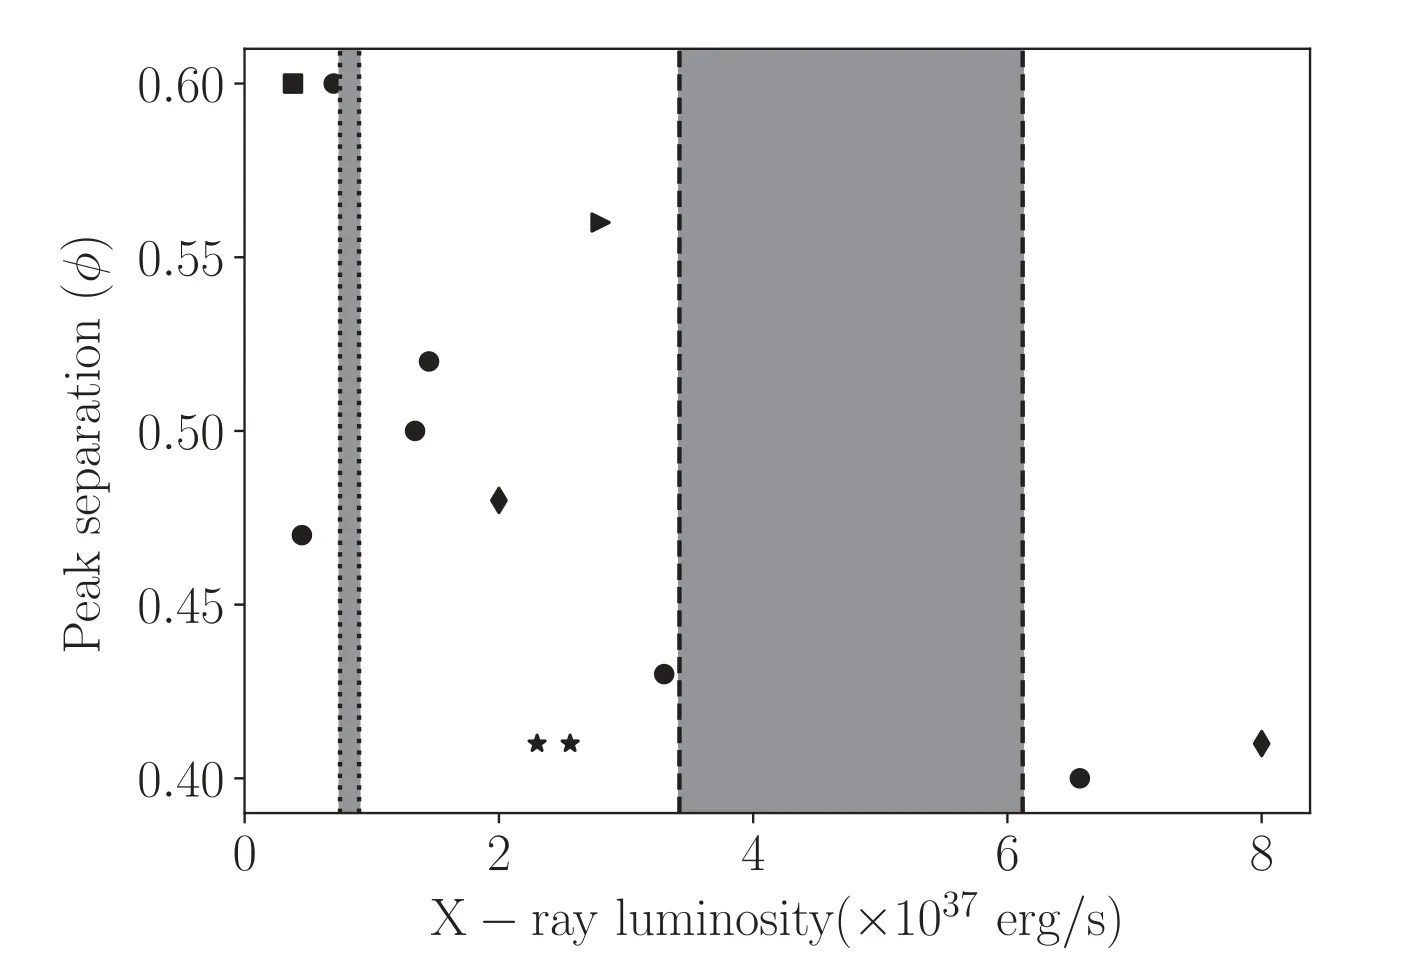
Figure 9.Peak separation vs.X-ray luminosity for pulse profiles used in this study and those obtained from literature (♦: Wilson et al.2003, ·: Doroshenko et al.2017a,.:Maitra&Paul 2013,▶:Gorban et al.2021,★:this work).The gray-shaded regions bordered with dotted and dashed lines show the range of possible values for LX,Coul and LX,crit respectively using different magnetic field values inferred from cyclotron line energies tabulated in Table 5.
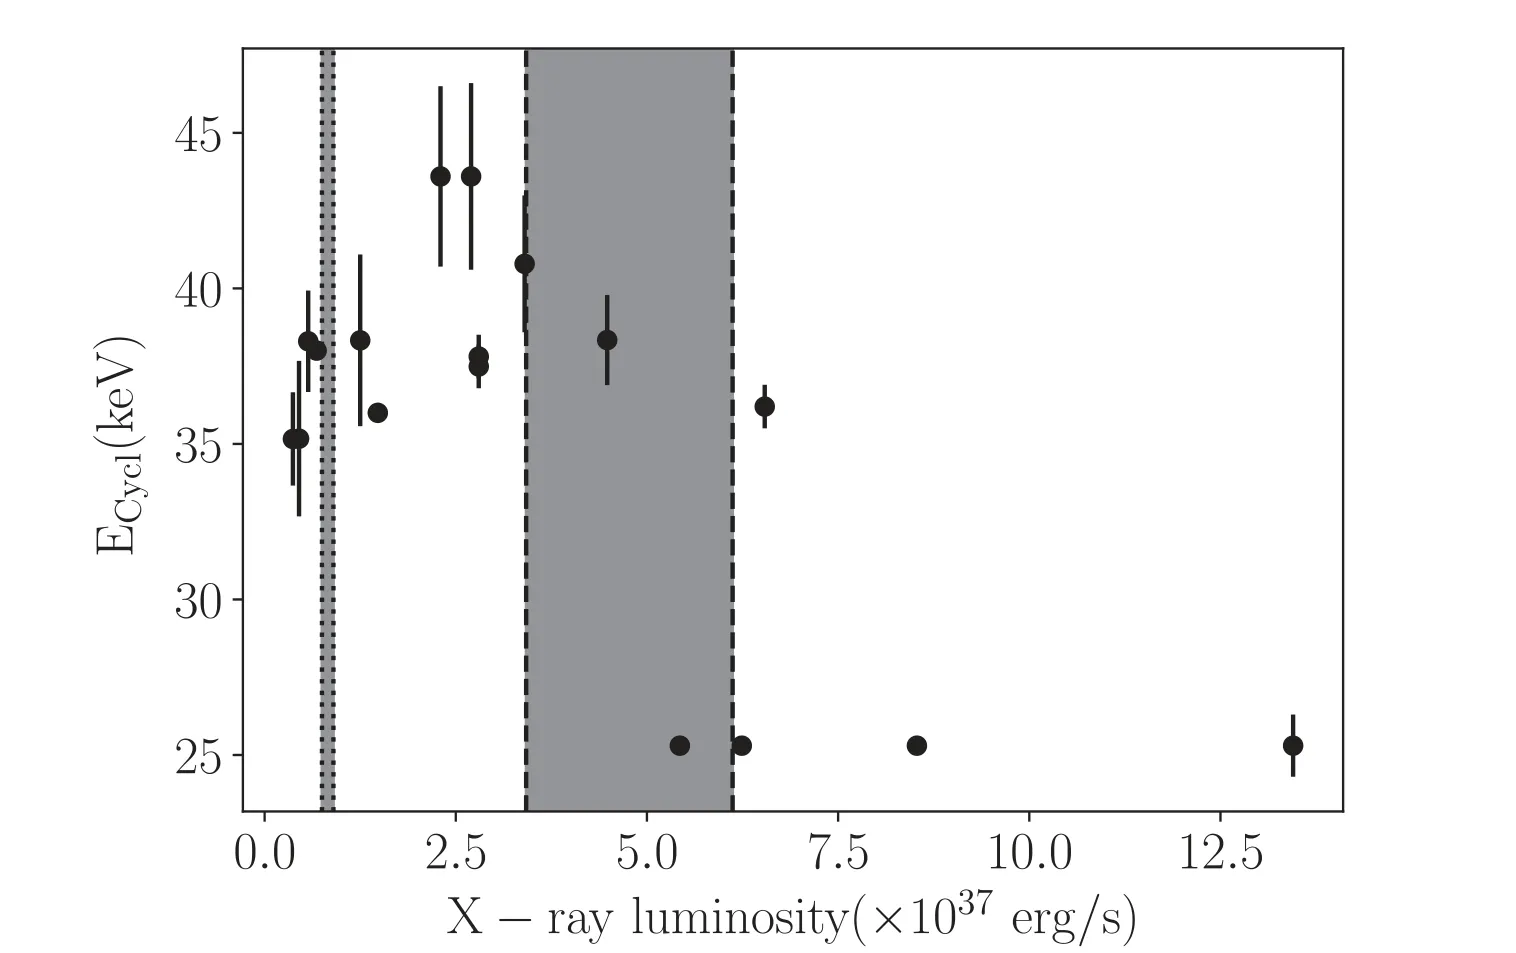
Figure 10.Dependence of cyclotron line energy on X-ray luminosity for XTE J1946+274.The gray-shaded regions bordered with dotted and dashed lines show range of possible values for LX,Coul and LX,crit respectively using different magnetic field values inferred from cyclotron line energies tabulated in Table 5.
We investigate variations of cyclotron line energy with X-ray luminosity in Figure 10.There is suggestion of positive correlation of cyclotron line energy with luminosity until around LX~3×1037erg s-1after which negative correlation is observed.Negative correlation of cyclotron line energies with luminosities has been detected in transient Be/XRBs V 0332+53(Makishima et al.1990; Mihara 1995; Tsygankov et al.2006)and SMC X-2(Jaisawal&Naik 2016).A positive correlation of cyclotron line energy with luminosity has been detected in five accreting pulsars: Vela X-1 (Fuerst et al.2013; La Parola et al.2016), A 0535+26 (Klochkov et al.2011; Sartore et al.2015),GX 304-1 (Yamamoto et al.2011; Malacaria et al.2015;Rothschild et al.2017),Cep X-4(Vybornov et al.2017)and 4U 1626.6-5156 (DeCesar et al.2012).

Figure 11.RXTE/ASM one day averaged light curve of the 1998 outburst of XTE J1946+274 shown in the top panel.Swift/BAT one day averaged light curve of the 2010, 2018 and 2021 outbursts of XTE J1946+274 are shown in the second, third and fourth panels (top to bottom).
Interestingly,in the transient Be binary V0332+53,a negative correlation between cyclotron line energy and luminosity was detected at high luminosity which reversed to a positive correlation at lower luminosity during end phases of an outburst(Doroshenko et al.2017b;Vybornov et al.2018).The reversal in the correlation between the cyclotron line energy and luminosity was separated by the critical luminosity for this source and was suggested to be caused due to variation in the emission region geometry (Doroshenko et al.2017b).However, we note that in case of XTE J1946+274,the possible reversal in the correlation between the cyclotron line energy and luminosity is ~3×1037erg s-1which is slightly less than the estimated critical luminosity of ~5×1037erg s-1for this source.It is likely that the possible reversal in the correlation between the cyclotron line energy and luminosity in XTE J1946+274 is also due to changes in emission geometry of the pulsar.Further luminosity resolved spectral investigations of XTE J1946+274 during future outbursts are required to confirm the observed behavior between cyclotron line energy and luminosity.
3.7.Variety of Outbursts in XTE J1946+274
XTE J1946+274 is an enigmatic Be/XRB which has undergone four outbursts since its discovery more than two decades ago in 1998.Figure 11 shows X-ray monitoring observations of the outbursts detected in this pulsar using the RXTE/ASM during 1998–2001 and using the Swift/BAT during the 2010–2011, 2018 and 2021 outbursts.It is observed that the pulsar has undergone outbursts which differ in duration,outburst pattern, number of outbursts during multiple outbursts in 1998 and 2010 and brightness of outbursts.XTE J1946+274 remained active from 1998 September–2001 July, undergoing 13 outbursts that were not locked in orbital phase(Wilson et al.2003).Intriguingly,the alternate outbursts were slightly brighter during this unusual outburst episode of the pulsar and the X-ray flux did not drop significantly between the outbursts suggesting that accretion was not quenched during this active period.It is interesting to note that the low intensity outbursts during the 2010 extended outburst of the source had almost half of the peak intensity of the initial giant outburst as also seen in the 1998 outburst.The remarkable similarity in the outburst pattern during the 1998 and 2010 outbursts suggests a clock-like mechanism in the underlying phenomena driving outbursts in this Be/XRB.
The duration and outburst pattern of the 2018 and 2021 outbursts were remarkably different compared to the earlier 1998 and 2010 outbursts, as only a single outburst lasting for about a few weeks was detected during their active phase.Intriguingly,these outbursts were also not phase locked similar to the previous outbursts.The peak intensities of the 2018 and 2021 outbursts were about 0.04 counts s-1and 0.02 counts s-1respectively from Swift/BAT observations.Interestingly, the peak intensities of the 2018 and 2021 outbursts were comparable to the peak intensity of the giant outburst and low intensity outbursts in 2010 respectively.The outbursts detected in this pulsar have different decay profiles which may be classified in two broad categories: (I) a single giant Type II outburst like those detected in the 2018 and 2021 episodes reported in this paper.(II) in the second category the giant outburst is followed by several low intensity periodic outbursts modulated at half of the orbital period of the system but are not locked in orbital phase.The outbursts having a single giant outburst decay profile are also not locked to orbital phase and do not have any postcursors.
3.8.Possible Drivers of Unusual Outbursts
The giant outbursts detected in XTE J1946+274 are rare and similar to the Type II outbursts detected in the other Be binaries.The peak luminosity during the 1998 outburst was about 8×1037erg s-1in the 2–60 keV energy range(Doroshenko et al.2017a).The luminosity of two low intensity outbursts observed during 2001 was about 2×1037erg s-1in the 2–60 keV energy range (Doroshenko et al.2017a).The inferred unabsorbed luminosities during the 2018 and 2021 outbursts of this pulsar from AstroSat observations are about 2.7×1037erg s-1and 2.3×1037erg s-1in the 0.5–80 keV band respectively.The range of accretion powered peak luminosities detected during outbursts in this pulsar is about 2–8×1037erg s-1which is comparable to the typical luminosity (1037erg s-1) observed during giant (Type II)outbursts in Be/XRB systems.
From investigation of Hα line profiles during the 1998–2001 outbursts,Wilson et al.(2003)inferred that the dynamics of the decretion disk around the Be star play a crucial role in driving X-ray outbursts in this peculiar Be/XRB.In addition to warping of the misaligned Be star disk(Arabací et al.2015),it has been suggested that mass outflow from the Be star could also trigger a giant outburst in this Be binary (Wilson et al.2003).From optical/infrared brightening in the Be star,Arabací et al.(2015) suggested that an X-ray outburst of this source was imminent in about two yr(i.e.,around 2017)likely due to mass ejection from the Be star.Indeed, we detect an outburst in this Be/XRB around 2018 June which suggests that the impending outburst was delayed by about a year.Interestingly, the next outburst in this source was detected around 2021 September which is about 3 yr after the 2018 outburst while the gap between the 2010–2011 and 2018 outburst was about 7 yr which is almost double the 3 yr duration.This suggests that the elusive phenomena which trigger outbursts in this Be/XRB (likely ejection of mass from the Be star and factors such as the structure and dynamics of the decretion disk) took almost double time to reach their threshold to trigger the 2018 outburst.
The unusual outbursts detected during 1998–2001 and 2010–2011 which showed two outbursts per orbit and were not locked in orbital phase pose a conundrum.It was suggested that a decretion disk misaligned with the orbital plane of the binary system could produce two outbursts per orbit but then they should be fixed in orbital phase which is not the case in this system(Wilson et al.2003).Using three-dimensional(3D)simulations it has been shown that the strong gravitational field of the neutron star can distort the Be disk and form strong asymmetric structures in the disk (Okazaki et al.2011), which could likely lead to multiple X-ray outbursts in an orbit(Müller et al.2012).Another alternative proposition was that these outbursts could be triggered by a combination of density variations in the Be disk and orbital effects(Müller et al.2012).A long-term multiwavelength monitoring campaign of this pulsar is required to better probe the underlying phenomena which trigger outbursts in this Be/XRB.
3.9.Von Zeipel–Lidov–Kozai Disk Oscillations Mediated Giant Outbursts in XTE J1946+274?
A sufficiently misaligned decretion disk around a Be star can become highly eccentric (Martin et al.2014) due to Von Zeipel–Lidov–Kozai (ZLK) oscillations (Von Zeipel 1910;Kozai 1962; Lidov 1962).This is due to exchange between inclination and eccentricity of a misaligned orbit around one component of a binary.A Be/XRB system can exhibit ZLK disk oscillations mediating giant (Type II) outbursts provided two conditions are fulfilled (Martin et al.2014).First, the decretion disk around the Be star must be inclined with respect to the orbital plane of the binary system and this inclination should exceed 39°, the critical angle required for the onset of ZLK oscillations but it varies for thick decretion disks depending on characteristics of the disk (Lubow &Ogilvie 2017).Second,the orbital period of the binary must be short enough to allow the Be star disk to expand sufficiently far to overflow its Roche lobe during a ZLK oscillation and transfer mass onto the neutron star to trigger an outburst.XTE J1946+274 has a misaligned decretion disk which has been suggested in earlier studies (Wilson et al.2003; Arabací et al.2015).However, the misalignment angle is not known and needs to be ascertained from future optical observations of this source.There are several Be/XRB systems which exhibit Type II outbursts but have a long orbital period including XTE J1946+274.1A 0535+262,Swift J1626.6–5156 and GRO J1008-57 have orbital periods of about 111 days(Finger et al.1996),132 d (Baykal et al.2010) and 250 d (Kühnel et al.2013)respectively but show giant outbursts.In order for ZLK disk oscillations to drive giant outbursts in 1A 0535+262 and Swift J1626.6-5156,the decretion disk must not be very flared while in the case of GRO J1008-57, the disk aspect ratio must be close to constant in terms of radius (Martin et al.2014).Similarly, for ZLK oscillations to operate in XTE J1946+274,the disk around the Be star should not be very flared.It has been suggested from observations in some Be/XRB systems that giant (Type II) outbursts occur when the decretion disk around the Be star becomes warped (Negueruela et al.2001;Reig et al.2007; Moritani et al.2013; Ducci et al.2019).Similarly, warping of the Be disk is surmised to trigger giant outbursts in XTE J1946+274 (Arabací et al.2015).However,Martin et al.(2014) demonstrated using 3D smoothed particle hydrodynamics simulations of Be/XRB systems that warping of a Be star disk alone is not a sufficient condition to trigger giant outbursts in these systems but it is necessary for the decretion disk to become eccentric.
In a very recent work, Franchini & Martin (2021) reported that ZLK disk oscillations can drive a pair of giant (Type II)outbursts separated by several orbital periods in Be/XRBs.The first Type II outburst is triggered due to the misaligned Be disk which undergoes ZLK oscillations while the second Type II like outburst is driven by the eccentric accretion disk around the neutron star which may also undergo ZLK oscillations and lead to enhanced mass transfer onto the neutron star(Franchini&Martin 2021).It is suggested that the second outburst of the outburst pair is comparatively smaller than the first outburst(Franchini & Martin 2021) which is also observationally detected in 4U 0115+63 wherein the second outburst is less luminous among the outburst pair (Reig & Blinov 2018).Interestingly, in the case of XTE J1946+274, we find that the 2021 outburst occurred almost 3 yr after the 2018 outburst and was less luminous than the 2018 outburst.If we surmise that the 2018 and 2021 outbursts form an outburst pair, then XTE J1946+274 may be another source such that an outburst pair has been detected in which the second giant outburst is less luminous than the first outburst.
The gap between the 1998–2001, 2010–2011, 2018 and 2021 outbursts in XTE J1946+274 are ~19.2 Porb,~14.9 Porband ~6.4 Porb(using Porb~171 days) respectively.This inferred timescale is similar to the estimated timescale between two giant outbursts (about ~12 Porb) obtained from numerical hydrodynamical simulations of ZLK oscillations in the Be disk and the accretion disk around the neutron star (Franchini &Martin 2021).Similar timescales between consecutive giant outbursts have been observed in other Be/XRB sources such as in 4U 0115+63, 1A 0535+262 and SAX J2103.5+4545.Although the gap between the 2018 and 2021 outbursts in XTE J1946+274 is slightly less(~6.4 Porb,roughly half of 12 Porb),interestingly,the 2021 outburst was fainter by about a factor of~2 as suggested by the hydrodynamical simulation by Franchini & Martin (2021) for Be/XRBs.A detailed hydrodynamic simulation of this system is required to explore and better understand the ZLK disk oscillations mediating giant outbursts in this enigmatic Be/XRB which is beyond the scope of this paper.
4.Summary and Conclusion
We have detected broad-band X-ray pulsations from XTE J1946+274 using the SXT and LAXPC instruments onboard the AstroSat mission during the rare 2018 and 2021 outbursts of this Be/XRB system.The 2018 and 2021 outbursts were single outbursts unlike the prolonged outburst series detected in 1998 and 2010.We construct the spin evolution of the pulsar for over two decades and find that the pulsar spins up during outbursts and usually spins down during dormant periods.Broad-band energy resolved pulse profiles of the pulsar have been generated which evolve with energy, and subtle changes in profiles during the two singular outbursts studied with AstroSat are detected.The energy spectrum of the pulsar has been derived over the 0.5–80 keV band from the combined SXT and LAXPC observations.We find an inkling of reversal in the correlation between the cyclotron line energy and luminosity which needs to be verified from future observations of this pulsar.We discuss possible mechanisms which can drive these unusual Type II outbursts in this Be/XRB system and suggest that multiwavelength observations and detailed hydrodynamic simulations of this system can shed more light on the underlying phenomena which trigger a rare motley of outbursts in this source.
Note:A very recent work Devaraj&Paul(2022)came to our notice after the preparation of our manuscript.A quick glance at the manuscript shows similar inference for the 2018 outburst and in any case our results for the 2021 outburst are new.
Acknowledgments
We are extremely thankful to the reviewer for carefully going through the manuscript and making valuable and constructive suggestions that improved the presentation of this paper.This publication uses data from the AstroSat mission of the Indian Space Research Organisation (ISRO), archived at the Indian Space Science Data Centre (ISSDC).We thank members of the LAXPC instrument team at TIFR and the AstroSat project team at URSC for their contributions to the development of the LAXPC instrument.We thank the LAXPC POC at TIFR for verifying and releasing the data.LAXPCSOFT software (http://astrosat-ssc.iucaa.in/laxpcData) is used for analysis in this paper.This work has also used the data from the Soft X-ray Telescope (SXT)developed at TIFR, Mumbai, and the SXT POC at TIFR is thanked for verifying and releasing the data via the ISSDC data archive and providing the necessary software tools.This research has made use of software provided by the High Energy Astrophysics Science Archive Research Center (HEASARC),which is a service of the Astrophysics Science Division at NASA/GSFC and the High Energy Astrophysics Division of the Smithsonian Astrophysical Observatory.This research has also made use of the Fermi/GBM (Meegan et al.2009) pulsar spin evolution history provided by the Fermi team.This research has also made use of the CGRO/BATSE pulsar spin evolution history provided by the BATSE team.This research has made use of the MAXI light curve provided by RIKEN, JAXA, and the MAXI team.
Data availability
This research has made use of data from the AstroSat mission archived at the Indian Space Science Data Centre(ISSDC).The archival data from the AstroSat mission is publicly available at https://www.issdc.gov.in/astro.html.The CGRO/BATSE pulsar spin evolution history for XTE J1946+274 provided by the BATSE team is available at https://gamma-ray.nsstc.nasa.gov/batse/pulsar/data/sources/groj1944.html.The Fermi/GBM pulsar spin evolution history for XTE J1946+274 provided by the Fermi team is available at https://gamma-ray.nsstc.nasa.gov/gbm/science/pulsars/lightcurves/xtej1946.html.
ORCID iDs
Amar Deo Chandra https://orcid.org/0000-0001-8345-3125
Jayashree Roy https://orcid.org/0000-0002-2329-5863
P.C.Agrawal https://orcid.org/0000-0003-3949-3028
 Research in Astronomy and Astrophysics2023年4期
- Research in Astronomy and Astrophysics的其它文章
- Study of Central Intensity Ratio of Seyfert Galaxies in Nearby Universe
- The Variability and Radial Velocity of Planetary Nebula Central Stars
- Period Investigation on Two W UMa Binaries HH UMa and V1175 Her
- 3D Kinematics of Classical Cepheids According to GaiaEDR3 Catalog
- Constraining the Temperature-density Relation of the Inter-galactic Medium from Analytically Modeling Lyα Forest Absorbers
- Influence of Solar Activity on Precise Orbit Prediction of LEO Satellites
