
基于低氧-免疫DNA甲基化标记在肺癌中的开发
2023-04-29 21:11:43熊曙光周晴熊沿高英杰屈小敏彭确昆
四川大学学报(自然科学版) 2023年1期
熊曙光 周晴 熊沿 高英杰 屈小敏 彭确昆


为了探究缺氧和免疫联合分析DNA甲基化位点在肺癌预后中的作用,提高肺癌免疫治疗的有效性,本研究基于甲基化和转录组二维数据,构建了一个用于预后评估的风险评分模型.从TCGA数据库中下载了247个与缺氧、免疫状态相关的去冗余肺癌样本作为训练集.然后对低缺氧-强免疫状态的样本、高缺氧-弱免疫状态的样本进行了差异基因表达、甲基化位点和临床生存率分析.生存曲线分析显示,低缺氧状态-强免疫状态组中的肺腺癌患者的1、3、5年生存率均优于高缺氧状态-弱免疫状态组(log-rank检验,P<0.05、P<0.001、P<0.001).使用LASSO回归构建的多基因预后模型包含9个甲基化位点,在肺腺癌测试数据集和验证数据集中均显示出良好的预后预测能力(AUC=0.83,0.80,0.82).这9个甲基化位点分别分布在PEBP4、FLI1、HLA-DMB、MYO1F、ABCC2、AKNA、ETS1、CCR7和TXNRD1基因上.此外,我们从5年生存曲线中发现,在低缺氧-强免疫状态组中高表达的PEBP4、CCR7、FLI1、AKNA、HLA-DMB、MYO1F和低表达的ABCC2基因也可作为预后因子(P<0.05). 结果表明这9个新筛选的生物标记物可以作为肺腺癌免疫治疗的潜在靶点.
肺腺癌; 低氧; 免疫; DNA甲基化; 生存率
Q75A2023.016001
收稿日期: 2022-09-12
基金项目: 四川省卫健委自然科学基金(20PJ169); 成都医学院-成都市郫都区人民医院联合科研基金(2021LHPG-08); 成都医学院-成都市第七人民医院联合科研基金重点项目(2020LHJYZD-02)
作者简介: 熊曙光(1966-), 男, 四川成都人, 主任医师, 研究方向为肺部疾病的临床诊断研究. E-mail: bearguang66@163.com
通讯作者: 彭确昆. E-mail: 289344542@qq.com
Development of a hypoxia-immune-based DNA methylation signature for prognosis in the lung adenocarcinoma
XIONG Shu-Guang1, ZHOU Qing1, XIONG Yan1, GAO Ying-Jie2, QU Xiao-Min2, PENG Que-Kun2
(1.Department of Respiratory and Critical Care Medicine, The Second Affiliated Hospital of Chengdu Medical College, Chengdu 610051, China;
2.School of Bioscience and Technology, Chengdu Medical College, Chengdu 610500, China)
To investigate the role of combined analysis of hypoxia and immunity DNA methylation sites in lung cancer prognosis and improve the effectiveness of immunotherapy for lung cancer, a risk-scoring model for prognostic assessment was constructed based on methylation and transcriptomic two-dimensional data. 247 de-redundant lung cancer samples associated with hypoxic and immune status were downloaded from the TCGA database as the training set. Then, differential gene expression analysis, differential methylation site analysis and clinical survival analysis were performed for samples in low hypoxialow and immunehigh status and samples in hypoxiahigh and immunelow status. Survival curve analysis showed that the 1-, 3-, and 5- year survival rates of lung adenocarcinoma patients in the hypoxialow and immunehigh group were better than those in the hypoxiahigh and immunelow group (log-rank test, P<0.05, P<0.001, P<0.001). The polygenic prognostic model constructed by LASSO regression contained 9 methylation sites which showed good prognostic prediction ability in both test and validation data sets of lung adenocarcinoma (AUC=0.83, 0.80, 0.82). These nine methylation sites were distributed on PEBP4, FLI1, HLA-DMB, MYO1F, ABCC2, AKNA, ETS1, CCR7 and TXNRD1 genes, respectively. In addition, we found from the 5-year survival curve that the high expression of PEBP4, CCR7, FLI1, AKNA, HLA-DMB, MYO1F and low expression of ABCC2 genes in the hypoxialow-immunehigh group can also be used as prognostic factors (P<0.05). The results suggest that these nine newly screened biomarkers can be the potential targets for immunotherapy of lung adenocarcinoma.
Lung adenocarcinoma; Hypoxia; Immune; DNA methylation; Survival rate
1 Introduction
Lung cancer remains the leading cause of cancer-related deaths, with 1 600 000 new cases yearly. The five-year overall survival for lung cancer patients remains at about 17%[1].According to the histological classification of WHO (2004), lung cancer includes two significant types: non-small-cell lung cancer (NSCLC) and small-cell lung cancer (SCLC), and only NSCLC accounts for approximately 85% of lung cancers. Lung adenocarcinoma (LUAD) is the primary histological subtype of NSCLC, which accounts for more than 40% of lung cancer incidence[2].The progression of the LUAD cant be completely retarded by early surgery.In addition, about 50% of LUAD patients have still suffered a relapse and die[3]. Nowadays, the identification of new potential biomarkers has led to a novel strategy, targeted therapy. Therefore, finding new and effective molecular targets and implementing targeted therapy will be an ideal means to improve the survival rate of tumor patients.
Hypoxia is a well-known feature of almost all solid cancers and a characteristic of cold immunity[4].Extreme hypoxia and aberrant hypoxia-inducible factor-1 (HIF-1) activity in TME is a drawback for effective immunotherapy. Highly hypoxic TME also impairs maturation and activity of dendritic cell (DCs) and natural killer (NK) cells[5]. In addition, the hypoxic TME is linked positively with metabolic changes in cells of immune system[6]. These alterations are indicative of a need for hypoxia modulation as a complementary targeting strategy to go with immune checkpoint inhibitor (ICI) therapy.Moreover, increasing evidences have found that the clinical importance of the interaction between hypoxia and immune status in various cancer microenvironment and suggested that the hypoxia-immune-based gene signature represents a promising tool for risk stratification in cancers[7,8]. This tool might serve as a prognostic classifier for clinical decision-making regarding individualized prognostication and treatment.
Epigenetics is an important means to study the biomarkers of lung cancer. DNA methylation plays a pivotal role in regulating cellular processes, and altered DNA methylation pattern is a general hallmark of cancer[9]. In recent years, many potential biomarkers of DNA methylation associated with lung cancer have been found[10]. Given the plasticity of epigenetic markers, any change in DNA methylation that has a causal relationship with lung cancer could be a potential target for intervention[11]. Rosenthal et al. integrated genomic, transcriptomic, epigenomic, and pathologic data to define how tumors are sculpted by the immune microenvironment and found that tumor evolution was shaped through different immunoediting mechanisms, either affecting antigen presentation or neoantigen mutations themselves at both the DNA and RNA-level. It also suggests that changes in the tumor immune system may be linked to changes in DNA methylation from chromosomes[12]. Moreover, DAnna et al found DNA demethylation upregulates cryptic transcript expression in a HIF-dependent manner, causing immune activation and reducing tumor growth[13]. These results indicate that exploring the critical epigenetic targets of the HIF-immune regulatory axis can broaden our understanding of the mechanisms of tumor growth and metastasis and provide an important perspective for seeking better targeted therapies.
In this study, we sought to develop and validate a prognostic molecular classifier based on immune response and hypoxia status. we obtained 247 hypoxia-immune-related non-redundant samples from TCGA, which both have 450 K methylation array data and transcriptomic profiles, as a training set. We developed a novel DNA methylation signature by incorporating immune and hypoxia status to improve the prognostication of LUAD patients and speculated that the interaction of hypoxia with the immune could provide prognostic information for risk stratification of LUAD patients.
2 Methods
2.1 Patient cohort and data preparation
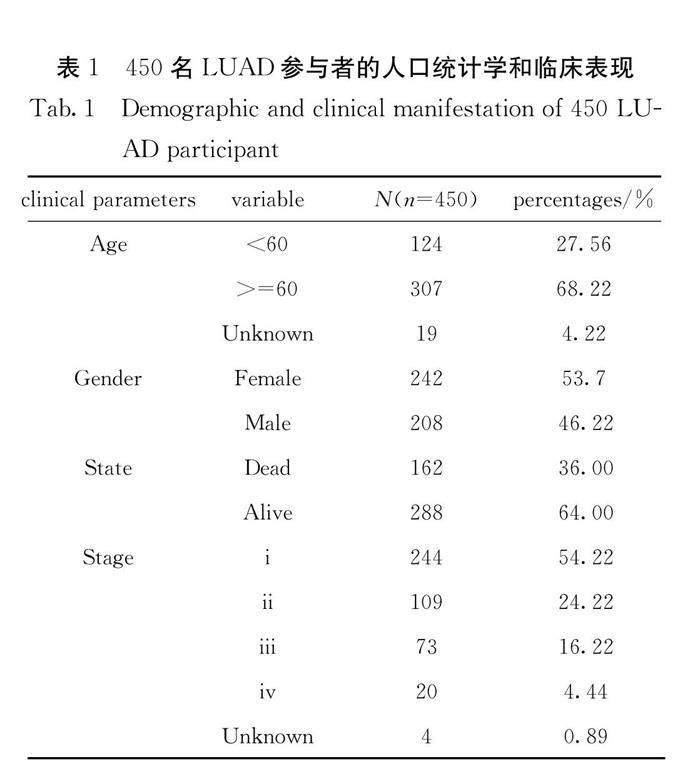
We downloaded 450 K methylation microarray and mRNA expression data of LUAD patients from the TCGA database. Only 450 non-redundant samples (Tab.1), all of which have 450 K methylation microarray and transcriptome data, were selected to identify hypoxia and immune status. Besides, the whole TCGA cohort, including 458 non-redundant samples, GSE83842 (n=12) with survival data and GSE39279 (n=155) with clinical stage data downloaded from the GEO database (GEO is available at: https://www.ncbi.nlm.nih.gov/geo/) were used to verify the classifier with nine novel DNA methylation biomarkers.
2.2 Identification of hypoxia status and hypoxia-related DEGs
To identify the hypoxia status, we firstly collected the largest hypoxia-related gene set, including 200 genes, from Molecular Signatures Database (MSigDB version 6.0). By combining the hypoxia-related gene expression and the clinical data of the 450 LUAD samples in TCGA, a combination of T-distributed Stochastic Neighbor Embedding (t-SNE)[14], and survival analysis based on the survival R package[15] to stratify patients into two distinct clusters. The high hypoxia group, which had lower five-year overall survival, and the low hypoxia group were identified to estimate the hypoxia status. Further, the DESeq2 algorithm was used to identify differentially expressed genes (DEGs) between the two groups[16]. The genes with a P-value < 0.05 and an absolute value of log2 (fold change)>1 was considered to be hypoxia-related DEGs. Besides, we calculated the Pearson correlation coefficient between 200 hypoxia-related genes and the others,then picked out the genes (correlation coefficient >0.6)as coordinate expression genes (CEGs). We used KEGG enrichment analysis to study DEGs and CEGs function by clusterProfiler package and pathview package to map our hypoxia-related DEGs on the HIF-1 signaling pathway. Besides, the expression of hypoxia-related genes was screened by Students t-test between the two groups.
2.3 Identification of immune status and immune-related DEGs
ESTIMATE can take advantage of the transcriptomic profiles of tumor tissues to deduce the proportion of infiltrating stromal and immune cells[17]. In this study, we conducted this method to infer the infiltration of immune cells for each LUAD sample to predict the immune status. Maxstat, an R package on maximally selected rank statistics, was employed to identify the optimal cutoff for stratifying samples. Finally, the LUAD samples were classified into two groups by Maxstat based on the calculated immune scores by ESTIMATE. The patients with records over the cutoff were classified into the immune high group, and those with lower immune scores were considered low immune status. The survival analysis was performed to analyze the effect of immune status on the prognosis. DEGs between the immune high and immune low groups were identified by the DESeq2 method. The genes with a P-value<0.05 and an absolute value of log2 (fold change)>1 was considered to be immune-related DEGs. We used the KEGG and GO enrichment analysis to study DEGs function by clusterProfiler package and topGO package.
2.4 Identification of hypoxia-immune-related prognostic DEGs
We combined the hypoxia and immune status into a two-dimension index, whereby the LUAD patients were divided into three groups, i.e.,hypoxialow-immunehigh (n=124), hypoxiahigh-immunelow (n=123), and mix groups (n=211). A differential expression comparison between the hypoxialow-immunehigh and hypoxiahigh-immunelow groups was applied to classify the hypoxia-immune-related DEGs by P-value<0.05 and an absolute value of log2 (fold change)>1. We used STRING database to construct the protein-protein interaction (PPI) network and plug-in Molecular Complex Detection (MCODE) to screen hub modules in Cytoscape. Furthermore, we used the Venn diagram to overlap the gene in hypoxia-related DEGs and immune-related DEGs.
2.5 Identification of hypoxia-immune-related prognostic DMPs
The CHAMP software, including quality control, normalization,and identification of differentially methylated positions and regions[18], was used to explore the differentially methylated sites (DMPs) between the hypoxialow-immunehigh and hypoxiahigh-immunelow group (FDR-adjusted P<0.05) and then the genomic features of DMPs were counted. The hypermethylation positions with lower gene expression and hypomethylation with higher gene expression were selected as candidate markers. The global distribution of candidate markers in chromosome was plotted by circos. The Fishers exact test based on the scipy.stats Python package.
2.6 Derivation of hypoxia-immune-based DNA methylation signature and prognosis classifier
In statistics and machine learning, the LASSO is a regression analysis method that preserves both variable selection and regularization and avoids overfitting with high dimensional predictors[19].The LASSO Cox regression model was applied to screen out the most prognostic methylation signatures from the identified hypoxia-immune-related prognostic DMPs in the discovery cohort. One thousand iterations and 247-fold cross-validation were used to improve the potential ability of the results. The optimal tuning parameter λ was identified via the 1-SE (standard error) criterion. The prognostic DNA methylation signatures were obtained by the classifier based on the individual-level risk scores. The risk score of LUAD patients was a sum of the methylation level of the prognostic signatures and the corresponding coefficients derived from the LASSO model, i.e., risk score=∑ (coefficient × methylation level of a signature). A Receiver Operating characteristic Curve (ROC) was plotted to confirm the models prognostic ability and identify an optimal risk score cutoff and multivariate Cox regression analysis was further performed to estimate the risk factors for survival of covariates, combined with 5-year survival rate. Forest plot for Cox proportional hazards model by ggforest R package. The validation is also carried out in the whole 458 non-redundant samples and validation set.
3 Results
3.1 Hypoxia status and hypoxia-related DEGs in LUAD
A small proportion of 450 K methylation microarray and gene expression data downloaded from the TCGA database come from different organizations of the same LUAD patients, and then we only retain the best quality data. Finally, 450
Fig.1 Identification of hypoxia status and the function of hypoxia-related DEGs
(a) Dot plot for clusters identified by t-SNE; (b) plot of 3-, 5-years survival for patients in two clusters, Log-rank test was used to calculated P-values; (c) the function of differently expressed genes grouping based on hypoxia status annotated by enrichment in KEGG database; (d) the function of genes high correlation (Pearson correlation coefficient > 0.6) to 200 hypoxia-related genes annotated by enrichment in KEGG database; (e) gene expression of the 200 hypoxia-related genes for LAUD patients in two clusters, T test was used to calculated P-values; (f) different color marks on DEGs in HIF-1 signaling pathway. Red marks on higher expressed genes, blue marks on lower expressed genes in hypoxiahigh group and green marks mean no significance
samples were obtained (Tab.1). We used the gene expression level of 200 hypoxia-related genes in the HIF pathway, calculated by fragments per kilobase per million mapped reads (fpkm), to cluster after dimensionality reduction for stratifying patients. The whole set was divided into two clusters, 175 samples and 275 samples, respectively (Fig.1a). The 3, 5-year survival analysis showed a significant difference between the two clusters (log-rank test, P = 0.011, 0.002) (Fig.1b). The cluster with a longer survival time was classified to the hypoxialow group, and differential expression gene analysis showed that 1177 genes were lower expressed and 1720 genes were higher expressed in this group than in the hypoxiahigh group. According to the result of KEGG enrichment analysis, the TOP10 of significant enrichment pathways was extracted (Fig.1c). Most DEGs were enriched in the pathways related to metabolism, as well as Neuroactive ligand-receptor interaction, chemical carcinogenesis, drug metabolism and complement and coagulation cascades.
The pathway of Neuroactive ligand-receptor interaction is related to Immune-infiltration of the tumor microenvironment positively in Lower-grade glioma[20]. In addition, it has been reported that chemical carcinogens can induce changes in the tumor microenvironment through oxidative stress, leading to metastasis of tumor cells[21]. The pathway of complement and coagulation cascades is an important component of the primary and innate immunity against invasive pathogens. We also found B cell receptor signaling pathway, NF-kappa B signaling pathway, leukocyte transendothelial migration and T cell receptor signaling pathway listed on the CEGs KEGG enrichment results (Fig.1d). These pathways play an important role in the immune changes of tumor cells and are often important targets of immunotherapy[22]. However, the inner links between hypoxia and immune tumor microenvironment in LUAD are still unclear. At the same time, the differential expression of 200 hypoxia-related genes was tested by a Students t-test between these two clusters. 122 genes were found to be significantly differentially expressed, most of them had extremely significant differences (P<0.01) (Fig.1e). We made different color marks on important closely related genes in KEGG map, red marks on higher expressed genes and blue marks on lower expressed genes in hypoxialow group, green marks mean no significance (Fig.1f). T-test analysis results showed that HIF 1α (t=-3.229, P= 0.0009) and metastasis-associated genes GLFP (placental growth factor), ANGPT2 (Angiopoietin-2) (t= -2.094, P= 0.0078), DVL3(Dishevelled-3) (t= -3.858, P= 0.000 01) significantly upregulated in the hypoxiahigh group.
3.2 Immune status and immune-related DEGs in LUAD
450 tumor samples were scored by ESTIMATE,the Stromal Score and the immune score records range from -1786 to 2009, -2364 to 4902, respectively (Fig.2a). We only choose the immune score and survival data to group the 450 samples into two groups, 176 samples and 274 samples (Fig.2b). The analyses of maxstat demonstrated that the difference in 1-, 3-, 5- year survival between the two groups was the most significant when the immune score threshold was 1714.715 (log-rank test, P=0.006, 0.002, 0.00053) (Fig.2c). They are named high immune and low immune groups. The different expression gene analysis showed that 1715 genes were upregulated and 1379 genes were downregulated in the immune high group than in the low immune group. These differentially expressed genes were significantly enriched in 76 GO terms, mainly immune-related terms (Fig.2d). 48 KEGG pathways were enriched, except functions directly related to immune, NF-kappa B (NF-κB) signaling pathway, JAK-STAT signaling pathway, Cell adhesion molecules pathway, and Chemokine signaling pathway were significantly enriched (Fig.2e). As described previously, the immune response could be decomposed into single signal transduction events. The gene products of early events in immune response include cytokines and other soluble factors, which can reproduce and explain the initial immune recognition events, such as NF-κB mediates the critical changes of innate and adaptive immune responses[23], Cytokine
Fig.2 Identification of immune status and the function of immune-related DEGs
(a) Scatter plot for two distinct groups identified by ESTIMATE method, plot Immune score on the vertical y-axis against Stromal score on the horizontal x-axis; (b) bar plot for two distinct groups identified by ESTIMATE method; (c) the function of differently expressed genes grouping based on immune status annotated by enrichment in GO database by topGO; (d) plot of 1-, 3-, 5-year survival for LUAD patients in two groups, Log-rank test was used to calculated P-values; (e) the function of immune-related DEGs annotated by enrichment in KEGG database
signaling is modulated by crosstalk between the JAK-STAT pathway and pathways triggered by other central immune receptors,such as receptors for inflammatory cytokines[24]. In addition, the core of all anti-tumor reactions is the ability of immune cells to migrate to tumor sites and interact with malignant cells. The cell adhesion molecules, including immunoglobulin superfamily receptors and integrins, play essential roles in mediating these processes[25].
3.3 Hypoxia-immune-related DEGs in LUAD
We further combined the above hypoxia and immune status into a two-dimension index, and then the LUAD patients were divided into three groups:hypoxialow-immunehighgroup, hypoxiahigh-immunelow group, and mix group. The 1-, 3-, 5-year survival analysis showed the LUAD patients in hypoxialow-immunehigh group had a higher survival than those in the hypoxiahigh-immunelow group (log-rank test, P=0.019, P<0.001, P<0.001) (Fig.3a). T-test analysis results showed that HIF 1α, and metastasis-associated genes DVL3(Dishevelled-3) (t=-3.858, P=0.000 01), and ANGPT2(t=-2.412, P= 0.000 01) overexpressed in the hypoxiahigh-immunelow group. The comparison of expression profiles between the hypoxialow-immunehigh and hypoxiahigh-immunelow groups further exhibited that 3057 genes overexpressed in hypoxiahigh-immunelow groups where patients had a worse outcome, and 3486 overexpressed in hypoxialow-immunehigh group where patients yielded better survival (Fig.3b). RET and ROS1 appeared in the differentially expressed hypoxia-immune related gene list, which were identified as the "driver gene" in LUAD. The RET differential expression in gene-level has been discovered in 50%~60% of pancreatic ductal adenocarcinomas and 30%~70% of invasive breast cancers in addition to small cell lung cancer, associated with tumor proliferation, invasion, and migration[26]. The ROS1 gene is a member of the seven subfamily of tyrosine kinase insulin receptor genes. The previous study demonstrated that there is a ROS1 fusion in 2.54% of the patients with lung adenocarcinoma[27]. In this study, we found that RET upregulated and ROS1 downregulated in hypoxiahigh-immunelow group. Further exploration on the mechanism of these two oncogenes for hypoxia-immunity tumor microenvironment should be carried on. Also, the enrichment profile mainly focused on immune-related pathways when hypoxia is combined with immune status. As expected, the JAK-STAT signaling pathway, retinol metabolism, Calcium signaling pathway, Cell adhesion molecules, NF-κB signaling pathway, and Chemokine signaling pathway were enriched. More importantly, the PI3K-Akt signaling pathway, Ras signaling pathway occurred. The protein-protein interaction (PPI) network of the DEGs was constructed and then 5 main modules were carried by the module analysis of the network using MCODE in Cytoscape (Fig.3c). The hub gene set in the top1 module contains HLA genes and lymphocyte specific proteins, such as LCK, CD247, CD3G, ZAP70, LAT, CD4, ITK, LCP2, CD8A, HLA-DPB1, HLA-DPA1, HLA-E, HLA-DQB2, HLA-B, HLA-F, HLA-DOB, HLA-DOA, HLA-DMB, HLA-DMA, CD86. In addition, the differential analysis of immunehigh group versus immunelow group, and hypoxia high group versus hypoxia low group showed that genes which upregulated in the immunehigh group and genes which upregulated in the hypoxia low group a had strong overlap in Venn diagram (Fig.3d). These results further indicated that there was a strong correlation between hypoxia and immune.
3.4 Hypoxia-immune-related DMPs in LUAD
The differential methylated site analysis by CHAMP software betweenhypoxialow-immunehigh and hypoxiahigh-immunelow groups showed a total of 200 000 sites were significantly differentially methylated. Among them, about 180 000 were hypomethylation site; 22454 were hypermethylation site; both were focused on gene body region (49.22%, 34.99% distributed in gene body region) in Fig.4a. Then, by combining hypoxia-immune-related DEGs with hypoxia-immune-related annotated DMPs, 10 741 candidate DMPs which
Fig.3 Identification of hypoxia-immune status and the function of hypoxia-immune-related DEGs
(a) Plot of 1-, 3-, 5- year survival for LUAD patients in two groups (hypoxialow-immunehigh and hypoxiahigh-immunelow), Log-rank test was used to calculated P-values; (b) volcano plots DEGs for LAUD patients; (c) differentially expressed hub modules identified by MCODE; (d) shared gene in hypoxia-related DEGs and immune-related DEGs
Fig.4 The features of hypoxia-immune-related DMPs
(a) The genomic features of DMPs; (b) the global distribution of candidate markers methylation level and gene expression in chromosome; (c) the clustering gene expression of candidate markers; (d) the tumor stage in hypoxia-immune groups
Fig.5 Hypoxialow-immunehigh -based DNA methylation signature and prognosis classifier
(a) LASSO coefficient profiles of the hypoxialow-immunehigh DNA methylation signature; (b) 247-fold cross-validation for tuning parameter selection in the LASSO model; (c) area under the curve (AUC) of receiver operating characteristic (ROC) curves used to assess the sensitivity and specificity of the prognostic model; (d) the methylation level of the nine loci, P value was calculated by CHAMP; (e) multivariate Cox regression analysis of the nine methylation loci based on methylation level; (f) multivariate Cox regression analysis of age, gender, stage, riskscore, box plot of age, gender, stage for patients in two groups, T-test was used to calculated P-values
contain 1685 genes were identified, in which the hyper-methylation position was correlated with lower gene expression and hypo-methylation position was correlated with high gene expression in the hypoxialow-immunehigh group than the hypoxiahigh-immunelow group. The candidate markers contain 8870 hypomethylation sites, 1871 hypermethylation sites and 1131 positive correlated hypoxialow-immunehigh status genes, 553 negative correlated hypoxialow-immunehigh status genes. The distribution of them on chromosomes were listed in Fig.4b. Based on methylation level of these 10 741 hypoxia-immune-related DMPs and clinical information of patients, a prognostic molecular classifier was trained. As shown in Fig.4c, heatmap analysis showed there is no significant correlation between hypoxia-immune-related DMPs and age. The same results were also found in the analysis of gender factor. Moreover, we found that 89.5% of patients were in tumor stage Ⅰ and Ⅱ in the hypoxialow-immunehigh group and 10.5% in the stage Ⅲ and Ⅳ(Fig.4d). This percentage of patients in tumor stage Ⅲ and Ⅳ in the hypoxiahigh-immunelow group increased to 24.2%. These results indicated that tumor status was significantly associated with hypoxia-immune-related DMPs by the Fishers exact test (P=0.0069).
Fig.6 The prognostic ability of hypoxialow-immunehigh -based DNA methylation related genes
(a) The gene expression of the nine methylated genes, P value was calculated by DESeq2; (b) survival curves divided LUAD patients into high-risk (n=123) and low-risk groups (n=124) using the nine methylated genes in TCGA. A log-rank test was used to calculated P-values; (c) multivariate Cox regression analysis of the nine loci based on gene expression
Fig.7 Prognosis of Methylated loci was validated in the whole TCGA dataset and GSE83842 dataset
(a) Hypoxialow-immunehigh -based DNA methylation signature was validated in the whole TCGA, which was also used to divide LUAD patients into high-risk and low-risk; (b) area under the curve (AUC) of receiver operating characteristic (ROC) curves used to verify the sensitivity and specificity of the prognostic model in the GSE83842 and GSE39279 dataset
3.5 Hypoxia-immune-based DNA methylation signature and prognosis classifier in LUAD
Finally,a useful prognostic DNA methylation signature was developed by optimizing the training dataset with the LASSO Cox regression model, which provided a most effective method to classify patients into high-and low-risk groups (Fig.5a, 5b). Nine DMPs were screened out as biomarkers, which were cg01211283,cg03356689,cg07623567,cg11667738,cg13617376,cg14080475,cg15647029,cg23663547, cg25068347, and their corresponding coefficients were identified. The cg01211283 is in PEBP4 gene body region; cg03356689 is in FLI1 gene body; cg07623567 is in HLA-DMB TSS; cg11667738 is in MYO1F TSS; cg13617376 is in ABCC2 gene body region; cg14080475 is in AKNA 5-UTR region; cg15647029 is in TXNRD1 gene body region; cg23663547 is in CCR7 3-UTR region; cg25068347 is in ETS1 gene body region. The risk curve is risk score = 0.058 313 389×cg01211283 + 0.220 319 421×cg03356689 + 0.009 679 187×cg07623567 + 1.139 207 843 × cg11667738-0.542 515 942×cg13617376 + 0.887 109 907×cg14080475-0.016 006 588×cg15647029 + 0.150 391 932×cg23663547 + 0.100 425 283×cg25068347. The best risk score threshold of the classification is 0.1454, calculated by ROC, and the AUC area is 0.83 (Fig.5c). The methylation level of nine sites in the different risk groups were described in Fig.5d. Multivariate regression analysis also showed these nine loci perform well (global P-value <0.001) in predicting the prognosis of LUAD patients based on methylation beta value; two of them (cg11667738 and cg14080475) were demonstrated to be an independent prognostic factor (Fig.5e). In addition, we evaluated the ability of clinical phenotypes such as age, gender, stage to prognosticate for these patients. The multivariate cox regression analysis result showed that age and gender were not able to act as an effective prognosis factor alone (P>0.001) in the diverse and complex tumor microenvironment (Fig.5f). But these genes can greatly improve the prediction ability based on tumor stage (P<0.001).
We also explored the predictive prognostic ability of these nine sitesbased on related genes expression independently. The expression of these nine genes between two groups are shown in Fig.6a. Among these nine genes, except for TXNRD1 (P= 0.12) and ETS1 (P= 0.13), the upregulation of PEBP4, CCR7, FLI1, AKNA, HLA-DMB, MYO1F genes and downregulation of ABCC2 are significantly positively associated with five-year overall survival of LUAD patients (P< 0.05) (Fig.6b). The P-value of FLI1, and HLA-DMB in the multivariate regression analysis are all below 0.05, which suggests that these two genes can act as an independent prognostic factor (FLI1, P= 0.007; HLA-DMB, P=0.03) (Fig.6c). The global P value of nine genes in the multivariate regression analysis is below 0.001, which manifested these nine genes can be used as aids in stratification of patients.
3.6 Validation of hypoxia-immune-based prognosis classifier
Another two independent cohorts were selected as validation sets for the prognosis classifier. We look up the lung adenocarcinoma or lung cancer-related data set (450 K methylation chip data, with survival time or tumor stage information) for verification. GSE83842, GSE66836, GSE147377, GSE148000, GSE39279 data sets were downloaded, but only the GSE83842 and GSE39279 could be used to do the subsequent analysis, since the other three datasets had low correlation to TNM staging. The whole 450 K methylation microarray of 458 LUAD patients in TCGA was used to verification again. Based on the risk score threshold of 0.1454, 244 samples fell into the low-risk group and 214 samples into the high-risk group. There was a significant difference in five-year survival curve between the two groups (Fig.7a). The ROC curves were drawn, the AUC of GSE83842 was 0.80, the AUC of GSE39279 was 0.82(Fig.7b).
4 Discussion
In this study, our results hint at an inverse association between the effects of hypoxia and immune on the prognosis of LUAD patients. Higher hypoxia status was associated with worse prognosis while higher immune status could indicate better outcomes. Moreover, our combined analysis of hypoxia and immune gene expression in NSCLC suggests that hypoxia may be an important factor in distinguishing hot (inflamed) and cold (immune desert or excluded) tumors and differential treatment approaches might be required for patient subgroups. Although hypoxic modification (nimorazole) and immune checkpoint therapies (PD-1/PD-L1 inhibitors) have shown single-agent activity in head and neck cancer, the response rate is relatively low. Brooks et al. found that combinations or sequential use of hypoxia-modifying and/or immunomodulatory drugs may be beneficial. For example, in the group of patients with a hypoxiahigh-immunelow or mixed signature correlating with poor prognosis, treatment with hypoxia modifiers may sensitize to chemo/radiotherapy, and EGFR inhibitors or agents targeting MDSCs/TAMs may reverse the immunosuppressive environment[28]. Therefore, the same therapeutic strategy can be adopted in the immunotherapy of NSCLC.
Since the hypoxia and immune tumor microenvironment is complicated and sometimes traditional clinicopathological risk factors could no longer really classify patients. So, we develop and validate a practical and reliable classifier based on genome-wide DNA methylation profiling association with the transcriptome of hypoxia and immune tumor microenvironment in prognostication and stratification for patients with LUAD. The novel hypoxia-immune-based DNA methylation signatures integrate nine methylation loci had a promising performance not only in the discovery data set but also in two validation data set. More specifically, we also found that these signatures can greatly improve the prediction ability when combined with clinical phenotypes.
The nine DNA methylation loci corresponded to the nine genes: PEBP4, FLI1, HLA-DMB, MYO1F, ABCC2, AKNA, ETS1, CCR7, and TXNRD1. These biomarker genes, except for TXNRD1 and ETS1, were all significantly associated with LAUD prognosis in the Log-rank univariate analysis using the discovery cohort. The genes FLI1, and HLA-DMB can be act as an independent prognostic factor. Among these nine genes, the abnormal expression of FLI-1, ABCC2, ETS1, CCR7 and TXNRD1 genes has been proved to be closely related to the metastasis, invasion, chemoresistance and tumor immune microenvironment of NSCLC[29-33].However, no studies have shown that HLA-DMB, MYO1F and AKNA are closely associated with the occurrence of NSCLC. Recent studies have found that HLA-DMB is related to ATG7, one of the core autophagy proteins required for typical autophagy, and thus inhibits the autophagy process by increasing the acetylation of ATG7 in HTLV-1-transformed T-cell lines[34]. MYO1F may play an essential role in IFN-γ/PD-L1 signaling in primary melanoma. MYO1F is associated with the T cell co-inhibitory receptor, PD-L1. The MYO1Fhigh M1-macrophages cells expressed PD-L1 and MYO1Fhigh CD8+ T cells showed high IFN-γ expression[35]. These results were consistent with the results in this study that overexpression of MOYO1F could be favorable factors for patients outcomes. Wang et al found that AKNA was involved in the regulation of epithelial-mesenchymal transition (EMT)-related pathways including chemokine signaling pathway, cytokine to cytokine receptor interaction and cell adhesion molecules in gastric cancer, suggesting that AKNA could serve as a potential biomarker and an effective target for gastric cancer diagnosis and therapy[36]. Thus, we hypothesized that these three genes HLA-DMB, MYO1F and AKNA, may regulate the immune microenvironment of lung cancer cells through similar mechanisms. However, this hypothesis needs to be confirmed by further large-scale clinical cohort studies.
5 Conclusions
Herein, by analyzing the correlation between the changes in epigenetic factors based on hypoxia-immune axis and LUAD patients survival, we explored a new perspective of tumor therapy that we can alter the state of DNA methylation to affect the tumor microenvironment. It may represent a promising tool to prognosis in LUAD and be also used to classify prognosis for clinical decision-making on individualized prognostication, treatment, and follow-up schedule.
Abbreviations
TCGA, The Cancer Genome Atlas database; GEO, gene expression omnibus; LASSO, Least Absolute Shrinkage and Selection Operator;LUAD, lung adenocarcinoma; NSCLC, non-small-cell lung cancer, SCLC, small cell lung cancer; DNMTi, DNA methyltransferase inhibitors; TME, tumor microenvironment; HIF-1α, Hypoxia-inducible factor-1α; DMPs, differentially methylated sites; DEGs, differentially expressed genes; ROC, receiver operating characteristic curve; AUC, area under the curve; PEBP4, phosphatidylethanolamine binding protein 4; FLI1, Friend leukemia integration-1; HLA-DMB, the beta chain of the non-classical MHC-Ⅱ protein HLA-DM; MYO1, myosin 1; ABCC2, ATP-binding cassette transporters2; AKNA, AT-hook transcription factor; ETS1, epithelialspecific transcription factor 1, CCR7, C-C chemokine receptor type 7; TXNRD1, thioredoxin reductase 1; EGFR, epidermal growth factor receptor; PD1,programmed cell death protein-1; PD-L1, programmed cell death protein-ligand 1; MDSCs, meyloid-derived suppressor cells; TAMs, tumor-associated macrophages.
Acknowledgments
We thank Mrs. Jinhuan Li and Dr. Tong Peng for her constructive comments on our experiment design and Dr. Shijie Ni for revising the language of our manuscript.
References:
[1] Nooreldeen R, Bach H. Current and future development in lung cancer diagnosis [J]. Int J Mol Sci, 2021, 22: 8661.
[2] Zheng M. Classification and pathology of lung cancer [J]. Surg Oncol Clin N Am, 2016, 25: 447.
[3] Hirsch F R, Scagliotti G V, Mulshine J L. Lung cancer: current therapies and new targeted treatments [J]. Lancet, 2017, 389: 299.
[4] Mortezaee K, Majidpoor J. The impact of hypoxia on immune state in cancer [J]. Life Sci, 2021, 286: 120057.
[5] Lee H S, Leem G, Kang H, et al. Peripheral natural killer cell activity is associated with poor clinical outcomes in pancreatic ductal adenocarcinoma [J]. J Gastroenterol Hepatol, 2021, 36: 516.
[6] Liu G, Bi Y, Shen B, et al. SIRT1 limits the function and fate of myeloid-derived suppressor cells in tumors by orchestrating HIF-1α-dependent glycolysis [J]. Cancer Res, 2014, 74: 727.
[7] Liu Y, Wu J, Huang W, et al. Development and validation of a hypoxia-immune-based microenvironment gene signature for risk stratification in gastric cancer [J]. J Transl Med, 2020, 18: 201.
[8] Sun X, Zhou Z, Zhang Y, et al. Identification and validation of a hypoxia-related prognostic and immune microenvironment signature in bladder cancer [J]. Cancer Cell Int, 2021, 21: 251.
[9] Tang B. DMAK: a curated pan-cancer DNA methylation annotation knowledgebase [J]. Bioengineered, 2017, 8: 182.
[10] Zhao L, Wu X, Zheng J, et al. DNA methylome profiling of circulating tumor cells in lung cancer at single base-pair resolution [J]. Oncogene, 2021, 40: 1884.
[11] Liang W, Zhao Y, Huang W, et al. Non-invasive diagnosis of early-stage lung cancer using high-throughput targeted DNA methylation sequencing of circulating tumor DNA (ctDNA) [J]. Theranostics, 2019, 9: 2056.
[12] Rosenthal R, Cadieux E L, Salgado R, et al. Neoantigen-directed immune escape in lung cancer evolution [J]. Nature, 2019, 567: 479.
[13] D'Anna F, Van Dyck L, Xiong J, et al. DNA methylation repels binding of hypoxia-inducible transcription factors to maintain tumor immunotolerance [J]. Genome Biol, 2020, 21: 182.
[14] Pérezgonzález A, Vergara M, Sanchobru J L, et al. Visualizing data using t-SNE [J]. J Mach Learn Res, 2015, 9: 2579.
[15] Hyungjun C, Yu A, Sukwoo K, et al. Robust likelihood-based survival modeling with microarray data [J]. J Stat Softw, 2008, 29: 1.
[16] Love M I, Huber W, Anders S. Moderated estimation of fold change and dispersion for RNA-seq data with DESeq2 [J]. Genome Biol, 2014, 15: 550.
[17] Yoshihara K, Shahmoradgoli M, Martínez E, et al. Inferring tumour purity and stromal and immune cell admixture from expression data [J]. Nat Commun, 2013, 4: 2612.
[18] Tian Y, Morris T J, Webster A P, et al. ChAMP: updated methylation analysis pipeline for Illumina BeadChips [J]. Bioinformatics, 2017, 33: 3982.
[19] Tibshirani R. The lasso method for variable selection in the Cox model [J]. Stat Med, 1997, 16: 385.
[20] Chen J, Wang Z, Wang W, et al. SYT16 is a prognostic biomarker and correlated with immune infiltrates in glioma: a study based on TCGA data [J]. Int Immunopharmacol, 2020, 84: 106490.
[21] Huang H W, Lee C H, Yu H S. Arsenic-induced carcinogenesis and immune dysregulation [J]. Int J Environ Res Public Health, 2019, 16: 2746.
[22] Gajewski T F, Schreiber H, Fu Y X. Innate and adaptive immune cells in the tumor microenvironment [J]. Nat Immunol, 2013, 14: 1014.
[23] Hayden M S, West A P, Ghosh S. NF-кB and the immune response [J]. Oncogene, 2006, 25: 6758.
[24] Ivashkiv L B. Jak-STAT signaling pathways in cells of the immune system [J]. Rev Immunogenet, 2000, 2: 220.
[25] Harjunp H, Llort Asens M, Guenther C, et al. Cell adhesion molecules and their roles and regulation in the immune and tumor microenvironment [J]. Front Immunol, 2019, 10: 1078.
[26] Li A Y, McCusker M G, Russo A, et al. RET fusions in solid tumors [J]. Cancer Treat Rev, 2019, 81: 101911.
[27] Uguen A, De Braekeleer M. ROS1 fusions in cancer: a review [J]. Future Oncol, 2016, 12: 1911.
[28] Brooks J M, Menezes A N, Ibrahim M, et al. Development and validation of a combined hypoxia and immune prognostic classifier for head and neck cancer [J]. Clin Cancer Res, 2019, 25: 5315.
[29] Lin S F, Wu C C, Chai C Y. Increased FLI-1 expression is associated with poor prognosis in non-small cell lung cancers [J]. Appl Immunohistochem Mol Morphol, 2016, 24: 556.
[30] Wang H, Chi C H, Zhang Y, et al. Effects of histone deacetylase inhibitors on ATP-binding cassette transporters in lung cancer A549 and colorectal cancer HCT116 cells [J]. Oncol Lett, 2019, 18: 63.
[31] Lou Z, Lee B S, Ha T, et al. ETS-1 suppresses the growth, invasion and migration of human NSCLC cells and tumor formation in vivo [J]. Oncol Rep, 2018, 40: 1734.
[32] Zhang S, Wang H, Xu Z, et al. Lymphatic metastasis of NSCLC involves chemotaxis effects of lymphatic endothelial cells through the CCR7-CCL21 axis modulated by TNF-α [J]. Genes (Basel), 2020, 11: 1309.
[33] Delgobo M, Gonalves R M, Delazeri M A, et al. Thioredoxin reductase-1 levels are associated with NRF2 pathway activation and tumor recurrence in non-small cell lung cancer [J]. Free Radic Biol Med, 2021, 177: 58.
[34] Wang J, Song D, Liu Y, et al. HLA-DMB restricts human T-cell leukemia virus type-1 (HTLV-1) protein expression via regulation of ATG7 acetylation [J]. Sci Rep, 2017, 7: 14416.
[35] Song W M, Agrawal P, Von Itter R, et al. Network models of primary melanoma microenvironments identify key melanoma regulators underlying prognosis [J]. Nat Commun, 2021, 12: 1214.
[36] Wang G, Sun D, Li W, et al. AKNA is a potential prognostic biomarker in gastric cancer and function as a tumor suppressor by modulating EMT-related pathways [J]. Biomed Res Int, 2020, 2020: 6726759.
猜你喜欢
中国生殖健康(2020年7期)2020-12-10 07:48:51
中成药(2018年7期)2018-08-04 06:04:18
海南医学(2016年8期)2016-06-08 05:43:00
西南军医(2016年3期)2016-01-23 02:17:47
中国当代医药(2015年17期)2015-03-01 02:03:36
现代检验医学杂志(2015年2期)2015-02-06 02:00:48
沈阳医学院学报(2014年4期)2014-12-27 13:44:30
西南军医(2014年5期)2014-04-25 07:42:32
遗传(2014年3期)2014-02-28 20:58:49
中国海洋大学学报(自然科学版)(2014年12期)2014-02-28 12:22:07
