Sodium dodecyl sulfate (SDS) as an effective corrosion inhibitor for Mg-8Li-3Al alloy in aqueous NaCl: A combined experimental and theoretical investigation
Honggun Song ,Zhidong Xu ,Lhouri Benou ,Zheng Yin ,Hongyu Gun ,Hong Yn ,Luo Cho,Zhi Hu,∗,Xudong Wng,∗
a Department of Mechanical and Electrical Engineering,Nanchang University,Nanchang,330031,China
b Université Paris-Saclay,UVSQ,LISV,78124,Vélizy -Villacoublay,France
c Institute for Advanced Study,Nanchang University,Nanchang,330031,China
Abstract The corrosion inhibition behavior of Mg-8Li-3Al alloy in NaCl solution with sodium dodecyl sulfate (SDS) was investigated by hydrogen analysis,scanning electron microscopy (SEM),electrochemical test,scanning Kelvin probe force microscopy (SKPFM) and computational methods.Results showed that the corrosion resistance of Mg-8Li-3Al alloy in NaCl solution was effectively improved with SDS.The SEM and SKPFM results confirme a dense,200 nm-thick SDS-adsorbed layer had formed on the alloy surface.The separation energy ΔEgap and adsorption energy Eads of SDS on the Mg surface were calculated by density functional theory and molecular dynamics simulations,respectively.And the corrosion inhibition mechanism was hypothesized and described.
Keywords: Mg-Li alloy;Corrosion;Sodium dodecyl sulfate;Scanning kelvin probe force microscopy;Density functional theory;Molecular dynamics.
1.Introduction
Mg-Li alloy is one of the lightest structural metal alloys and has a wide range of application prospects in light industrial applications,aerospace,and the automotive industries[1–6];however,the widespread use of Mg-Li alloys is still limited due to their relatively high corrosion rates[7,8].Many coating technologies have been developed to improve the corrosion resistance of traditional Mg-Li alloys,including corrosion inhibitors,physical vapor deposition,conversion coating,anodizing,plasma electrolytic oxidation,and electroplating[9–15].Among them,corrosion inhibitors are usually used to improve corrosion resistance due to their environmental friendliness and low costs.
Corrosion inhibitors have shown adsorption ability on the surface of Mg alloys,leading to improved corrosion resistance of the alloys [16–17].Hu et al.[18] synthesized an environmentally-friendly tetraphenylporphyrin and studied its inhibition effect on AZ91D magnesium alloys in 0.05 wt.% NaCl solution.They claimed that the inhibition corrosion efficien y of tetraphenylporphyrin reached 90%,because the inhibitor chelated with Mg ions to form a fil able to retard Mg dissolution.Sodium dodecyl sulfate(SDS)was used as an effective corrosion inhibitor for AZ91 Mg alloys in a study by Lu et al.,which found that the generated H2from the alloy immersed in 3.5 wt.% NaCl for 48 h with 0.05 M SDS addition was reduced from 9.1 to 0.3 mL/cm2[19].The corresponding inhibition mechanism of SDS on Mg alloy was shown to occur through chemical adsorption of SDS on AlMn cathodic intermetallics to inhibit micro-galvanic corrosion,which then led kinetically inhibited cathodic hydrogen evolution and anodic dissolution of Mg [20].However,there are only a few reports regarding the characterization of the adsorbed layer of corrosion inhibitors and its influenc on micro-galvanic corrosion of alloys,and the theoretical adsorption of inhibitors.
Theoretical calculations for the adsorption capacity of the inhibitor on the alloy surface have become an important judgment basis for corrosion inhibition evaluation [21,22].The work of Lu et al.[19] fi the Langmuir adsorption isotherm according to the surface coverage of Mg alloy under various concentrations of SDS,and inferred that the standard free adsorption energy of SDS on AZ91 surface is −27.07 kJ/mol.The inhibition effect of methionine and tryptophane on the corrosion of LA141 Mg-Li alloy sheets in 3.5 wt.% NaCl solution was investigated by molecular dynamics (MD) simulation,and the results showed that the binding energy between the Mg (0 0 0 1) surface and methionine molecule is−12.18 kcal/mol,while the binding energy between the Mg(0 0 0 1) surface and tryptophane molecule is −34.37 kcal/mol.The combined effect of the physical and chemical absorption on the LA141 surface was considered as the main reason of the suppressed Mg dissolution [23,24].
SDS with the chemical formula C12H25NaSO4and 0.0082 M critical micelle concentration in pure water at 25 °C,as a kind of anionic surfactant,had been used as an effective corrosion inhibitor for Mg alloys,which consists of a hydrophobic 12-carbon chain and a polar sulfate head group [25].During the process of inhibition for Mg alloy,the polar sulfate head group and hydrophobic 12-carbon chain contacted with the matrix and the solution,respectively.The hydrophobic 12-carbon chain tail,which was perpendicular to the matrix surface,made the water contact angle increased from 73.45°to 118.54°with the increasing of immersion time,thus built up a protective corrosion layer [19].However,the inhibition mechanism of SDS for Mg alloy is not precisely clear.Therefore,in this work,the corrosion inhibition behaviors and mechanism of Mg-8Li-3Al alloy in NaCl aqueous with the addition of SDS were investigated by a combined experimental and molecular simulation approaches (DFT and MD),with specifi focus on the characterization of the SDSadsorbed layer and the elaboration of the corrosion inhibition mechanism of SDS on Mg-8Li-3Al surface.
2.Experimental
Using pure magnesium (99.9 wt.%),pure lithium(99.9 wt.%),and pure aluminum (99.9 wt.%) as raw materials,the as-extruded Mg-8Li-3Al sample was prepared.The mixed alloys were held in a protective argon environment at 740 °C for 600 s for complete dissolution.The melt was then poured into a preheated 200 °C,Φ45×120 mm iron mold.Subsequently,the homogenized samples were held at 250 °C for 1 h.Under an extrusion speed of 2.5 mm/s at 250 °C,the sample was processed into cuboids.The actual composition of the tested sample was 7.89 wt.% Li,2.78 wt.% Al and the balance Mg,which was measured by inductively coupled plasma-atomic emission spectroscopy.
Prior to corrosion testing,all tested alloys were mechanically ground using 600#to 3000#grit SiC paper and 0.5–5 μm Al2O3suspensions.The various concentrations of corrosion inhibitor SDS (0.02–0.06 M,from XiLong Scientifi Co.,Ltd) were mixed into a 3.5 wt.% NaCl solution during the process of immersion testing and electrochemical measurements of the tested alloy.Each tested alloy was soaked in a 3.5 wt.% NaCl solution+(0,0.02,0.04,0.06 M) SDS inhibitor for 1 d The corrosion products on the metal surface are removed by pickling solution.The components of the pickling solution are CrO3and AgNO3(20:1).Five identical samples for each group of experiments were prepared,and the average values were counted.The corrosion rate was evaluated by measuring the hydrogen evolution volume of the specimens,and the inhibition efficien y was calculated using Eq.(1):

The electrochemical measurements of studied alloys were obtained with a volume of 400 mL aqueous solution(3.5 wt.%NaCl+0,0.02,0.04,0.06 M SDS inhibitor) at 25 °C on an electrochemical workstation (Princeton P4000).The electrochemical measurements on the specimens were performed with three electrodes (the working electrode,reference electrode,and counter electrode).Before the electrochemical measurements,all tested alloys were immersed for 600 s in aqueous solution (3.5 wt.% NaCl+0,0.02,0.04,0.06 M SDS inhibitor) to achieve open circuit potential.For the measurement of the polarization curve,the scanning rate and range were 1 mVSCEs−1and ±350 mVSCE,respectively.In the measurement of electrochemical impedance spectroscopy,the frequency ranged from 105Hz to 10−2Hz,and the disturbance amplitude was 5 mV.The impedance spectrum was analyzed and fitte by Zview software.
The surface morphology and composition of the studied alloys were characterized by scanning electron microscopy(SEM,TESCAN VEGA 3)with energy dispersive X ray spectroscopy (EDXS).The Volta potentials maps of the studied alloys were measured by the scanning Kelvin probe force microscope (SKPFM,Agilent 5500) at room temperature.A 20 nm thick silicon tip with a Pt/Ir-coating was operated at 75 kHz mechanical drive frequency and 1 V AC modulation at 10 kHz for simultaneous acquisition of topography and surface potential signal.The surface topographies of the studied alloys were characterized in tapping mode,and then the tip was lifted to 100 nm above the alloy surface to record the potential distribution.
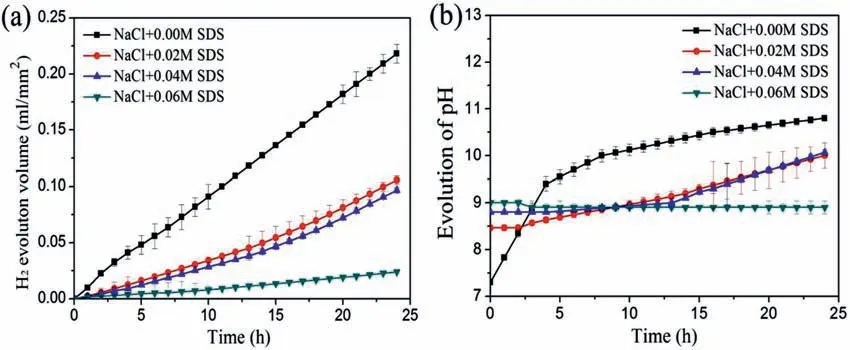
Fig.1.(a) Hydrogen evolution volume,(b) pH change during immersion for 24 h in 3.5 wt.% NaCl solution with and without the addition of SDS.
Furthermore,Material Studio software was used to carry out all calculations.As it is known that SDS has been widely used as anionic surfactant [26,27],the adsorption of the SDS anion,DS–,is concentrated in this part.The DS–was firs generated and optimized under DFT approximation by Dmol3module,using the GGA-BLYP exchange-correlation functional and the COSMO implicit solvent model.The convergence thresholds for energy,maximum force,and maximum atomic displacement were set equal to 1×10⁻⁵Ha,2×10−3Ha−1,and 5×10⁻³,respectively,with a Fermi smearing of 5×10⁻³Ha.The adsorption of DS–on the Mg (0 0 0 1) surface,which is the most frequently discussed surface for adsorption research,was then performed by MD methodology with the Forcite module.Herein,the calculation was carried out in a simulation box (dimension 55.6× 32.1×83.4) with periodic boundary conditions.From the top to the bottom,the box consisted of a vacuum layer with a thickness of 30,a solvent layer (with 1800 H2O and one DS–) and an Mg (0 0 0 1) slab.The uppermost part of water and all Mg atoms were fi ed,while other atoms were released during the calculation.The insertion of the vacuum layer and the fixatio of the upper water were meant to eliminate the associated error due to periodic boundary conditions,ensuring that the upper molecules were not influence by the Mg surface.The CVFF (Consistent Valence Force Field) was adopted,and the whole system was calculated under the Andersen thermostat and a canonical (NVT)ensemble at 298.0 K,with a time step of 1.0 fs.The system was simulated for 60 ps to ensure that both the temperature and energy reach equilibrium.Besides,electrostatic interactions were calculated by the Ewald method and van der Waals interactions were calculated by the atom-based method with a cutoff distance of 15.5.Copyright line should read: ©2020 National Engineering Research Center for Magnesium Alloys of China,Chongqing University.
3.Results
3.1.Hydrogen evolution measurement
Fig.1 shows the H2evolution volume and pH of Mg-8Li-3Al alloys in pure NaCl solution and SDS-containing NaCl solution over 24 h.As shown in Fig.1a,the Mg-8Li-3Al specimen immersed in NaCl solution shows a fast H2evolution rate,but the H2evolution rate of samples significantl decreases when immersed in SDS-containing NaCl solution.Moreover,the higher the content of SDS in the solution,the smaller the volume of released H2,which indicates that the effica y of the corrosion inhibitor is affected by the concentration of the corrosion inhibitor.After the specimen immersion,the pH of the NaCl corrosive medium significantl increased,from 6.7 to 10.9,as depicted in Fig.1b.However,the pH of the NaCl+SDS corrosive medium has a little change with the increasing of immersion time.Specially,the pH value of the NaCl+0.06 M SDS corrosive medium is basically unchanged at about 8.9,which agrees with the previous results of the hydrogen evolution experiment.These results suggest that the corrosion behavior of Mg-8Li-3Al alloy is signifi cantly suppressed by the addition of SDS.
3.2.Surface and cross-sectional morphology study
Fig.2 shows the scanning electron microscopy (SEM) images of the surface and cross-section of the Mg-8Li-3Al alloy with and without the addition of SDS.To obtain the morphology after corrosion occurred,the Mg-8Li-3Al alloys were immersed in pure NaCl solution and 0.06 M SDS containing NaCl solution for 24 h.As shown in Fig.2a,the morphology of the Mg-8Li-3Al alloy revealed large corrosion pits with ∼500 μm lengths and many corrosion products after the sample was immersed in pure NaCl solution.However,only several fin corrosion products were formed on the sample surface that had been immersed in NaCl+0.06 M SDS solution for 24 h (Fig.2b).As exhibited in Fig.2c,when immersed in the pure NaCl solution,larger corrosion pits occurred in the cross-sectional image of the Mg-8Li-3Al alloy.It is worth noting that severe localized corrosion pits were found to extend into the interior of the Mg-8Li-3Al alloy,as shown by the arrow in Fig.2c.Additionally,a uniform corrosion fil was observed on the cross-section SEM micrograph of Mg-8Li-3Al alloy,which had been immersed in NaCl+0.06 M SDS solution for 24 h,as depicted in Fig.2d.

Fig.2.SEM images of the Mg-8Li-3Al alloy surface (a,b) and cross-section (c,d): (a,c) after immersion for 24 h in blank NaCl solution and (b,d) NaCl during immersion for 24 h with the addition of 0.06 M SDS.
3.3.Electrochemical polarization test
Fig.3 shows the potentiodynamic curves of the tested samples after immersion in aqueous solution(3.5 wt.%NaCl+0,0.02,0.04,0.06 M SDS inhibitor).Table 1 lists the fit ting data of polarization curves of the tested alloys.According to Fig.3 and Table 1,the Mg-8Li-3Al alloy with 0.02 M SDS inhibitor (−1.416 VSCE) showed a more noble corrosion potential (Ecorr) than the matrix alloy (−1.448 VSCE).As listed in Table 1,the corrosion current densities(Icorr) of Mg-8Li-3Al alloys with SDS inhibitor are smaller than that of the matrix alloy.Notably,the Mg-8Li-3Al alloy+0.06 M SDS inhibitor has the smallest corrosion current density (Icorr=61.6 mA/cm2).Additionally,the inhibition efficien y (η) of the samples increases with increasing SDS inhibitor concentration.Notably,the inhibition efficien y(η) reaches its maximum value of 89.1% for the sample in 3.5 wt.% NaCl+0.06 M SDS inhibitor.These results suggested that the aqueous solution (3.5 wt.% NaCl+0,0.02,0.04,0.06 M SDS inhibitor) can suppress the corrosion rates of the tested samples.

Table 1 Electrochemical parameters obtained from the potentiodynamic polarization curves of the tested samples and corresponding inhibition efficien y.

Table 2 Electrochemical parameters of studied alloys immersed for 1 h.

Table 3 Electrochemical parameters of studied alloys immersed for 24 h.

Fig.3.Potentiodynamic curves of the Mg-8Li-3Al alloys after immersion in aqueous solution (3.5 wt.% NaCl+0,0.02,0.04,0.06 M SDS inhibitor).
3.4.Electrochemical impedance spectroscopy (EIS)
Fig.4 shows the Nyquist plots and Bode plots,performed in aqueous solution (3.5 wt.% NaCl+0,0.02,0.04,0.06 M SDS inhibitor) at different times (1 h,24 h).As shown in Fig.4a,after 1 h of immersion,the Mg-8Li-3Al alloys were characterized by a capacitive loop and an inductive loop.Additionally,the diameter of the capacitive loops increases with increasing SDS concentration,and the Mg-8Li-3Al alloy with 0.06 M SDS inhibitor shows the largest capacitive loop radius.As exhibited in Fig.4b,the impedance moduli |Z| of the modifie alloys were larger than that of the tested alloy.Similarly,Fig.4c,d show the Nyquist plots and Bode plots of the tested alloys immersed for 24 h.All tested samples immersed for 24 h consist of a capacitive loop at high–frequency spectra,as shown in Fig.4c.It is apparent that the diameters of the capacitive loops in the SDS inhibitor were bigger than that in the pure 3.5 wt.% NaCl solution.Additionally,the corresponding Bode curves display that the tested alloy with 0.06 M SDS inhibitor has the highest value of impedance modulus |Z|,as depicted in Fig.4(d).
Fig.5 shows the corresponding equivalent circuit of the tested alloys.RS,Rct,andCPEdlare the solution resistance,charge transfer resistance,and double layer capacitance,respectively.Additionally,RLand L represent inductance resistance and inductance,respectively.Polarization resistance(Rp) is calculated as follows [28]:

Fig.4.EIS plots for the tested alloys after immersion in aqueous solution (3.5 wt.% NaCl+0,0.02,0.04,0.06 M SDS inhibitor): (a) Nyquist plots for 1 h,(b) Bode plots for 1 h,(c) Nyquist plots for 24 h,(d) Bode plots for 24 h.

Fig.5.The model with the fitte equivalent circuits of tested alloys: (a) samples immersed for 1 h,(a) samples immersed for 24 h.
The fittin results by Zview 2.8 software are shown in Tables 2 and 3.As listed in Table 2,theRpvalues of the tested samples after immersion in aqueous solution (3.5 wt.%NaCl+0.02,0.04,0.06 M SDS inhibitor) for 1 h are larger than that of the unmodifie alloy.Additionally,theRpvalues of the Mg-8Li-3Al alloy with 0.06 M SDS inhibitor increased to 358.6Ω•cm2,about 2.2 times that of the unmodifie alloy(162.5Ω•cm2).Similarly,theRctvalues of the tested samples after 24 h immersion increased with increasing of SDS concentration,and the Mg-8Li-3Al alloy with 0.06 M SDS inhibitor showed the largest value of 1296Ω•cm2.

Table 4 The calculated ELUMO,EHOMO,ΔEgap(=ELUMO–EHOMO) and LUMO–HOMO gaps for the Mg-DS– interaction.
3.5.Langmuir adsorption isotherms
In order to investigate the adsorption and inhibition mechanism of SDS,the Langmuir adsorption isotherm plots for the SDS at different concentrations is evaluated using hydrogen evolution method,and the results are shown in Fig.6.The plot of Cinh/θagainst inhibitor concentration Cinhyield a straight line with correlation coefficien of 0.997 and slop of 1.17(in Fig.6),confirmin that the adsorption of SDS on Mg-8Li-3Al alloy surface fi the Langmuir adsorption isotherm[29]:
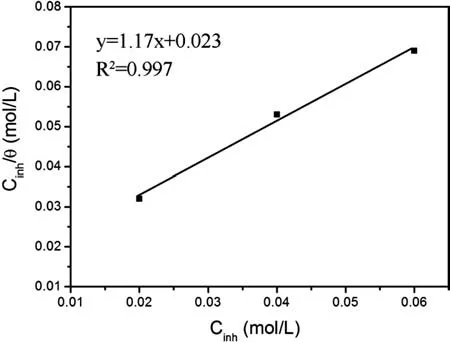
Fig.6.Langmuir adsorption isotherm plots for the SDS at different concentrations using hydrogen evolution method.

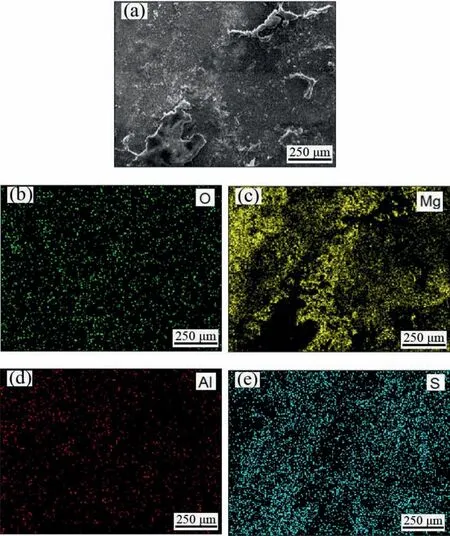
Fig.7.Main elemental distribution (b) O,(c) Mg,(d) Al and (e) S) on Mg-8Li-3Al surface after immersed for 24 h with the addition of 0.06 M SDS.
Where R is the universal gas equilibrium constant,T is absolute temperature (298 K) and 55.5 is the molar concentration of water in solution.

3.6.The corrosion layer and SPKFM study
3.6.1.The corrosion layer
To study the surface corrosion influenc of 0.06 M SDS on the Mg-8Li-3Al alloy,Fig.7 shows a BSE-SEM image of the sample and the corresponding EDXS maps.As shown in Fig.7,the surface morphology of the tested alloy revealed that the main elemental distribution is O,Mg,Al and S after the sample had been immersed for 24 h with the addition of 0.06 M SDS.Notably,the bulk material on the sample surface was mainly enriched with elemental S but not elemental Mg,suggesting that SDS inhibitor can completely cover the surface of the alloy in a dense manner,as exhibited in Fig.6a,c,e.

Fig.8.SKPFM analysis of the Mg-8Li-3Al alloy without the addition of SDS: (a) surface topographic image;(b) 3D topographic map;(c) surface potential image;(d) 3D potential map;(e) potential profile
3.6.2.Scanning kelvin probe force microscope (SKPFM)
SKPFMhas become a recent choice to study the weak force of atoms on the surface of the tested alloy,reflectin the surface morphology and surface potential of the sample [31–35].Coy et al.[36–37] used SKPFM to evaluate the role of the phases in Mg alloys on potential galvanic interactions,and the results showed that the smaller Volta potential differences of Al2Gd/α–Mg (250 mV) reduce micro-galvanic corrosion;however,the moniliform AlCuMg phase with the higher Volta potential difference(680 mV)relatively toα–Mg dramatically accelerates micro-galvanic corrosion.Moreover,the SKPFM technique is also able to detect if a metallic surface is active or passive comparing their Volta potential values for corrosion inhibition mechanism [38–39].Vega et al.[38] study the corrosion of a bare metal exposed to a droplet of electrolyte using SKP technique.In the droplet test,the potential value of a mixed surfmer (PMB_S2) coating was below −0.4 V since the beginning of the measurement and remained below this value during the droplet test.In contrast,the PMB_S1 system showed a positive potential value (around 0.3 V) and it remained in the range of 0.3 −0.4 V during the entire measurement.According to the SKP potential values and the visual inspection,the metal/coating interface with phosphatization (PMB_S1) did not undergo corrosion compared to unreacted interface (PMB_S2).In this work,the topographic map,surface potential and potential profil of the Mg-8Li-3Al alloy are given and compared with the sample immersed in SDS (Figs.8–10).
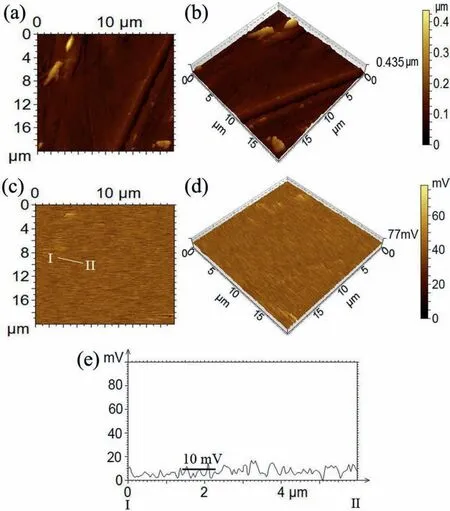
Fig.9.SKPFM analysis of the Mg-8Li-3Al alloy with the addition of SDS: (a) surface topographic image;(b) 3D topographic map;(c) surface potential image;(d) 3D potential map;(e) potential profile
Fig.8 shows the topographic map,surface potential and potential profil of the tested alloy without the addition of SDS.As shown in Fig.8a,theα-Mg phase in the sample is surrounded by the grayβ-Li phase.It can be inferred that the particle with ∼3 μm diameter and ∼0.5 μm height is the Al-Li phase,as exhibited in the 3D topographic map of Fig.8b.The Al-Li particles (135 mV) exhibit cathodic behavior compared to theα-Mg phase (25 mV),as shown in Fig.8c–e.However,with respect to the magnesium matrix,theβ-Li inclusion exhibits lower potential differences of 60 mV.
Fig.9 shows the topographic map,surface potential and potential profil of the tested alloy with the addition of SDS.As shown in Fig.9a,b,a dense and fla covering layer is observed on the surface of the sample with the addition of SDS.The surface potential map and potential profil showed that the potential value of the SDS layer is only about 10 mV(Fig.9c–e).These results suggest that the secondary phases on the surface of the specimens were all covered by SDS inhibitor,thus inhibiting to micro-galvanic corrosion.
Fig.10 presents the SKPFM images of the SDS layer with rift.As shown in Fig.10a,b,e,it can be seen that the thickness of the SDS layer is about 200 nm on the surface of the tested alloy.Additionally,a rift with about 10 μm length is found in the surface topographic map image(Fig.10b),which indicated that this area is not completely covered by the SDS layer.According to the surface potential images(Fig.10c,d,f),the surface potential near the rift is about 70 mV.Therefore,the micro-galvanic corrosion in the rift of the SDS layer probably occurred when the sample was immersed in solution.

Fig.10.SKPFM analysis of the SDS layer with rift: (a) surface topographic image;(b) 3D topographic map;(c) surface potential image;(d) 3D potential map;(e) topographic profile (f) potential profile
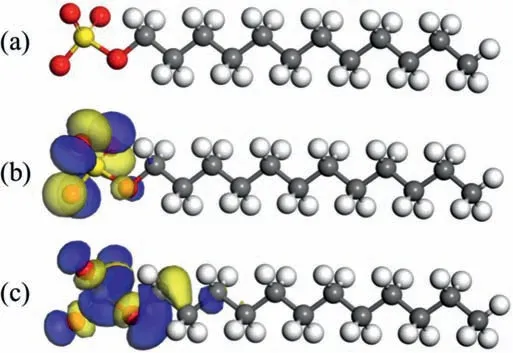
Fig.11.(a) Optimized anion structure,(b) HOMO,and (c) LUMO of DS–.
3.7.Quantum chemical calculations and molecular dynamic simulation
3.7.1.Quantum chemical calculations
The relationship between the electronic properties of the surfactant structure and the corrosion inhibition behaviors on the metallic surface are frequently investigated by frontier molecular orbital theory [22,40–45].Fig.11a–c show optimized geometric structures of the DS anion,its highest occupied molecular orbital (HOMO),and its lowest unoccupied molecular orbital (LUMO),respectively.It was found that the distribution of HOMO and LUMO mainly gather around the sulfonic acid group rather than the alkyl tail,indicating preference for the interactions with metallic surfaces [29].In addition,this interaction can be characterized by donoracceptor interactions [46].This means that a higher energy of HOMO (EHOMO) describes the tendency to donate electron(s) to the suitable acceptor molecule with low energy and empty molecular orbital.In contrast,a lower energy of LUMO(ELUMO) represents the ability to accept electron(s).The calculatedELUMO,EHOMO,the separation energy ΔEgap(=ELUMO–EHOMO),and theLUMO–HOMOgaps for the Mg-DS–interaction are given in Table 4.
It can be demonstrated that asEHOMOof Mg is higher than that of DS–,Mg acts as a Lewis base while DS–plays the role of Lewis acids.Therefore,the HOMO orbital of Mg tends to neutralize the LUMO orbital of DS–,which enhances the adsorption of DS–on the Mg surface.Further,the corrosion conducted by ion or molecule,such as Cl−or H2O,can be inhibited by the coated surfactant film This interaction provides ionic characteristics since the value ofELUMO_DS-–EHOMO_Mgis positive.As a reference,a strong covalent band can be generated only if this value is approximately zero [46,47].ΔEgapis an important parameter to express the reactivity of inhibitor molecules towards the adsorption on metallic surfaces,where a smaller value of ΔEgapimplies higher inhibitor efficien y[44].A magnitude of 3.8238 eV describes a high adsorption reactivity [45].
3.7.2.MD consideration
MD calculations were further implemented to provide additional proof regarding adsorption behavior.The initial state of the simulation box is shown in Fig.12a.The sulfonic acid head is deliberately initialized in the solvent farther away from the Mg surface while the alkyl tail is placed closer to the surface.The top view and main view of the equilibrium system after MD simulation are illustrated in Fig.12b and c,respectively.It can be clearly observed that the DS–adsorbs on the surface tightly,especially the sulfonic acid head.As such,it can be deduced that the surfactant DS–“grows”gradually on the metal surface so that a hydrophobic fil is generated,resulting in corrosion inhibition.The adsorption energyEadscan be calculated by Eq.(5) [24]:
WhereEtotalis the total energy of the simulated system,is the total energy of the Mg crystal with all H2O molecules,denotes the total energy of DS–and H2O,andis equal to the total energy of H2O.Generally,the higher the absolute value ofEads,the stronger the adsorption that can be obtained by the inhibitor molecule.The calculated value in this work is −29.0565 kJ/mol,which shows that the DS–spontaneously adsorbed on the Mg surface [46].Overall,both the DFT and MD studies are in good agreement with experimental results.
4.Discussions
Micro-galvanic corrosion,as a common mode of corrosion failure for alloys,can induce or even accelerate the occurrence of stress corrosion,crevice corrosion,hydrogen embrittlement and other corrosion processes [36,47].Organic inhibitors had been reported to be adsorbed on the cathodic AlMn intermetallics of Mg alloys and inhibit the cathodic reaction,leading to a reduction in the cathodic current of hydrogen evolution [19].However,in this work,some coarse Al-Li cathode phases were still exposed on the Mg alloy surface after immersed for 24 h with the addition of 0.06 M SDS,while the surface ofα-Mg matrix was covered by SDS adsorption layer with the thickness of ∼200 nm.Moreover,the potential value of the SDS adsorption layer is about 10 mV,which is far less than the potential difference between the cathodic phase andα-Mg.The following is a discussion on the influenc mechanism of corrosion inhibitor SDS on micro-galvanic corrosion,and the schematic diagram is shown in Fig.13.
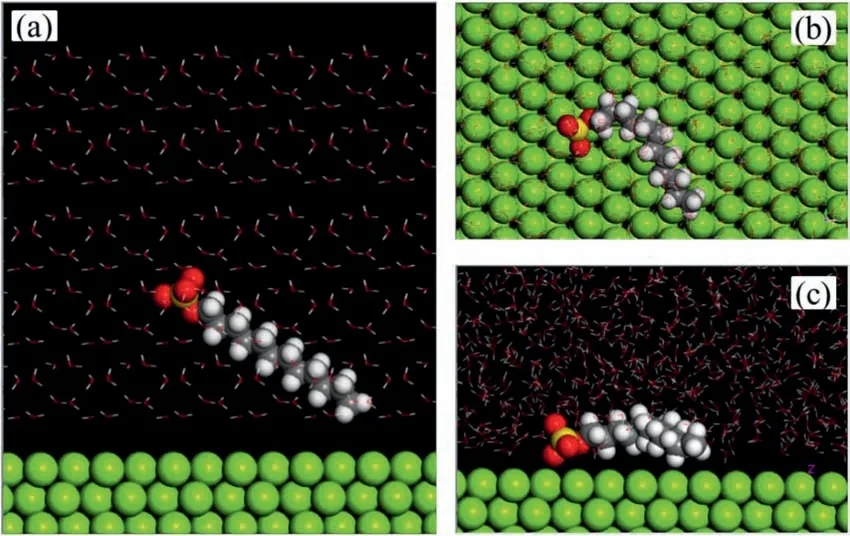
Fig.12.3D adsorption configuratio of DS– on the Mg (0 0 0 1) surface of (a) initial state;(b) top and (c) main views of equilibrium state.
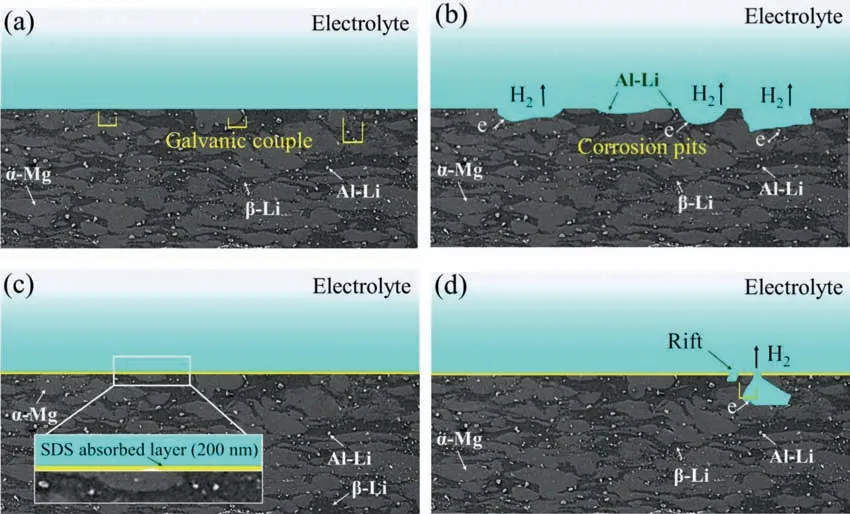
Fig.13.Schematic diagram of the corrosion and corrosion inhibition mechanism of the Mg-8Li-3Al alloy: (a) and (b) without the addition of SDS;and (c)and (d) with the addition of SDS.
In the matrix alloy,micro-galvanic couples (Al-Li/α-Mg,β-Li/α-Mg) were observed in Fig.13a,because different secondary phases have different potentials.It can be seen that hydrogen is produced on the surface of the tested alloy and there is electron exchange between the different phases.Due to the large potential difference,the Al-Li particle is the main cathode phase.As the corrosion process continued,the corrosion around the main cathode phase was serious,and the main cathode phase fell off from the alloy.As the corrosion time increased,corrosion spread along the secondary cathode(β-Li) towards the alloy interior,thus forming large pits,as shown in Fig.13b.
When adding SDS corrosion inhibitors,SDS is spontaneously adsorbed on the alloy surface.The polar sulfate head group of SDS adsorbed with theα-Mg matrix,because the adsorption energyEadsof SDS on the Mg (0 0 0 1) surface is−29.0565 kJ/mol.While the hydrophobic 12-carbon chain tail of SDS was floate on theα-Mg matrix surface,thus form a dense and uniform SDS adsorbed layer with a thickness of about 200 nm,as shown in Figs.10b and 13c.The principal cathode Al-Li and secondary cathodeβ-Li phases were covered by the SDS-adsorbed layer,leading to a reduced potential difference between the cathode phase and anodeα-Mg and inhibited micro-galvanic corrosion with the addition of SDS(in Fig.13c).Although some coarse Al-Li cathode phases were still exposed on the alloy surface with SDS adsorption layer (as shown in Figs.8 and 13c),the surrounding area of Al-Li particles was adequately covered by the SDS adsorption layer and leading to less micro-galvanic corrosion.Therefore,it can be inferred that the formation of the dense,uniform SDS adsorbed layer effectively achieves isolation between the cathode phases,anode phase and electrolyte solution.
As shown in Figs.10 and 13d,when the rift was formed in the SDS-adsorbed layer,the cathode phases and anodeα-Mg in the rift would soak in electrolyte solution,thus causing the formation of micro-galvanic corrosion.With increased of the corrosion time,corrosion pits more easily formed on the alloy surface.Meanwhile,a few severe corrosion sites occurred at the rift and continually expanded into the alloy.Hence,it can be concluded that the formation of the rift may be the main reason as to why the highest corrosion inhibition efficien y of the SDS-adsorbed layer on reached 89.1%.
5.Conclusion
The inhibition behaviors and mechanism of SDS for Mg-8Li-3Al alloy in aqueous NaCl solution have been investigated experimentally and theoretically,and the results may be summarized as follows:
(1) The combined results of immersion testing,potentiodynamic curves and electrochemical impedance spectroscopy revealed that the Mg-8Li-3Al alloy in the NaCl+0.06 M SDS corrosive medium presented the best inhibition efficien y of 89.1%.Additionally,a uniform corrosion layer was observed on the crosssectional SEM micrograph of the Mg-8Li-3Al alloy with 0.06 M SDS addition,whereas severe localized corrosion was found to extend into the interior of the Mg-8Li-3Al alloy.
(2) A 200-nm-thick SDS adsorption layer was observed by SEM and SKPFM,which evenly covered the surface of the Mg-8Li-3Al alloy.Meanwhile,the potential value of the SDS layer was only about 10 mV,suggesting that the potential difference between the secondary phases and Mg matrix dramatically decreased,thus inhibiting the occurrence of surface micro-galvanic corrosion.
(3) The calculatedELUMO,EHOMO,separation energy ΔEgap,as well as theLUMO–HOMOgaps for the Mg-DS–interaction have been given,and the MD calculation indicated that DS–spontaneously adsorbed on the Mg surface due to the adsorption energyEadsvalue(−29.0565 kJ/mol).
(4) The formation of the dense,uniform SDS-adsorbed layer effectively achieved isolation between the cathode phases,anode phase and electrolyte solution.Also,the cathode Al-Li and anodeα-Mg in the rift on the SDS adsorbed layer caused to formation of micro-galvanic corrosion and continually expanded into the alloy.
Acknowledgments
The authors would like to acknowledge the financia support by the National Natural Science Foundation of China(51961026)and the Interdisciplinary Innovation Fund of Nanchang University (Project No.2019-9166-27060003).
 Journal of Magnesium and Alloys2023年1期
- Journal of Magnesium and Alloys的其它文章
- Development of high-strength magnesium alloys with excellent ignition-proof performance based on the oxidation and ignition mechanisms: A review
- Development and application of magnesium alloy parts for automotive OEMs: A review
- Recent advances in surface endothelialization of the magnesium alloy stent materials
- Recent developments in high-pressure die-cast magnesium alloys for automotive and future applications
- Exploring the contribution of oxygen reduction reaction to Mg corrosion by modeling assisted local analysis
- Microstructures,mechanical properties,corrosion,and biocompatibility of extruded Mg-Zr-Sr-Ho alloys for biodegradable implant applications
