Exploring the contribution of oxygen reduction reaction to Mg corrosion by modeling assisted local analysis
Cheng Wng ,Wen Xu ,Dniel Höche ,Mikhil L.Zheludkevich,b ,Svitln V.Lmk
a Institute of Surface Science,Helmholtz-Zentrum Hereon,Geesthacht 21502,Germany
bInstitute for Materials Science,Faculty of Engineering,Kiel University,Kiel 24103,Germany
Abstract Oxygen reduction reaction (ORR) has been disclosed in recent studies as a significan secondary cathodic process during magnesium corrosion.This work elaborates on the contribution of ORR to the total corrosion process of pure Mg at different impurity levels in NaCl electrolyte with the assistance of local techniques.A finit element based numerical model taking into account the contribution of ORR during the corrosion of the Mg test materials has been designed in this study considering the local oxygen concentration.Respective computational simulations were calibrated based on the experimental data and evaluated accordingly.Finally,the simultaneous monitoring of local concentration of H2 and O2,and the combined modeling study reveal the relation between ORR and hydrogen evolution reaction.
Keywords: Local oxygen concentration;Oxygen reduction reaction;Mg corrosion;NaCl electrolyte;Hydrogen evolution reaction;Numerical model.
1.Introduction
The corrosion of Mg and its alloys is an electrochemical process including the anodic dissolution of Mg substrate and accompanying cathodic reduction reactions [1,2,3,4].Due to the highly active nature of Mg,whose standard electrode potential is −2.37 V (vs.SHE),hydrogen evolution reaction(HER) is typically considered as the major cathodic reduction reaction during the corrosion of Mg under neutral or alkaline conditions (Eq.(1)) [5–11].Oxygen reduction reaction(ORR),the equilibrium potential of which is much higher than that of Mg,is often the main cathodic process during the corrosion of metals less active than Mg (e.g.zinc [12,13,14],iron [15,16,17],et al.) in neutral environment (Eq.(2)).
Nevertheless,although HER has been regarded as the predominate cathodic reduction reaction during the corrosion of Mg[18,19,20,21,22,23],ORR,as a secondary cathodic reduction reaction,has gradually been put in light when considering the corrosion behavior and mechanism of Mg and its alloys.During the NaCl induced atmospheric corrosion of AZ91D Mg alloy,it was found that ORR is probably involved in the corrosion process [24].Wang et al.[25] reported different potentiodynamic behavior of AZ31 Mg alloy in NaCl solution under deaerated and aerated conditions.A higher corrosion current density of AZ31 was measured in NaCl solution under aerated conditions than that under deaerated conditions,indicating the potential contribution of ORR during the corrosion of AZ31.Recently,a study about the corrosion behavior of a galvanic couple Al-Cu-Mg observed oxygen consumption on the surface of Mg along with that on Cu [26].Afterwards,a simultaneous measurement of local current density recorded by scanning vibrating electrode technique (SVET) and local oxygen concentration found strong oxygen consumption at the active corrosion sites on the surface of commercially pure Mg in NaCl electrolyte [27].Lower rate ORR was also recorded on less cathodically active areas identifie as such by SVET.Moreover,Strebl et al.provided the evidence for the varying proportional contributions of ORR to the total cathodic process on Mg alloy during atmospheric/aqueous corrosion based on the exhaustive monitoring of all the parameters (e.g.temperature,pressure,mass loss et.al) [28,29,30,31].The outcome shows that ORR contributed 6%−11% for AZ91 contaminated with NaCl when exposed in the static manometric setup at elevated relative humidity (RH).It is noteworthy that the contribution of ORR could reach up to 60% of the total corrosion rate during the experiment with wet-dry cycles[28].
Our previous work has demonstrated a high rate ORR on a slowly corroding ultra-high-purity Mg in NaCl electrolyte[32].The rate of ORR was found possibly to depend on the growth rate of Mg(OH)2,which is the main corrosion product of Mg in the simple saline solution.The formation of Mg(OH)2impeded the diffusion of oxygen from bulk electrolyte to metal interface,preventing metallic Mg substrate from the interaction with oxygen.Besides Mg(OH)2,other precipitated products can also make similar contribution to blocking the diffusion of oxygen during Mg corrosion (e.g.including an amorphous layer of(Mg,Ca)x(PO4)y(CO3)z(OH)iprecipitated on AZ31 in DMEM [29],a protective surface fil formed on a newly arrived Mg-0.15 wt.%Ca alloy [33],an ammonia phosphate containing products layer during the corrosion Mg alloys in artificia urine solution[34],PEO coatings [35],a self-assembly of organic-inorganic hybrid coating on AZ31 [36],a self-healing superamphiphobic coating for efficien corrosion protection of magnesium alloy [37],a polyaniline/organophilic montmorillonite coating on AZ91D[38],an incombustible oxide fil on a molten Mg-Al-Ca alloy[39],additives to Mg-air battery electrolyte[40,41],et al.).These deposit layers decrease the contribution of ORR during the electrochemical corrosion of Mg alloys.The barrier property of the products layer against oxygen diffusion has been also found on Fe-and Zn-based alloys [42,43,44].Different from Mg,the corrosion rate of Fe-and Zn-based alloys significantl decreases owing to the formation of the film that hinder oxygen diffusion since ORR is the major cathodic reduction reaction during their corrosion process at neutral conditions.
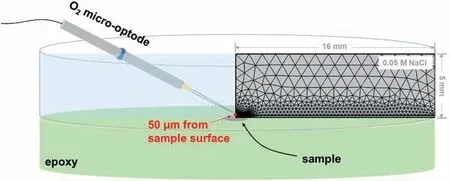
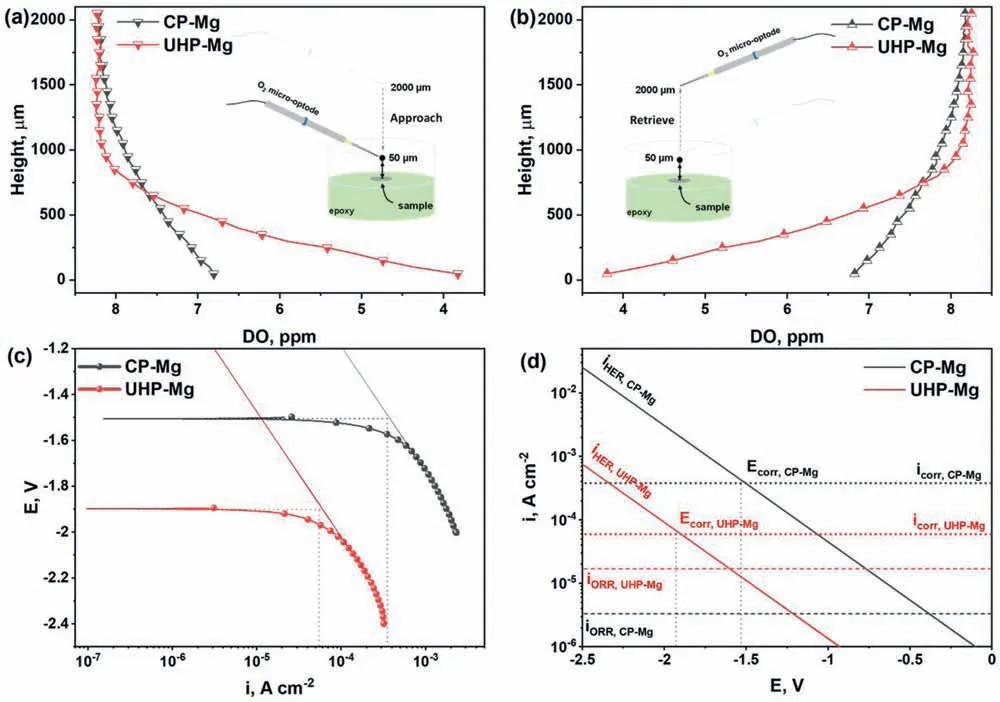
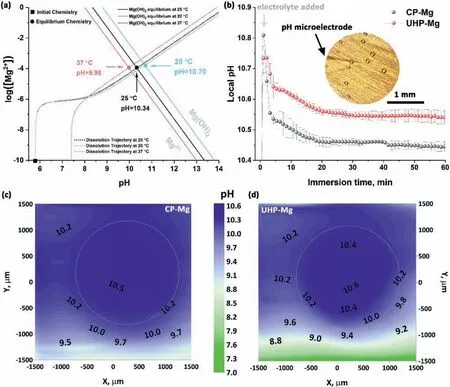
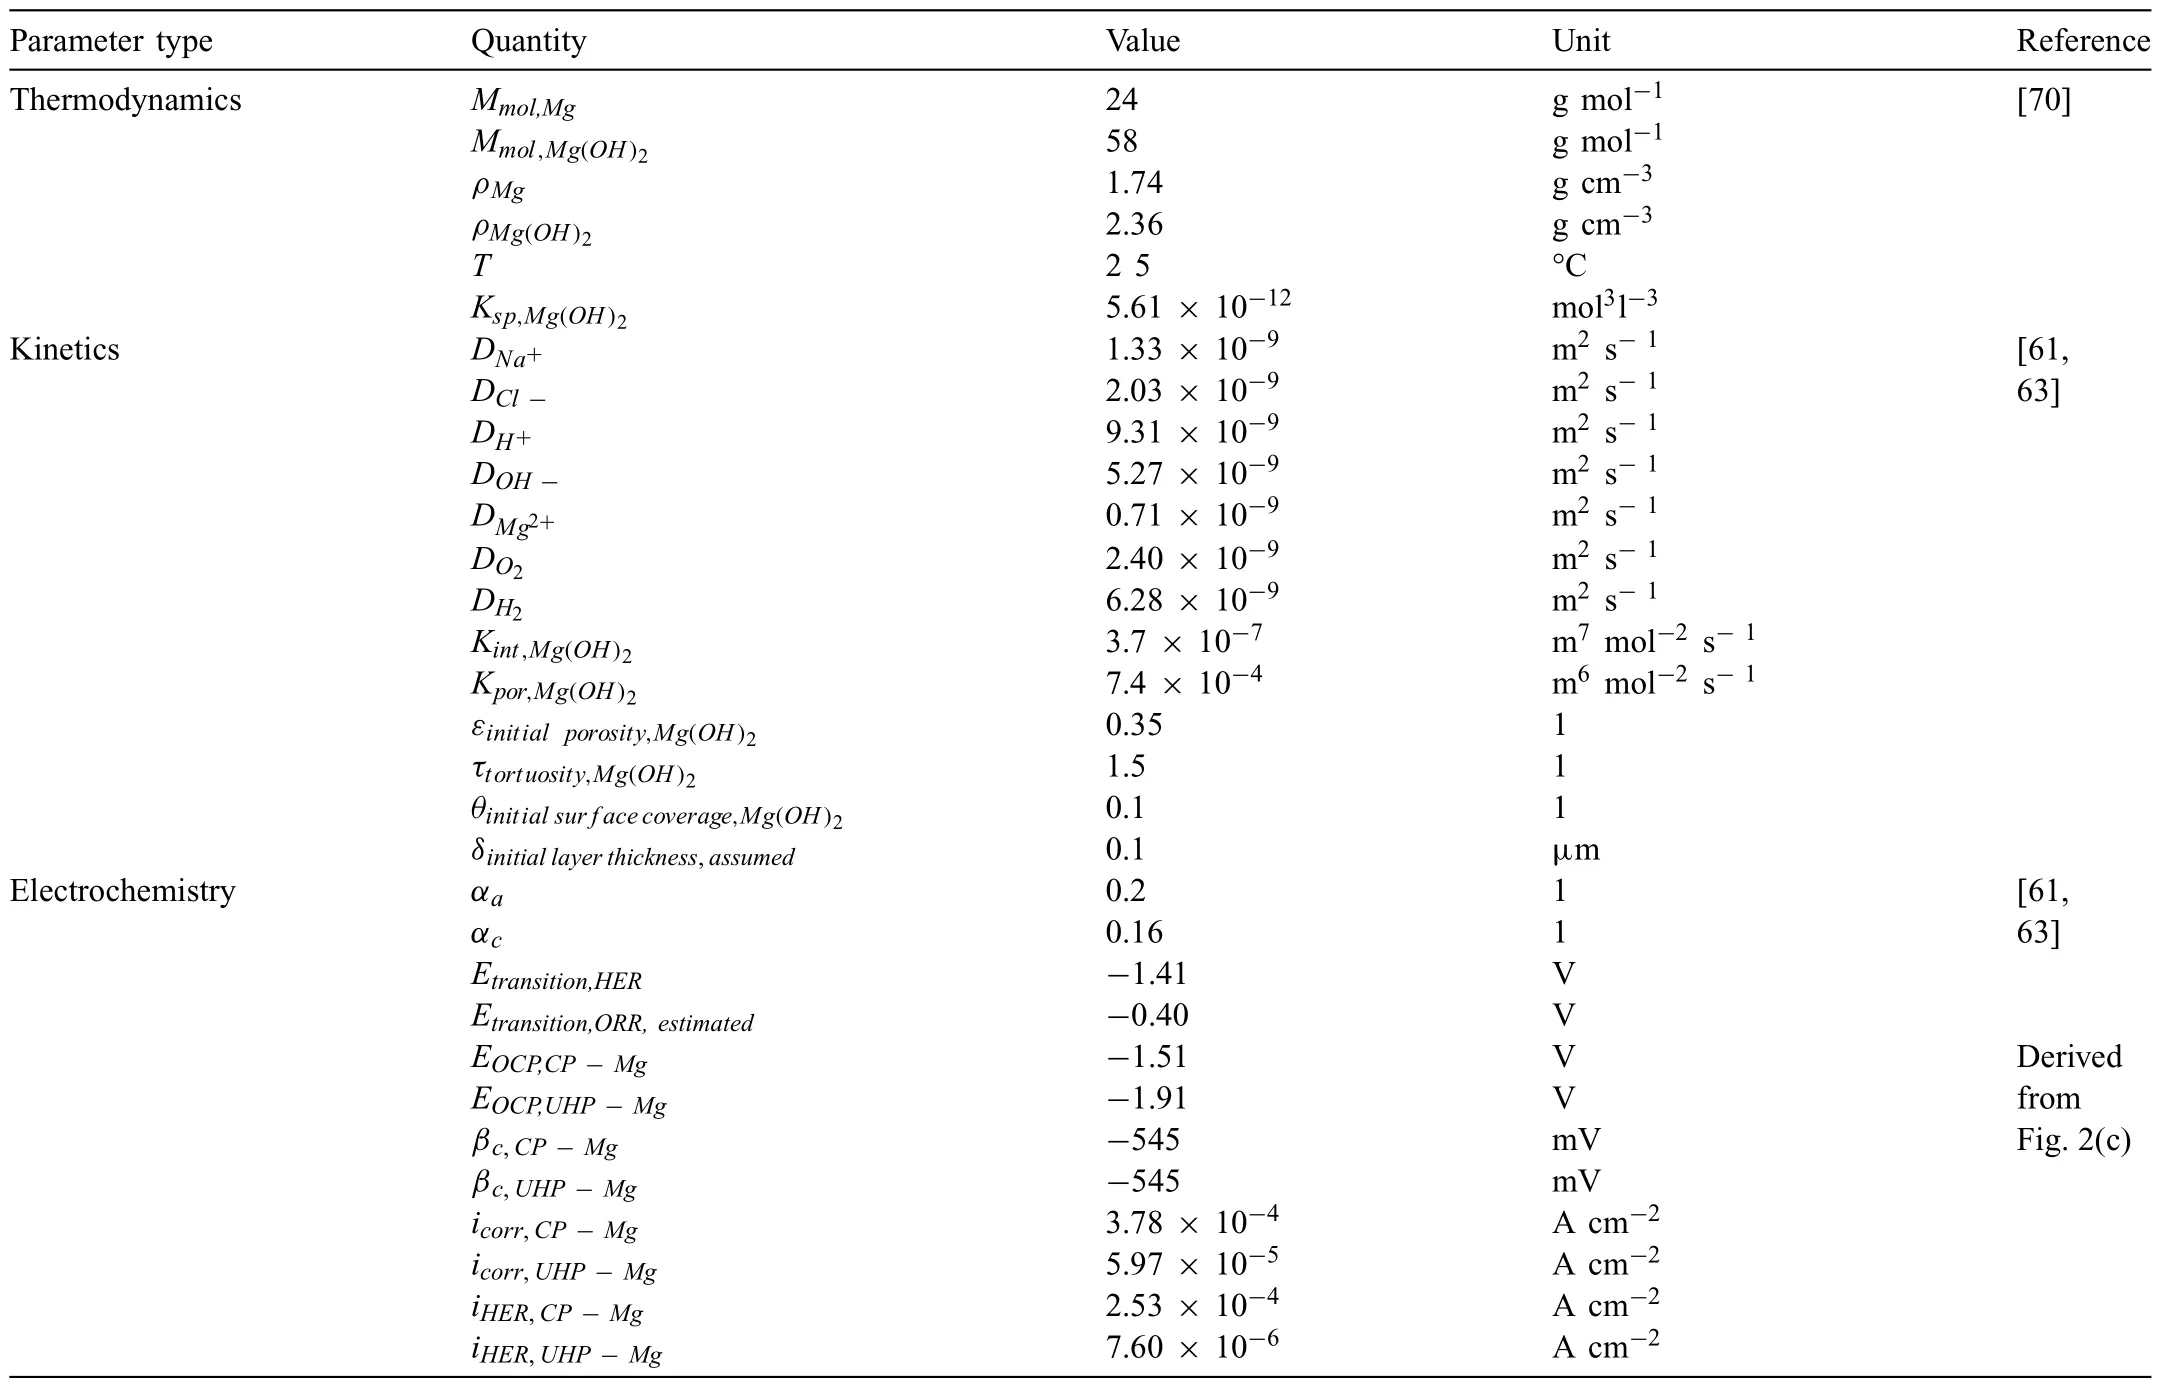
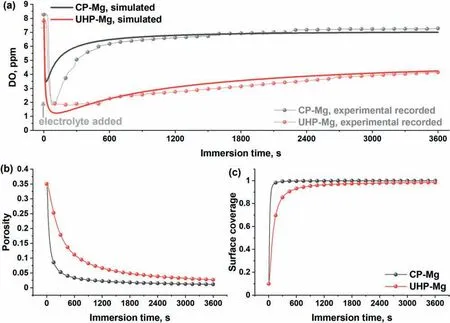
In spite of these valuable finding about ORR contribution to total cathodic process during Mg corrosion independently reported by several research groups under various experimental conditions,understanding the contribution of ORR during the corrosion of Mg still needs further investigation.Up to now,the use of the traditional electrochemical techniques(e.g.potentiodynamic polarization curves [45,46],electrochemical impedance spectroscopy (EIS) [47,48,49],et al.) has limitations to characterize ORR during the total corrosion process of Mg.For instance,the cathodic current density detected in the potentiodynamic polarization curves of Mg is mainly related to HER due to the negative cathodic potential (< Besides the abovementioned experimental efforts spent on the ORR contribution during Mg corrosion,multiple attempts have been made on in-depth understanding Mg corrosion with the assistance of the finit element modeling (FEM)[52,53,54,55],which is also beneficia to simulating the corrosion behavior of biodegradable Mg implants [56,57,58,59,60].In our previous work,Höche [61] developed a FEM to describe the deposit layer on Mg during its corrosion process with aluminum coupling.From the potentiodynamic polarization curves of bare Mg and Al,both ORR and HER reactions were observed at the cathodic branch.According to the mathematical equations fitte from the measured results,the contribution of ORR and HER to the cathodic reaction currents was approximately=10/1.Moreover,Moreas et al.[62] have recently built a FEM to study the protection mechanism of the Mg-Based organic coatings to AA2024-T351 Al alloys and indicated that ORR could be mildly inhibited by the Mg(OH)2film This findin also supports our previous conclusion [32].However,no modeling attempts so far have considered the direct contribution of ORR to the corrosion process of Mg substrate. In this work,the contribution of ORR to the total corrosion process of Mg of different purity grades in a mildly aggressive NaCl electrolyte was systematically studied by the electrochemical analysis and local O2concentration measurements.This study also aims at building a model to describe the role of ORR during Mg corrosion towards better mechanistic understanding of the role of oxygen in Mg based materials corrosion. Commercially pure Mg (CP-Mg),high purity Mg (HPMg),and ultra-high-purity Mg (UHP-Mg) were machined in the rod shape (diameterΦ=2 mm) and embedded in the epoxy resin with a round face exposed as a working surface and a disk electrode.The elemental composition of the specimens measured by Atomic Absorption Spectrometer (AAS)is listed in Table 1.The specimens were ground using SiC papers from 1200 grit to 4000 grit in absolute ethanol andthen dried and stored in a desiccator.The test electrolyte was 0.05 M NaCl aqueous solution (pH=5.8).All the experiments were executed at 22±1 °C in the air-conditioned lab. Table 1 The elemental composition of the specimens (ppm). Local O2concentration was monitored using a needletype retractable fibe-optic O2micro-optode (OXR50-UHS,PyrosciecneTM,Germany) with a tip diameter of 50 μm coupled with an oxygen logging meter (FireStingO2,PyroscienceTM,Germany). Local pH was recorded by a commercial glass-type pH microelectrode with a tip diameter of 10 μm (pH-10,Unisense,Denmark) connected to an amplifie (fx-6,Unisense,Denmark).The reference electrode was a mini Ag/AgCl/KCl saturated electrode. Local H2concentration was measured using a H2microsensor (10 μm tip diameter,H2–10,Unisense,Denmark).Both H2microelectrode and O2micro-optode were positioned using a custom-made dual-head stage for in situ simultaneously monitoring of local concentration of H2and O2.The distance between H2microelectrode and O2micro-optode was kept at 50 μm in horizontal planes via micromanipulators. All the micro probes were positioned at the height of 50 μm above the initial sample surface in a mini cell,which is an empirical setting allowing for the local measurement without forcing huge errors,but also for the safe functioning of the probes as the tip diameter of O2micro-optode is around 50 μm.The volume of the electrolyte in the mini cell was 4 ml and the height of the electrolyte was 5 mm.The vertical profil of local O2concentration was measured starting from 50 μm above the surface until 2000 μm in the bulk electrolyte.The step length was 50 μm.The sampling interval was 10 s.The sample-centered area (3000 μm×3000 μm)was mapped with a step length of 100 μm.The sampling time was 3 s so the total time for the entire mapping was roughly 1 h. All the microelectrodes were integrated into a commercial SVET-SIET system (Applicable ElectronicsTM,USA)for probe movement and data synchronization.The data was acquired by LV4 software (SciencewaresTM,USA),Unisense Logger (Unisense,Denmark),and PyroOxygenLogger (PyroscienceTM,Germany). The polarization curves were measured by the potentiostat (Interface 1010 potentiostat/galvanostat,Gamry instrument,USA).A typical three-electrode system was set for the measurements: a working electrode (exposed area: 0.5 cm2),a reference electrode (KCl saturated Ag/AgCl),and a counter electrode (a platinum wire coil).The volume of the electrolyte was 400 mL.The ratio of the exposed area to the volume of the electrolyte is similar in global and local measurements.This ratio allows for the sufficien electrolyte conductivity,fast mixing and species transport properties within the electrolyte compared to the test duration.The range of the polarization curves was set from +50 mV vs.Open Circuit Potential (OCP) to −500 mV vs.OCP.The scan rate was set to 1 mV s−1. In order to simulate ORR during the corrosion of Mg,a 2D isothermal model similar to Ref.[63] was developed.Fig.1 shows the geometry and meshed simulation domain.The governing equations of this model were based on the mass balance,Nernst-Planck and the conservation of current,which can be used to describe the diffusion and migration of ions.In addition,the porosity and the surface coverage on Mg surface can be also simulated by the corresponding mathematical expressions. To sum up,the main Eqs.(3-11) in this work are shown as follows: Fig.1.The simulated and meshed geometry based on the local oxygen measurement. Fig.2.The current contribution of ORR during the corrosion of CP-Mg and UHP-Mg after 1 h of immersion in 0.05 M NaCl electrolyte.(a,b) experimentally recorded vertical profil curves (approach and retrieve) of local O2 concentration above the surface (c) potentiodynamic polarization curves (d) Mixed potential diagram (the dashed lines are used to represent iORR since it is calculated based on the profil curves). Fig.2 shows the contribution of ORR to the total cathodic corrosion current development of CP-Mg(iORR,CP−Mg)and UHP-Mg (iORR,UHP−Mg) after 1 h of immersion in 0.05 M NaCl electrolyte.The experimentally recorded approach curves in Fig.2(a) are consistent with the retrieve curves in Fig.2(b).A linear range (50– 350 μm) of dissolved oxygen (DO) concentration was selected for calculating the current density of ORR(iORR)according to the vertical profile in Fig.2(a) and (b). Fig.3.The evolution of local pH during the corrosion of Mg.(a) chemical stability diagram calculated as proposed in [65],(b) experimentally measured immediate pH evolution,and the distribution of local pH above the surface of CP-Mg (c),and UHP-Mg (d) within 1 h of immersion in 0.05 M NaCl electrolyte at room temperature (22±1 °C).The mapping time is 1 h and the gray dash circles indicate the sample surface area. The current density of HER (iHER) and the corrosion current density(icorr)were derived from the fittin of the cathodic region in the potentiodynamic curves of CP-Mg and UHP-Mg in Fig.2(c).All the current densities (iORR,iHER,icorr) were used to construct the mixed potential diagram (Fig.2(d)).The calculated results are listed in Table 2. Table 2 The corresponding current densities and the contribution of ORR for CP-Mg and UHP-Mg. Table 3 The selected simulation parameters. Based on the calculations above,the contribution of ORR for CP-Mg is 0.9%,which is in good agreement with ourprevious reported results.While the contribution of ORR for UHP-Mg is 29.1%,which is higher than that in the previous study [32].During the corrosion of Mg in NaCl electrolyte,the corrosion resistance of Mg is attributed to the natural MgO layer on the surface [47].However,the natural MgO fil is fl wed,and the film-fre area and defects provide the sites for the dissolution of Mg substrate but also the cathodic reduction of water and oxygen.Although the higher impurities embedded in CP-Mg than UHP-Mg could provide the larger amount of available sites for ORR on CP-Mg than UHPMg,the fast corrosion rate of CP-Mg causes the Mg(OH)2deposits rapidly accumulated on these available sites.The accumulation of the Mg(OH)2deposits largely limit the diffusion of dissolved oxygen from the bulk electrolyte to the Mg substrate within 1 h-immersion in 0.05 M NaCl electrolyte(oxygen concentration at 50 μm reached 6.8 ppm vs.8 ppm in the bulk electrolyte).The porous Mg(OH)2layer on these available sites resulted in weakening ORR but keeping the rate of HER.In contrast,UHP-Mg corroded slowly,indicating a slow growth of Mg(OH)2on the surface of UHP-Mg.The DO concentration is 3.8 ppm at the height of 50 μm compared to 8 ppm in the bulk electrolyte,demonstrating a consistent consumption of dissolved oxygen by the time of 1 h of immersion.However,Mg(OH)2kept growing with the immersion time elapsed up to 24 h.A gradually diminished ORR could be expected on the surface of UHP-Mg with the continuous growth of Mg(OH)2,accounting for the decreased rate and contribution of ORR. Cathodic reactions accompanying the anodic dissolution of Mg generate hydroxyls,inducing pH increase.The correlation between pH and the concentration of dissolved Mg2+ions is constructed as a chemical stability diagram based on thermodynamics (Fig.3(a)) [65].A dissolution trajectory line is used to describe the pH evolution with the dissolution of Mg.The dissolution trajectory line of Mg intersects the equilibrium line of Mg(OH)2.With the dissolution of Mg substrate,pH rapidly increases until being bound by the formation of Mg(OH)2,which is the main corrosion products of Mg inNaCl electrolyte.The equilibrium constant of Mg(OH)2varies with temperatures.As a result,pH stabilizes in the range of 10.3–10.7 between 20 °C and 25 °C depending on the equilibrium concentration of dissolved Mg2+cations [66].Considering the extensive application of Mg alloys as biomaterials,the dissolution trajectory of Mg and the equilibrium line of Mg(OH)2at 37 °C has also been shown in Fig.3(a)based on the related equilibrium constants at 37 °C reported in [67,68,69].The initial pH for the dissolution trajectory of Mg at 37 °C was set at 7.4 due to the typical pH range for blood plasma (7.34–7.45).At 37 °C,the dissolution trajectory of Mg intersects the equilibrium line of Mg(OH)2at the pH of 9.98,indicating a facilitated formation of Mg(OH)2at 37 °C that is in good agreement with previous simulation by Hydra-Medusa software and experimental results [67]. Fig.4.The evolution at the interface of Mg modeled by Comsol using relative parameters listed in Table 3.(a) The experimental curves of local O2 concentration at the height of 50 μm above the Mg specimen from previous work [32] compared to that modeled by Comsol;(b) the evolution of the porosity of Mg(OH)2 modeled by Comsol;(c) the simulated evolution of the Mg(OH)2 surface coverage modeled by Comsol. Fig.3(b) shows the experimentally obtained immediate pH curves at the midpoint of the Mg specimen.Within the firs several minutes upon adding NaCl electrolyte,local pH above the surface of CP-Mg reached 10.82,which was slightly higher than that of UHP-Mg (10.76).This is because the corrosion rate of CP-Mg is much higher than that of UHP-Mg,meaning higher rate cathodic reactions occurring on CP-Mg compared to that on UHP-Mg.After local pH of both CP-Mg and UHP-Mg reached the maxima,local pH started to decrease and remained at around 10.45 for CP-Mg while 10.55 for UHP-Mg.The 0.1 difference of local pH could be probably attributed to the higher concentration of Mg2+cations formed locally at the interface of CP-Mg and the faster convection processes on CP-Mg than that on UHP-Mg.It is worth mentioning that the measured local pH depends not only on time and specifi location but also can be affected by the active processes (such as filiform-li e surface attacks) at relatively remote areas. The distributions of local pH above the sample of CP-Mg(Fig.3(c)) and UHP-Mg (Fig.3(d)) exhibit similar horizontal gradients because they both reached the precipitation equilibrium of Mg(OH)2.The measured maximum local pH values are in a good agreement with the immediate pH evolution in Fig.3(b).But it is also worth noticing that the minimum of local pH that measured roughly 0.5 mm away from the edge of sample surface is 8.7 for CP-Mg and 7.1 for UHP-Mg,indicating that the bulk pH of electrolyte did not reach the typical threshold value of 10.3–10.7.The difference between these lowest pH values was attributed to the higher corrosion rates of CP-Mg that generated larger amount of hydroxyls than UHP-Mg. Fig.5.The visual appearances and the distribution of the local concentration of H2 and O2 recorded at the height of 50 μm above the sample surface after 1 h of immersion simultaneously on UHP-Mg and HP-Mg in 0.05 M NaCl electrolyte.(The brown circles indicate the sample surface area). The comparison between our previously reported experimental results [32] and the simulated curves outputted from COMSOL in this work is shown in Fig.4(a).For both CPMg and UHP-Mg,the evolution trends of the simulated curves generally fi that of the previous results.The slight numerical difference between the experimental data and the simulated data might be attributed to the discrepancy between experimental condition and simulation environment: i) temperature(22 ± 1 °C in the experiment vs.25 °C in the simulation);ii)calibration and resolution limit of the oxygen micro-optode and potentiostat;iii) surface states of specimen (ground Mg sample in the experiment vs.simulated Mg surface in the modeling).The evolution of the porosity and surface coverage of Mg(OH)2deposit are also presented in Fig.4(b) and(c).The porosity of Mg(OH)2deposit on CP-Mg reached the minimum faster than that on UHP-Mg.The surface coverage of Mg(OH)2on CP-Mg reached the maximum faster than that on UHP-Mg.Both indicate that the Mg(OH)2deposit on CPMg was more compact than that on UHP-Mg,which also supports our previous cross-section SEM images [32]. Fig.5 exhibits the visual appearance,and the distribution of local concentration of H2and O2on UHP-Mg and HP-Mg within 1 h of immersion in 0.05 M NaCl electrolyte.The comparison between the distribution of local H2concentration and the distribution of local O2concentration demonstrated an experimental phenomenon that the locations generating higher H2concentration are aligned with the areas of slower ORR.Meanwhile,the locations with the lowest concentration of dissolved oxygen (the highest ORR rate) are not actively involved in HER.This correlation indicates a competitive relation between HER and ORR.Also,this correlation could be related to the convection processes due to the hydrogen bubbles.The reaction rate of ORR decreased with the growth of Mg(OH)2,hindering the Mg substrate from interacting with oxygen.While the continuous infiltratio of water through the Mg(OH)2layer made HER dominate the cathodic process,which confirme our previous assumptions.In addition,the generation of H2and gas streams in turn could cause a more significan convection allowing easier O2replenishment,leading to a high concentration of oxygen on the sample surface.These effects are also the reason why CP-Mg could not be analyzed in Fig.5 as the system is very sensitive and concentrations could not be accurately detected. In general,according to the simulated porosity and surface coverage on Mg surface and the experimental results,this model could be applied to predict the contribution of ORR to the corrosion of various Mg alloys,especially to the slowly corroding ones where ORR typically has a high contribution to the total cathodic process.It can be also useful to calculate the contribution of ORR to the total cathodic current for explaining and even correcting the discrepancy between the corrosion rate of magnesium calculated by weight loss and hydrogen evolution methods.Adopting this model further for the atmospheric conditions of varying salinity and electrolyte fil thickness will enable its application for atmospheric corrosion prediction,especially given that ORR was shown to contribute up to 60% to the total cathodic current [28].Furthermore,the uniformly corroding Mg alloys are often the most suitable candidates for selected biodegradable Mg implants where slow degradation is required.It is still challenging to observe experimentally the oxygen contribution in vivo induced by implants.Extending the current numerical model for simulating the oxygen consumption during the degradation of Mg alloys in the complex physiological environment has been put on our agendas. The contribution of ORR to the total cathodic process during the corrosion of CP-Mg and UHP-Mg in 0.05 M NaCl electrolyte was studied by spatially resolved localized techniques in this work.By the mark of 1 h,the contribution ofiORRtoicorrcould reach 29.1% for UHP-Mg,while 0.9% for CP-Mg. A numerical model was applied considering the mixed potential diagram and measured local oxygen concentration in this study,and respective simulation results confir our find ings.The evolution curves of local O2concentration at the midpoint of Mg specimens modelled well with those experimentally recorded.Local pH at Mg interface was found correlated to the equilibrium concentration of dissolved Mg2+cations and OH−anions determined by the temperaturedependent equilibrium constant of Mg(OH)2. The distribution of local concentration of H2and O2at the interface of UHP-Mg and HP-Mg demonstrated the inverse relationship between HER and ORR,and supported the previous findin that diffusion-controlled ORR highly depends on the barrier property of corrosion products on the surface. Declaration of Competing InterestThe authors declare that they have no known competing financia interests or personal relationships that could have appeared to influenc the work reported in this paper. AcknowledgementMr.Cheng Wang and Ms.Wen Xu thank the China Scholarship Council for the award of fellowship and funding (No.201806310128,201908510177).The technical supports of Mr.Volker Heitmann and Mr.Ulrich Burmester during this work are sincerely acknowledged.2.Experimental and simulation


3.Results and discussion




4.Conclusion
 Journal of Magnesium and Alloys2023年1期
- Journal of Magnesium and Alloys的其它文章
- Development of high-strength magnesium alloys with excellent ignition-proof performance based on the oxidation and ignition mechanisms: A review
- Development and application of magnesium alloy parts for automotive OEMs: A review
- Recent advances in surface endothelialization of the magnesium alloy stent materials
- Recent developments in high-pressure die-cast magnesium alloys for automotive and future applications
- Microstructures,mechanical properties,corrosion,and biocompatibility of extruded Mg-Zr-Sr-Ho alloys for biodegradable implant applications
- Fabrication of a model specimen for understanding micro-galvanic corrosion at the boundary of α-Mg and β-Mg17Al12
