Fabrication of a model specimen for understanding micro-galvanic corrosion at the boundary of α-Mg and β-Mg17Al12
Zheng Shao,Masashi Nishimoto,Izumi Muto,Yu Sugawara
Department of Materials Science,Graduate School of Engineering,Tohoku University,6-6-02 Aza-Aoba,Aramaki,Aoba-ku,Sendai 980-0579,Japan
Abstract A model specimen with a single boundary of the α/β phase simulating Mg-Al alloys was successfully fabricated by spark plasma sintering.A small electrode area of α phase or β phase was prepared using the model specimen,and the OCPs (open-circuit potentials) of each phase and a small electrode area containing the α/β phase boundary in 0.1 M NaCl at pH 8.0 were compared: the β phase exhibited a higher potential,and the α phase showed a lower potential.The OCP of the small area containing the α/β phase boundary was the intermediate value of these phases.In a small area containing α/β phase boundary,discoloration and gas bubbles were observed on the α phase,but no bubble generation was detected on the β phase.The gas bubbles were initially generated on the α phase near the β phase,but as the discoloration (corrosion) of the α phase approached the β phase,the bubbles were generated on the β phase.In micro-galvanic corrosion of the α and β phases,the β phase did not always function as the preferred cathode.The α phase partially corroded (or discolored) and became the anodes,so that the surrounding areas were most likely to be the cathodes.When corroded areas (anodes) in the α phase approached the β phase,the β phase would become cathodes.In addition to the micro-galvanic corrosion mechanism,the role of Al in corrosion resistance at the α/β phase boundary was determined by surface analysis.
Keywords: Magnesium alloy; α/β phase boundary;Micro-scale observation technique;Micro-galvanic corrosion;Spark plasma sintering.
1.Introduction
Mg alloys,such as AZ91 (Mg-9mass%Al-1mass%Zn),are lightweight materials with excellent mechanical properties[1,2].The applications of Mg alloys in automobiles could significantl contribute to reducing carbon dioxide emissions[1,3].Mg alloys are fully recyclable and abundantly available,which increases their desirability in light of rising environmental consciousness [4–8].Nonetheless,the low corrosion resistance of Mg alloys [9–11] is one of the major limitations to further applications.
Surface treatments are effective for enhancing the corrosion resistance of Mg alloys [12–15],and promising methods have been found for practical use [16–18].However,since the underlying metal may be exposed at cut edges and defects may exist,research is also being conducted on alloying elements,heat treatment,and metallurgy to improve corrosion resistance [19–22].It is well known that theβphase(Mg17Al12) is distributed intragranularly and intergranularly in Mg-Al alloys and has a significan impact on corrosion resistance [23,24].The electrode potential of theβphase is more noble than that of theαphase (Mg matrix),and it has been proposed thatβphases serve as cathodic reaction sites on Mg alloys under natural immersion conditions of chloride solutions [25–28].In addition,it is proposed that theβphase has a higher corrosion resistance than theαphase;thus,theβphase inhibits the growth of localized corrosion such as filifor corrosion [29–32].For instance,the corrosion attack progressed in theαphase and ceased when it reached theβphase [29].In addition,the corrosion resistance improves after artificially-agin heat treatment that precipitates theβphases [32].In our previous research,we observed the corrosion behavior of AZ91D Mg alloyin situand discovered that filifor corrosion was initiated and extended alongα/βlamellar structures,butβphases remained intact after filifor corrosion [33].As described previously,theβphase is regarded as advantageous for the corrosion resistance of Mg-Al alloys.Improving corrosion resistance by controllingβphase morphology is an intriguing area of study,and elucidating the electrochemical properties of theβphase is essential for achieving this objective.
In corrosive solutions,micro-galvanic cells between theβphase and Mg-matrix (αphase) are likely to form on the surface of Mg alloys [32].To comprehend the role of theβphase in the corrosion resistance,it is desirable to measure the galvanic current;however,the current between theβandαphases cannot be measured directly on actual Mg alloys.The size ofβphase in actual Mg alloys is on the order of micrometers,and theαandβphases are in contact with each other;consequently,a conventional method of measuring the galvanic current between two separated specimens ofαphase andβphase is too far from reality.In this study,specimens with a single boundary betweenαandβphases were fabricated using spark plasma sintering (SPS),and their corrosion behavior was observedin situin 0.1 M NaCl solution.
SPS is an innovative consolidation technology [34–36] developed in recent years.High-quality and low-porosity sintered specimens can be efficientl fabricated by passing a pulsed electric current directly through the powder in a die while applying pressure[36–47].SPS has also been utilized in the fabrication of Mg alloys,and research on enhancing the strength and other mechanical properties of Mg alloys has been published [41–43].However,there are only a handful of studies on the corrosion-resistant Mg alloys fabricated by SPS [44–46].Moreover,to our knowledge,SPS has not been used to fabricate specimens simulating the boundary between theαandβphases in Mg-Al alloys.
This study aims to fabricate a model specimen simulating theα/βphase boundary of Mg-Al alloy and to elucidate the micro-galvanic action at the boundary in a chloride solution.In this study,starting raw materials for SPS were chosen,and the effects of sintering conditions of holding temperature and time on the formation of the boundary betweenαandβphases were analyzed.The micro-galvanic corrosion behavior betweenαandβphases was observedin situin 0.1 M NaCl solution.Comparatively,corrosion behavior was also observed on electrode composed of onlyαphase or onlyβphase.
2.Materials and methods
2.1.Spark plasma sintering (SPS)
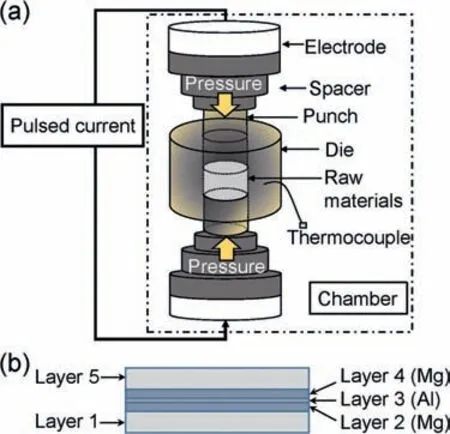
Fig.1.(a) Schematic illustration of the SPS device and (b) layer pattern of the starting raw materials fille in a graphite die.
SPS was used to fabricate model specimens with a singleα/βphase boundary of a Mg-Al alloy.Fig.1 shows a schematic illustration of the SPS device and the layer pattern of the starting raw materials in a graphite die (diameter:15 mm).Pure Mg sheet (purity: 99.9%,thickness: 0.25 mm),pure Mg powder (purity: 99.5%,particle size: 180 μm),pure Al sheet (purity: 99%,thickness: 5 mm),pure Al foil (purity: 99.999%,thickness: 0.10 mm),pure Al powder (purity:99.9%,particle size: 106–180 μm),and pure Al powder (purity: 99.99%,particle size: 45 μm) were used.These starting raw materials were fille into the SPS die as the following scheme in a glove box under Ar atmosphere,and anα/βphase boundary was intended to fabricate between Layers 2 and 3 and between Layers 3 and 4.To prevent the leakage of Mg-melt from the die during sintering,0.84 g of pure Al powders (purity: 99.9%,particle size: 106–180 μm,height in the die:ca.1.75 mm) were fille as Layer 1,followed by an Mg sheet or 0.23 g of Mg powders (height in the die:ca.0.75 mm).As Layer 3,an Al sheet or Al powder was then applied.Subsequently,the same materials as Layer 2 were used to create Layer 4,and then 0.84 g of 99.9% pure Al powder was used to create Layer 5.To obtain fla boundaries between each layer,each time after fillin Layers 2,3,and 5,a 2–3 kN pressure was applied under an Ar atmosphere.
A pulsed current was applied to the starting raw materials(SPS specimen) in the graphite die under 30 MPa of pressure in an Ar atmosphere during the sintering process.Unless otherwise specified the heating rate was 25 °C min−1and the holding temperature was 420 °C.Moreover,the holding time were changed from 30 min to 120 min.The SPS specimen was cooled to room temperature in an Ar-fille chamber following sintering.Additionally,the cylindrical SPS specimen with a height ofca.5 mm and a diameter of 15 mm was then cut vertically into two equal pieces,and the cross-sections were utilized in experiments.The cross-section was mechanically ground with SiC paper through a 1500 grit,and then finishe with 1 μm diamond paste.Finally,the specimens were rinsed with ethanol and dried with a gentle blow of N2gas.
2.2.Materials characterization
The specimens were etched in a mixture of 1.5 mL HNO3and 80 mL ethanol forca.2 s at 25 °C,and the microstructures were observed using an optical microscope and a field-emissio scanning electron microscope(FE-SEM).Additionally,energy-dispersive X-ray spectroscopy (EDS)was conducted to analyze chemical compositions.During SEM observation and EDS analysis,the vacuum level was 5.4×10⁻⁵Pa and accelerating voltage was 20 kV.The etched surfaces of the specimens were also analyzed using an electron probe micro analyzer (EPMA).The voltage for acceleration was set to 15 kV.The cross-sections of the specimens were fabricated by a Ga+focused ion beam and observed with scanning transmission electron microscope(STEM).Additionally,electron diffraction was performed to identify crystal structures.The X-ray diffraction (XRD) patterns were obtained using Cu Kαradiation and the diffraction patterns were collected over a 2θrange of 20–90° with a step width of 0.02°.A scan rate of 2° min−1was maintained and the contribution of Cu Kα2 was eliminated using computer software.
2.3.Open-circuit potential (OCP) measurements
The OCP measurements were conducted in a naturally aerated 0.1 M NaCl solution at 25 °C.The pH of the solution was adjusted to 8.0 with NaOH.A battery-powered potentiostat [47] and anin situreal-time observation system similar to that developed by Chiba et al.,[48] were used.The immersion periods were 10 and 60 min.The specimen surfaces were masked with a silicone sealant,with the exception of the working electrode area,and the sealant was cured for 12 h at 25°C andca.50%relative humidity.The size of the electrode area wasca.600 μm×ca.700 μm for the OCP measurements of the electrode with anα/βphase boundary.The electrode area wasca.660 μm ×ca.1000 μm used for the measurements of theαphase.In the case ofβphase measurements,the size of the electrode area wasca.100 μm ×ca.150 μm.The electrode potentials were measured using an Ag/AgCl(3.33 M KCl) electrode.The electrode potentials in this paper are givenversusthe Ag/AgCl (3.33 M KCl).The surface appearance of the working electrode was recorded as a movie using a CCD (charge-coupled device) camera attached to an optical microscope,and the movie was saved in the MP4 format.After the experiment was completed,time-lapse images (TIFF format) were made from the movie.
2.4.Surface analysis
Auger electron spectroscopy (AES) was performed to obtain the depth profil of the chemical compositions on the specimen surfaces.The analyzed areas were approximately 400 μm2.The voltage of the electron beam was 5 kV,and the beam current was 5 nA.Moreover,sputtering was performed with Ar+at an accelerating voltage of 2 kV with a 30° tilt.The depth was computed based on the sputtering rate of SiO2(1.13 nm min−1).
3.Results and discussion
3.1.Fabrication of α/β phase boundary by SPS
3.1.1.Feasibility assessment
In the firs attempt,instead of the layer pattern shown in Fig.1,an Mg sheet(thickness:0.25 mm,diameter:ca.10 mm)surrounded by Al powder (purity: 99.9%,particle size: 106–180 μm) was used for the SPS.Since the eutectic reaction in the Mg-Al phase diagrams occurs at approximately 437 °C[49],the sintering was conducted for 30 min at 420°C.Fig.2 shows an SEM image and the corresponding EDS maps of the sintered specimen after etching.As seen in the SEM image,the area of compositional change at the edge of the Mg sheet was thickly formed.As indicated by the EDS maps of Mg and Al,two phases were generated between Mg and Al in a layered state.In addition,the thickness of the Mg sheet was 250 μm before sintering,and the width of pure Mg after sintering was approximately 155 μm.This indicated Al and Mg diffused in an opposite direction.Numerous O spots were detected.These spots tended to be observed at the Mg sheet and Al powder locations.This is likely because Mg and Al surfaces are easily oxidized.The signals of Si spots were also seen,which are believed to be the result of contamination.Table 1 shows the relative concentrations (at.%) at Points 1 and 2 in Fig.2.At Point 1,the Mg was 56 at.% and the Al was 39 at.%,respectively.At Point 2,the Mg was 42 at.% and the Al was 56 at.%.As predicted,the Mg concentration of Point 1 was found to be higher than that of Point 2.In addition,the Al concentration was higher at Point 2 than at Point 1.It is anticipated that Al and Mg interdiffusion occurred during the SPS process.
In order to evaluate the formation of theβphase(Mg17Al12),the atomic ratios of Mg/Al at Points 1 and 2 were recorded in Table 1.According to binary phase diagrams of Mg-Al [49–53],theβphase has an atomic ratio of Mg/Al between 0.82 and 1.73.This ratio was reported to beca.2 for die-cast AZ91D Mg alloy [33].Therefore,the range of 0.82 to 2 indicates the potential formation of theβphase.Similarly,the Mg/Al atomic ratios of 0.65 to 0.74 indicate the formation of theγphase (Mg2Al3).According to Table 1,the Mg/Al ratio at Point 1 was 1.44,and at Point 2 it was 0.75.These results suggest that Point 1 was in theβphase,whereas Point 2 was most likely in theγphase.Whether or not the area at Point 1 is aβphase will be determined in detail later;however,for simplicity,the area with an Mg/Al ratio of 0.8–2 is referred to as theβphase.

Table 1 Relative concentrations (at.%) and atomic ratios of Mg/Al at Points 1 and 2 in Fig.2.

Table 2 Relative concentrations (at.%) and atomic ratios of Mg/Al at Points 3–8 in Fig.3.
According to our preliminary research,Mg would melt and adhere to graphite punches when the sintering temper-ature was set to 430 °C.In addition,it was confirme that theβphase did not form at lower temperatures.Therefore,the sintering temperature of 420 °C was determined to be appropriate.To generate a singleα/βphase boundary,it is necessary to prevent the formation of theγphase.This topic will be discussed in the subsequent section.
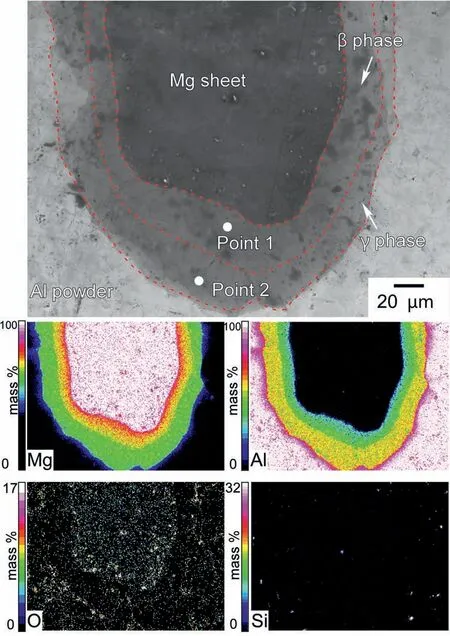
Fig.2.SEM image and the corresponding EDS maps of the etched specimen sintered from an Mg sheet,surrounded by Al powders kept at 420 °C for 30 min.
3.1.2.Optimizing fabrication conditions
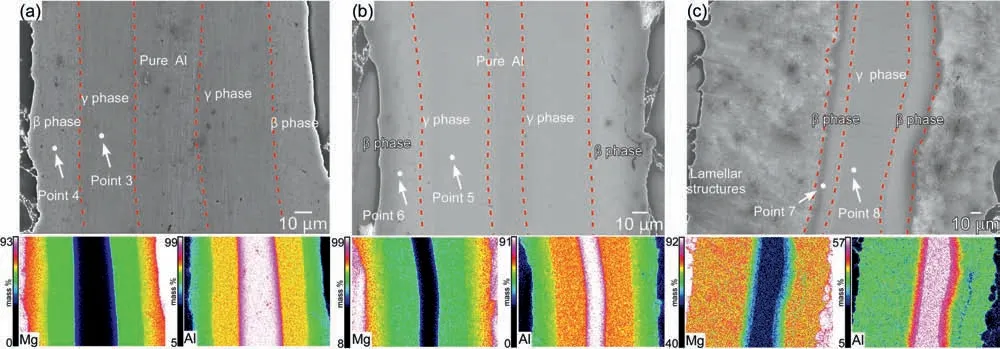
Fig.3.SEM images and the corresponding EDS maps of the etched specimens sintered from a 0.10 mm thick Al foil surrounded by Mg powders at 420 °C for (a) 50 min,(b) 80 min,and (c) 120 min.
As a second step,the layer pattern shown in Fig.1 was utilized for sintering: a 0.10 mm thick Al foil was used for Layer 3,and 0.23 g of Mg powder was used for Layers 2 and 4,respectively.Fig.3 shows SEM images and the corresponding EDS maps of sintered specimens after etching.The temperature was set to 420 °C and the holding time was increased from 50 min to 120 min.As shown in Fig.3a and 3b,when the holding time was 50 min (Fig.3a) and 80 min(Fig.3b),a central portion of the Al foil remained as pure Al.The Mg and Al maps exhibited color gradients,indicating the diffusion of Mg and Al.EDS point analysis confirme the formation of theβphase (Mg17Al12) andγphase (Mg2Al3);the results are shown in Table 2.As seen in Table 2,the Mg/Al atomic ratio was 0.69 at Point 3 and 1.48 at Point 4 in Fig.3a(50 min).According to these results,Point 3 was in theγphase and Point 4 was in theβphase.Since theβphase has a lower Al concentration than theγphase,it is reasonable that theβphase is further away from the Al foil than theγphase.At Points 5 and 6 in Fig.3b (80 min),the atomic ratio of Mg/Al was 0.72 and 1.31,respectively.According to these results,Point 5 was in theγphase and Point 6 was in theβphase.The thickness of theβphase fabricated for 50 min and 80 min exhibited no discernible difference,whereas the atomic ratio of Mg/Al increased slightly for 80-min sintering.

Table 3 Relative concentrations (at.%) and atomic ratios of Mg/Al at Points 9–11 in Fig.4.
As shown in Fig.3c,when the holding time was extended to 120 min,the remaining pure Al disappeared and dense lamellar structures were formed.As the sintering time grew longer,it is possible that theβphase melted during the SPS process.Accordingly,it was believed that lamellar structures emerged.At Points 7 and 8,the Mg/Al atomic ratio was 1.18 and 0.74,respectively.According to these results,Point 7 was in theβphase and Point 8 was in theγphase.By increasing the sintering time from 80 min to 120 min,the remaining Al disappeared,but theγphase remained.These results are likely attributable to an excessive amount of Al relative to Mg.Based on research indicating that the growth rate of theγphase is faster than that of theβphase,this expectation seems reasonable [54,55].Consequently,reducing the amount of Al may be more effective than adjusting the holding time.
As the next step,a 0.05 mm Al foil was used for Layer 3,while 0.23 g of Mg powder was used for Layers 2 and 4,respectively.The 50-min sintering was performed at 420 °C.Fig.4 shows an SEM image and the corresponding EDS maps of the sintered specimen after etching.As shown in the EDS maps,a microstructure with Mg and Al concentration gradients was generated.A comparison between the SEM image and the EDS map of Al reveals that the dark gray area of this microstructure contains a higher concentration of Al than the lighter gray areas.In addition,according to Table 3,the composition at Point 9 was 64 at.% Mg and 35 at.% Al,whereas at Point 10,the composition was 48 at.% Mg and 44 at.% Al.At these two points,the Mg/Al atomic ratio was 1.83 and 1.10.These values fall within the range indicative ofβphase formation.Consequently,a microstructure with gradations in Mg and Al concentrations was predicted to be predominantβphase;however,EDS data revealed that the distributions of Mg and Al were not uniform.The outer portion of the area with Mg and Al concentration gradients was believed to be theαphase with a relatively high Al concentration.In the SEM images,this area appears dark gray.Additionally,O signals were detected in this area.As shown in Fig.4,the signals of Fe were detected at the center of theβphase,and the concentration at Point 11 was 3 at.%.Thus,Fe was most likely a surface impurity introduced during the rolling process of the Al foils.Since Fe-containing intermetallic particles may serve as corrosive cathode sites in the corrosion of Mg alloys,these particles are expected to impede the analysis of corrosion behavior [56,57].Therefore,an Al starting raw material with low Fe impurity is necessary.
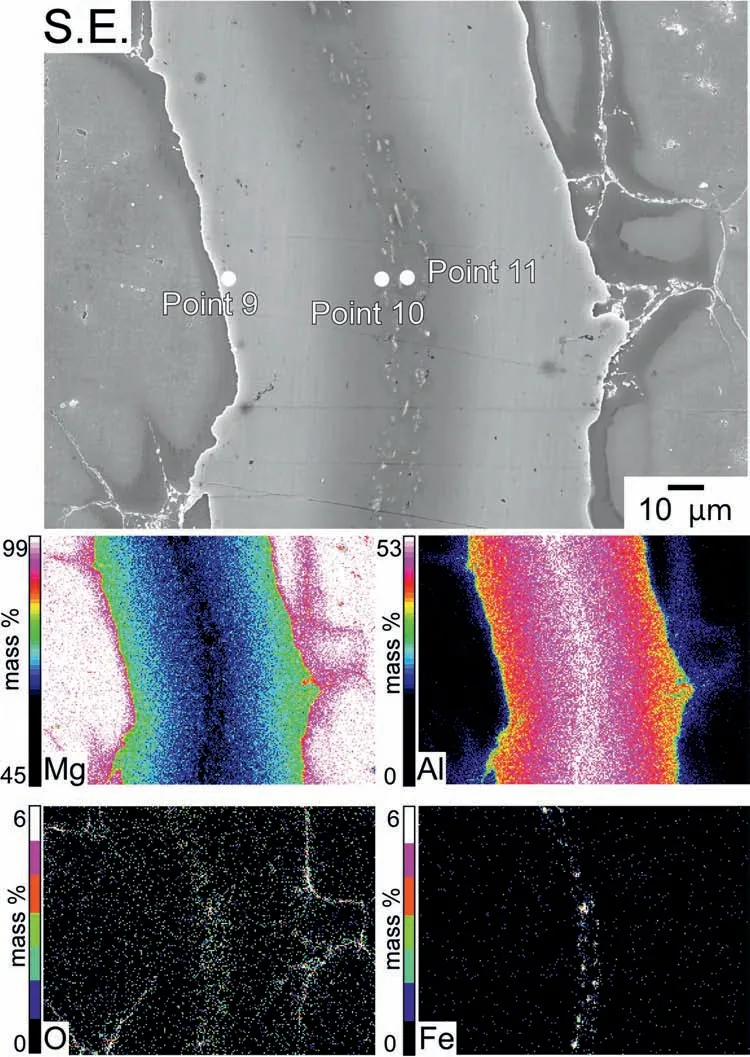
Fig.4.SEM images and the corresponding EDS maps of the etched specimen sintered from a 0.05-mm-thick Al foil surrounded by Mg powders kept at 420°C for 50 min.
In the subsequent step,instead of Al foils,a pre-pressed Al powder layer (purity: 99.99%) was used as Layer 3,and Mg powders (0.23 g) were used as Layers 2 and 4,respectively.The amount of Al powders was 0.024 g,which is equal to one Al foil measuring 0.05 mm in thickness.The sintering was conducted for 70 min at 420 °C.After etching,the sintered specimen is depicted in Fig.5 with the SEM image and the corresponding EDS maps.Pure Al areas remained when the holding time was set to 50 min,which was the same as the sintering time for specimens made with 0.05 mm foils;therefore,the holding time was set to 70 min.This could be due to the uneven pressing of Al powders in the SPS die.Table 4 shows the relative concentrations at Points 12–15 in Fig.5.At each of these points,Fe concentrations were less than 0.01 at.%.In this instance,a microstructure with a concentration gradient of Mg and Al was also fabricated.Points 14 and 15 of the EDS point analysis were examined.According to Table 4,the Mg/Al atomic ratios at Points 14 and 15 belonged to theβphase range.At Point 12,the relative concentration of Al was 0.4 at.%,which corresponds to theαphase (primaryαphase) of Mg-Al alloys.In contrast,the concentration of Al at Point 13 was 7 at.%.It suggested that this area was Al-enrichedαphase.Depending on the distance from the region of Al powder,the concentration of Al in the other point analyses varied betweenca.7 at.% toca.10 at.%.This area most likely corresponds to the region occasionally observed near the grain boundaries of as-cast AZ91,which is identifie as the eutecticαphase with a higher Al content than the primaryαphase [23,58].
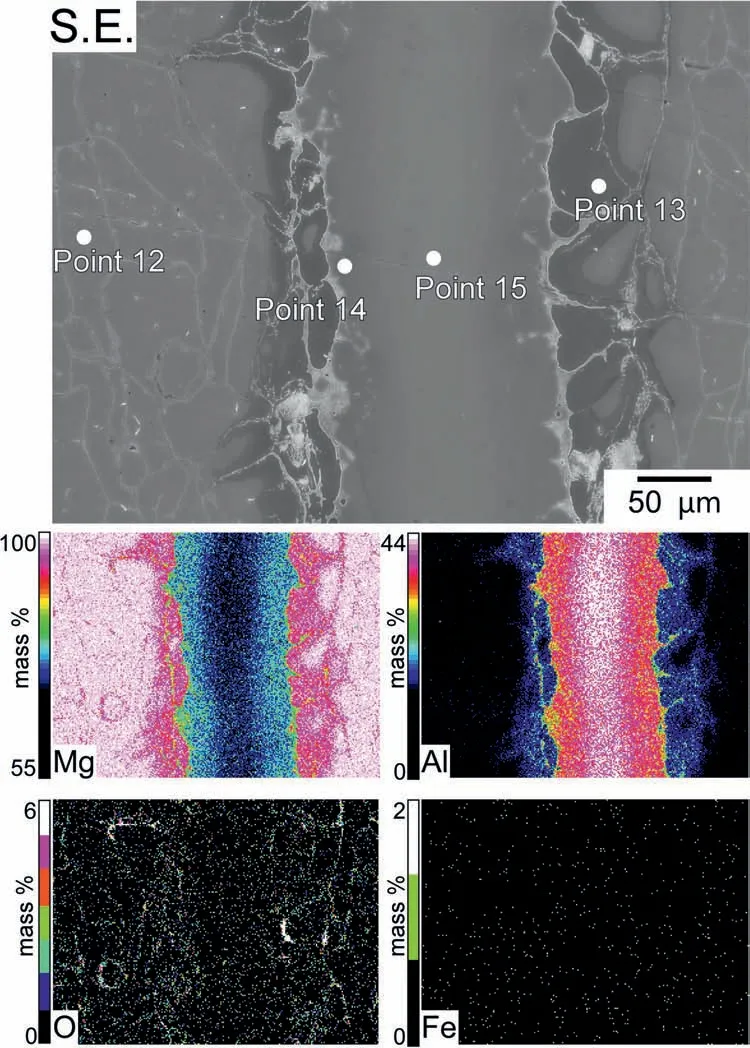
Fig.5.SEM images and the corresponding EDS maps of the etched specimen sintered from a pre-pressed Al powder layer (equal to 0.05-mm-thick Al foil)surrounded by Mg powders kept at 420 °C for 70 min.

Table 4 Relative concentrations (at.%) and atomic ratios of Mg/Al at Points 12–15 in Fig.5.
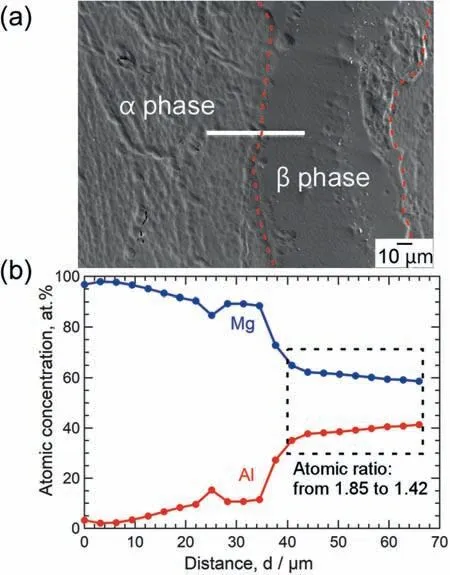
Fig.6.(a) BSE image of the specimen shown in Fig.5 and (b) changes in the atomic concentrations and atomic ratios of Mg and Al with distance.
3.2.Phase identificatio
To clearly determine the formation of theβphase,electron probe micro analyzer (EPMA),X-ray diffraction (XRD),and scanning transmission electron microscopy(STEM)were conducted.Fig.6a shows a back-scattered electron (BSE) image of the specimen shown in Fig.5.The white line indicates the location of the EPMA analysis,and Fig.6b shows the changes in the atomic concentrations and atomic ratios of Mg and Al with distance.0 μm represents the left side of the white line drawn in Fig.6a.In Fig.6b,from 0 to 35 μm,the atomic concentration of Mg decreased gradually,whereas that of Al increased gradually from 3 at.% to 11 at.%.In the range between 35 and 40 μm,the atomic concentration of Mg decreased sharply,while that of Al increased sharply from 11 at.% to 35 at.%.In the range of 40 μm to 66 μm denoted by the dotted rectangle,the atomic concentrations of Mg and Al were stable,and the Mg/Al atomic ratio ranged from 1.85 to 1.42,indicating the formation of theβphase.In addition,Al-enrichment was observed in the region between 15 and 40 μm.This region appears to correspond to the eutectic phase of Mg-Al alloys and contains the Al-enrichedαphase.
Fig.7 illustrates the XRD pattern of the specimen shown in Fig.5.The rhombuses represent the peaks of theβphase(Mg17Al12).In addition,there were peaks of Al andαphase of Mg.Al peaks were detected because the outermost layers(Layers 1 and 5) of the sintered specimen were composed of Al powders.As shown in Fig.7,the intensity of theβphase peaks was low.This is due to the fact that the formation of theβphase is restricted to the boundary between the layers of Mg and Al powders.
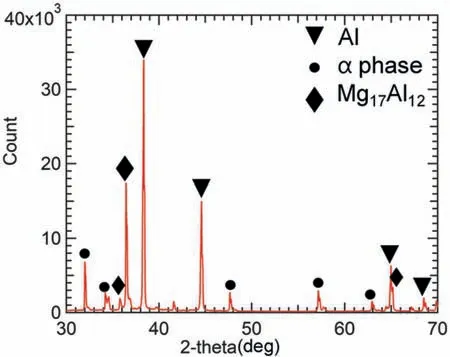
Fig.7.X-ray diffraction pattern of the specimen shown in Fig.5.
Figs.8a and 8b show an annular bright-fiel (ABF) image of a cross-section of theβphase shown in Fig.5.The cross-section was fabricated by a focused ion beam (FIB).Fig.8c shows the electron diffraction pattern.Accordingly,it was categorized asβphase(Mg17Al12,bcc,a=1.05438 nm).On the basis of current findings it can be concluded that the boundary between theαphase andβphase was successfully fabricated.
3.2.Optimal SPS parameters for α/β boundary formation
The sintering temperature is,in general,the most important variable in SPS processing.Some researchers have hypothesized that extremely high temperatures are necessary for the formation of theβphase from the mixed Mg and Al powders[55,59,60].However,in this study,sintering at 420 °C led to the formation of a singleα/βphase boundary.In addition to temperature,an oxide fil on Al powders has occasionally become the center of attention [61].At low sintering temperatures,it is difficul to break down the native oxide fil and maintain metal/oxide/metal bonds [62–64].Thus,diffusion of Al and the formation of theβphase are challenging.Additionally,diffusion is slow at low temperatures.Therefore,high temperatures are suitable for the formation of a singleα/βphase boundary.In contrast,some researchers asserted that the amount ofβphase decreased as the temperature was increased [65],and it was reported that temperatures below 360 °C were advantageous for the formation of theβphase[66].Further study is required to identify the SPS temperature that suppresses the formation of theγphase and efficientl fabricates theα/βboundary.
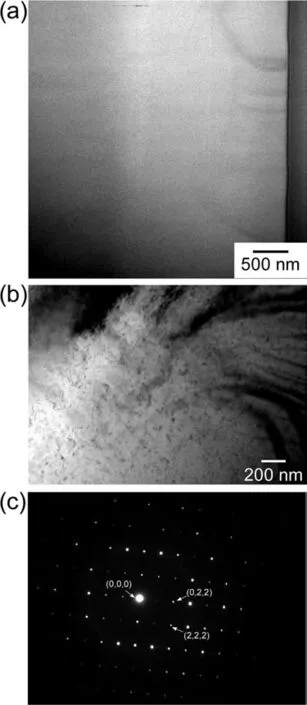
Fig.8.(a,b) STEM images and (c) diffraction pattern of the β phase shown in Fig.5.
In addition,it is well known that SPS typically has a short sintering time,but the holding time observed in this study was relatively long.However,a long holding time was necessary to fabricate a singleα/βphase boundary(see supplemental 1).In addition,this study revealed that the amount of Al (Layer 3) was a crucial factor in forming theβphase and preventing the formation of theγphase.This is because theβphase(Mg17Al12) is the second phase in the Mg-Al alloy system with the lowest Al content.In the process of alloying Mg and Al powders,the presence of excess Al results in the formation of theγphase,which is located on the Al-rich side of the Mg-Al binary diagrams.Thus,to obtain a singleα/βphase boundary,the quantity of Al powders must be precisely controlled (see supplemental 2).
This study demonstrated that a singleα/βphase boundary can be fabricated by sintering Mg powders and a small amount of Al powders at 420 °C for 70 min.The change in Al concentration from theαphase to theβphase depicted in Fig.6 is comparable to that reported in the literature for AZ91D [67],so it can be concluded that the specimen simulating a singleα/βboundary in AZ91 was successfully fabricated in this study.In addition,we were able to fabricate anαphase containing supersaturated Al on theβphase side of theαphase,which corresponds to the eutecticαphase.
3.4.In situ observations of galvanic corrosion at the α/β phase boundary
3.4.1.Open-circuit potential of each phase
To ascertain micro-galvanic coupling behavior at theα/βphase boundary of Mg-Al alloys,the open-circuit potentials(OCPs) of a small area composed ofαphase,βphase,and theα/βphase boundary (αandβphases) were measured,respectively.Fig.9 shows optical microscope images of the electrode areas before and after OCP measurements.Fig.10 shows the time variations of the OCPs of each specimen in naturally aerated 0.1 M NaCl at pH 8.0 (25 °C).The electrode of theαphase was made at least 50 μm away from theβphase to avoid the Al-enriched area.The electrode of theβphase was made at least 10 μm away from theβphase boundaries.The area of the Al-enrichedαphase was about 25 μm in the electrode of theα/βphase boundary.In addition,Figs.11,12,and 13 show optical microscope images of the electrode area of theαphase,theβphase,and theα/βphase boundary,respectively.The labels “a1–11”,“a2–l2”,and“a3–13” in Fig.10 correspond to the images (a) through (l)in Figs.11,12,and 13,respectively.The time-lapse images in Figs.11,12,and 13 were extracted from the movie during the OCP measurements.To facilitate comparison,the images for each label are displayed simultaneously for all three specimens.In Figs.11,12,and 13,“0 s” indicates immediately after immersion.
As seen in Fig.9a and 9b,corrosion (discoloration) occurred on both theαphase andβphase electrode areas.Also,in the case of the specimen with theα/βphase boundary,discoloration was generated.In Fig.9c,the left side of the image was theβphase,while the right side was theαphase.Accordingly,the left side of theαphase and the left side of theβphase were discolored.As shown in Fig.10,the OCPs were initially low and then increased to approximately−1.6 V in all cases.However,a closer inspection of the particulars reveals the unique characteristics of each specimen.During the initial stage of immersion,theβphase specimen exhibited a higher potential than theαphase specimen.The observation that theβphase exhibited higher OCP than theαphase is consistent with previous finding [68–70].Lunder et al.[32] reported that the corrosion potential of–1.66 VSCEfor Mg and −1.2 VSCEforβphase in 5% NaCl saturated with Mg(OH)2.Interestingly,as shown in Fig.10,the small area composed ofαphase andβphase exhibited intermediate values.A micro-galvanic cell was likely to form between theαandβphases in 0.1 M NaCl.
3.4.2.Corrosion behavior of α phase,β phase,and α/β phase boundary
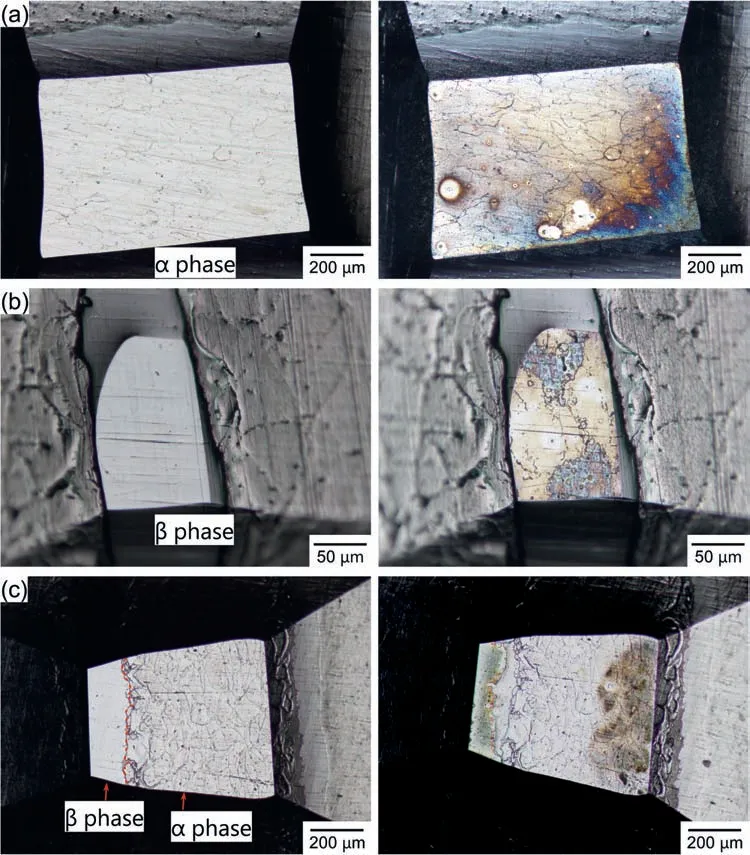
Fig.9.Optical microscope images of the electrode areas before and after OCP measurements.The electrode areas compose of (a) α phase,(b) β phase,and (c) α and β phases (α/β phase boundary).The images in the left and right columns are the electrode areas before and after the OCP measurements,respectively.
During the OCP measurement,the optical microscope images shown in Fig.11 are surface appearances of the electrode area composed ofαphase.In this instance,the electrode area was made at least 80 μm away from theβphase;therefore,the Al concentration is estimated to be less than 3 at.% based on Fig.6b.As shown in Fig.11,gas bubbles (probably H2gas) were observed at the beginning of immersion,but significan corrosion (discoloration) did not occur until 40 s.At 60 s,the discoloration was clearly visible in the lower right portion of the electrode area,and the degree of discoloration increased until 200 s.At 300 s,the discoloration almost spread across the entire electrode area,and the degree of discoloration thereafter increased with time.Comparing the spreading behavior of discoloration to the time variation of the OCP,it was discovered that between 200 s and 300 s,when the discoloration spread across the entire surface,the OCP increased significantl and then stabilized atca.−1.6 V.
As shown in Fig.12,the corrosion and discoloration behaviors of theβphase were significantl distinct from those of theαphase.In contrast,no bubbles were generated.Moreover,the degree of discoloration of theβphase was less than that of theαphase.However,the upper and lower portions of the electrode were slightly discolored immediately after immersion.From 10 to 100 s,the degree of discoloration intensifie gradually from light brown to dark brown.Throughout this time period,the OCPs increased from −1.67 V to−1.57 V.At 200 s,the discolored area turned to a lighter brown.At 600 s,the light brown discoloration was found to spread across the entire surface.As stated previously,a comparison of Figs.11 and 12 reveals that the discoloration(corrosion) of theβphase was slight compared to that of theαphase.Probably due to the formation of a corrosionresistant fil on the surface of theβphase,the OCPs of theβphase were higher than that of theαphase [71].It may be related to the high potential ofβphase and the slight discoloration.A small pit was initiated at the location indicated by the blue arrow in the discolored area,and it grew slowly.This is presumed to have caused the potential oscillations after 200 s.
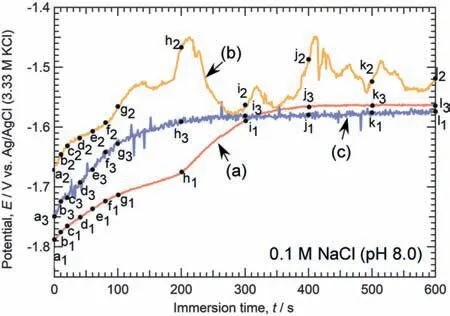
Fig.10.Time variations of the OCPs of each specimen in naturally aerated 0.1 M NaCl solution at pH 8.0 (25 °C).The electrode areas compose of(a) α phase,(b) β phase,and (c) α and β phases (α/β phase boundary),as shown in Fig.9.Labels “a1” to “l1” correspond to the images in Fig.11.Labels “a2” to “l2” correspond to the images in Fig.12.Labels “a3” to “l3”correspond to the images in Fig.13.
For the electrode area comprised ofαphase andβphase,as shown in Fig.13,gas bubbles were generated immediately after immersion.However,the bubble generation positions were not in theβphase,but in theαphase.At 10 s,the color of theβphase was observed to change to light brown.Thereafter,the discoloration of theβphase became gradually darker until 300 s.Subsequently,the discoloration of theβphase faded over time.Additionally,discoloration was observed in theαphase.The right side of theαphase began to turn light brown at 40 s.The discoloration of theαphase became gradually darker over time,but it did not significantl expand.In this experiment,the area of discoloration in theαphase was restricted to the right side of the electrode surface,while the middle portion of the electrode area remained unaffected.This region corresponds to the cathode of the micro-galvanic cell between theαandβphases.In Mg-Al alloys,it is proposed thatβphases serve as preferential cathodes,whereasαphases are primarily responsible for anodic reactions [25–28].As shown in Fig.10,the OCP of theβphase was higher than that of theαphase,so theβphase would serve as the cathode under natural immersion conditions.However,it was anticipated that the micro-galvanic corrosion behavior would be more complex,and it was discovered that the generation of gas bubbles did not occur in theβphase within 10 min,but rather in theαphase close to theβphase.Theαphase,which is close to theβphase,was anticipated to be a cathode during microgalvanic corrosion between theαandβphases at least in the initial stage of immersion.In Mg alloys,it was generally believed that theβphase mainly serves as a galvanic cathode and accelerates the corrosion of theα-Mg matrix.However,we found that theβphase was not always the preferred cathode in micro-galvanic corrosion of theαphase and theβphase.
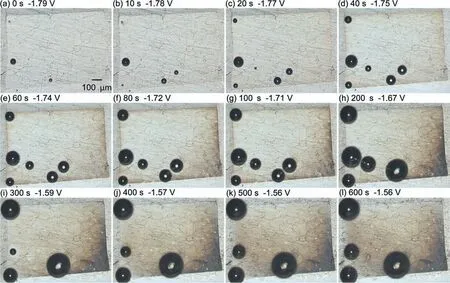
Fig.11.Optical microscope images of the electrode area composed of the α phase during the OCP measurement.Each of the images (a)–(l) is taken at the time marked as “a1”–“l2” indicated by the black dots in Fig.10.
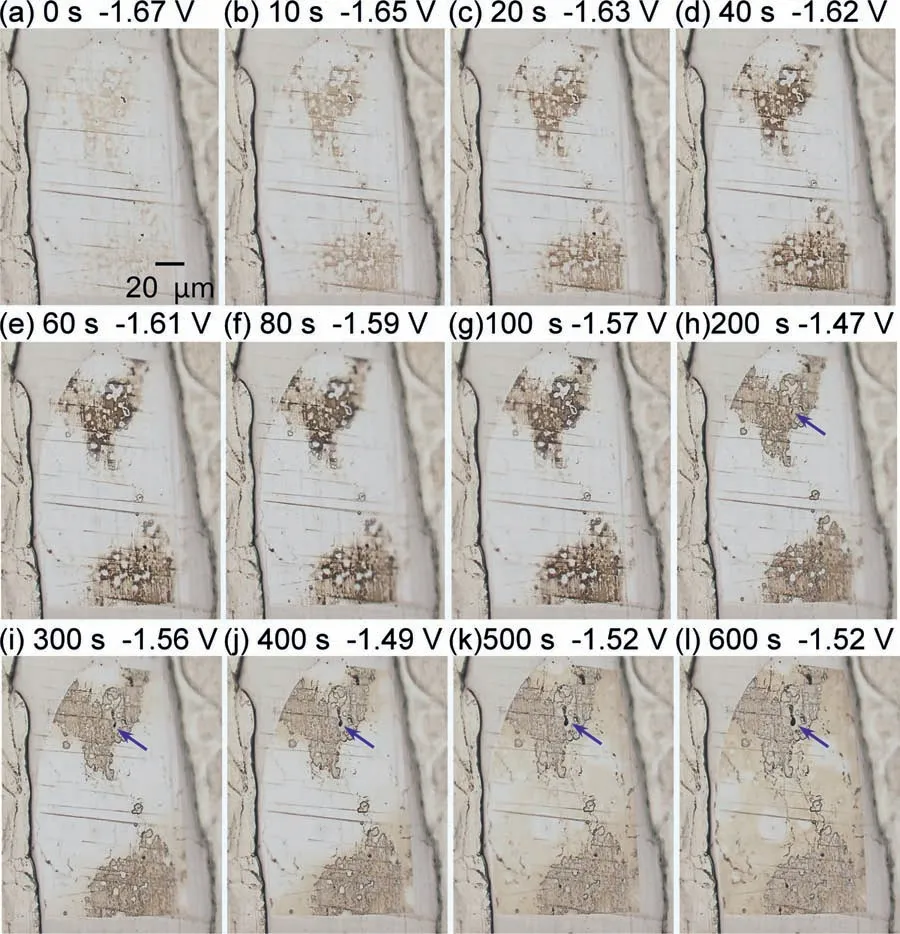
Fig.12.Optical microscope images of the electrode area composed of the β phase during the OCP measurement.Each of the images (a)–(l) is taken at the time marked as “a2”–“l2” indicated by the black dots in Fig.10.The blue arrow indicated a small pit.
3.4.3.Long-time OCP measurement of α/β phase boundary
To further clarify the micro-galvanic corrosion behavior of theα/βphase boundary,a long-time immersion(1 h)was carried out in naturally aerated 0.1 M NaCl at pH 8.0 (25 °C).Fig.14 shows the time variations of the OCP,and Fig.15 illustrates optical microscope images of theα/βboundary in the electrode area during immersion.The left side of the electrode area in Fig.15 was theβphase,while the right side was theαphase.The labels “a–1” in Fig.14 correspond to the images of (a) to (l) in Fig.15.As shown in Fig.14,the OCP oscillated and increased from −1.73 V to −1.55 V.
As shown in Fig.15a,gas bubbles were generated immediately after immersion,and in this instance,gas bubbles were also observed in theαphase near theβphase.In the initial stage of immersion,theαphase,which is close to theβphase,was thought to become a cathode even under micro-galvanic coupling between theαandβphases.Since gas bubbles were observed on theαphase side of theα/βboundary at 0 s,it was determined that a galvanic cell formed between theβphase andαphase on the electrode area.However,no bubbles were observed in theβphase,indicating that H2gas generation onβphase of Mg-Al alloys is unlikely.According to previous research,the cathodic activity ofβphase is relatively low compared to that of theαphase [32,74,75].Moreover,the potential difference between theβphase and the Mg-matrix (αphase) was in the range of 10 mV,which was insufficien to form a strong galvanic couple,according to the previous research [29,76].These are presumed to be the causes of the absence of bubbles in theβphase.
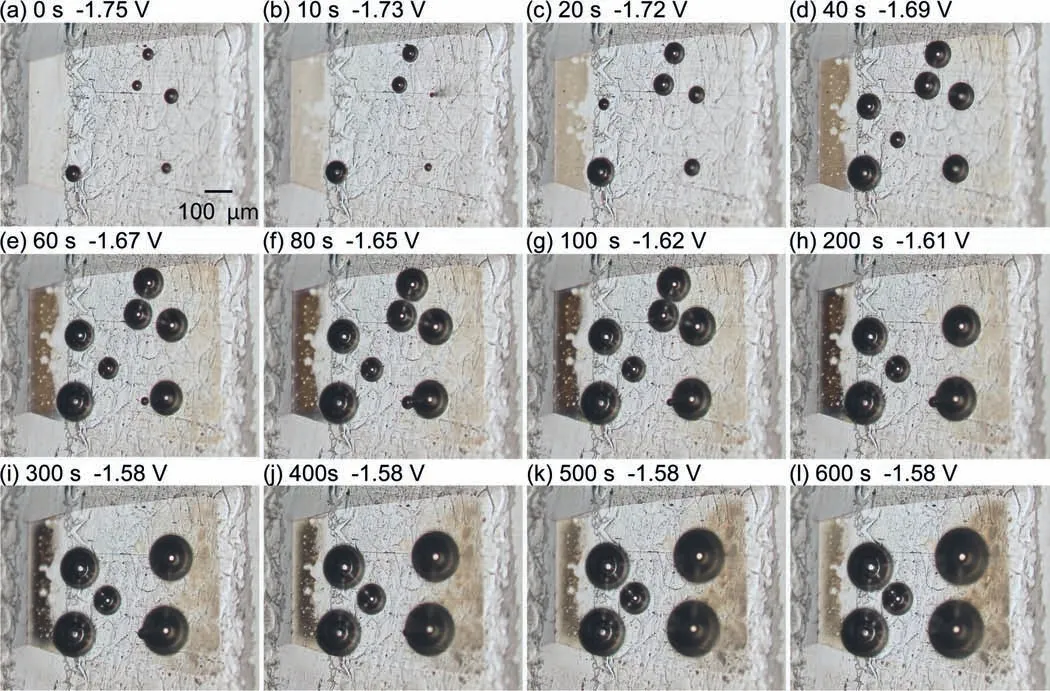
Fig.13.Optical microscope images of the electrode area composed of the α/β phase during the OCP measurement.Each of the images (a)–(l) is taken at the time marked as “a3”–“l3” indicated by the black dots in Fig.10.
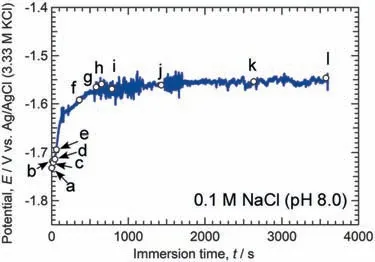
Fig.14.Time variations of the OCP of a small area composed of the α and β phases (α/β phase boundary) in naturally aerated 0.1 M NaCl solution at pH 8.0 (25 °C).Labels “a”–“l” correspond to the images in Fig.15.
In Fig.15a (0 s),theβphase has already discolored to faint brown color.This discoloration gradually disappeared after 40 s.At 40 s,the right side of theαphase began to discolor.Subsequently,the discolored area on theαphase expanded toward theβphase.Even after 1 h of immersion,not all of theαphase discolored,and theαphase withinca.50 μm of theα/βphase boundary remained uncolored.As the discoloration of theαphase approached theβphase,bubbles were generated in theβphase.Therefore,it appears that theβphase does not serve as the preferred cathode.In contrast,theαphase partially corrodes (or discolors) and becomes the anodes,whereas the surrounding areas are most likely to be the cathodes.In other words,theαphase can function as a cathode,and theβphase would function as a cathode if corroded areas (anodes) in theαphase approached theβphase.During the initial stage of immersion in this study (Figs.13 and 15),the discoloration occurred in theαphase was 300 μm away from theβphase,where it became the anode;consequently,theβphase likely did not initially become the cathode.If the size of theαphase is smaller than that used in this study,there is a possibility that theβphase could have served as the cathode from the start of the immersion.
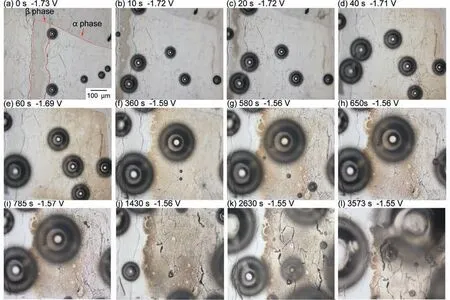
Fig.15.Optical microscope images of a small area composed of α and β phases (α/β phase boundary) during the long-time immersion (1 h).

Fig.16.(a) SEM image of the as-polished specimen surface with α/β phase boundary and (b–d) AES depth profiles (b) β phase,(c) β phase near the boundary of α phase,(d) Al-rich α phase,and (e) α phase without Al-enrichment.The indentations were made to confir the analyzed positions.
In Fig.15l,theαphase withinca.50 μm of theα/βphase boundary remained without discoloration even after 1 h of immersion.This region is determined to be the Al-enrichedαphase based on Fig.6.Accordingly,the corrosion resistance of the Al-enrichedαphase was determined to be higher than that of theαphase without Al-enrichment.According to reports,the corrosion and/or dissolution rate of Mg-Al alloys decreases as Al concentration increases [72,73].The observed discoloration behavior at and around theα/βphase boundary is consistent with these findings
3.5.Surface fil on each phase
Auger electron spectroscopy (AES) was used to determine why the Al-enrichedαphase exhibits a higher corrosion resistance than the phase without Al-enrichment.The specimen was etched,then slightly polished,and placed in the AES chamber on the same day.Fig.16a is a SEM image showing the analyzed positions on the as-polished specimen with theα/βphase boundary.AES depth profile were obtained on 1)βphase,2)βphase nearαphase,3) Al-enrichedαphase,and 4)αphase without Al-enrichment.As shown in Fig.15b through 15e,the O signal was detected on the surface in all areas.The oxide fil thickness was calculated as half of the sum of the maximum and minimum values of O Despite the fact that the specimen was sputtered deeply,the O concentration did not reach zero;therefore,the thickness indicated in Fig.15 is a reference value.Regardless,the expected order of fil thickness is as follows: (thick)αphase without Al-enrichment>Al-enrichedαphase>βphase ≈βphase nearαphase (thin).This order of thickness is consistent with the order of Al concentration in the oxide films The finding indicate that Al inhibits the formation of surface oxide film in air.
Fig.17a and 17b show an optical microscope image and SEM image of the electrode area with theα/βphase boundary after the OCP measurement(10 min immersion)as shown in Fig.13.Also in this instance,AES depth profile were acquired on 1)βphase (discolored),2)βphase nearαphase(non-discolored),3) Al-enrichedαphase (non-discolored),and 4)αphase without Al-enrichment (discolored),and the thickness of the oxide fil at each point was calculated using the same method as in Fig.16.By comparing Figs.17 and 16 (notice the difference in the range of the horizontal axis),it was confirme that oxide film grew by immersion.The surface oxide film on the discoloredβphase and the discoloredαphase without Al-enrichment were relatively thick.In contrast,the surface oxide film were relatively thin on theβphase adjacent to theαphase (non-discolored) and the Alenrichedαphase (non-discolored).A high Al concentration oxide fil was formed on the Al-enrichedαphase compared to theαphase without Al-enrichment,as depicted in Figs.17e and 17f.Therefore,it may be concluded that Al in the surface oxide fil suppressed the corrosion and/or discoloration in the Al-enrichedαphase.
In Figs.13 and 15,the discoloration on theβphase in the initial stage of immersion disappeared with time,which may be due to the dissolution of the corrosion products by the alkalization resulting from the cathodic reaction,but the details are unknown.
4.Conclusions
1.A specimen with a single boundary ofα/βphase simulating Mg-Al alloys was successfully fabricated using SPS.Al enrichment was also observed on theαphase side of the boundary,which appeared to correspond to the eutecticαphase of Mg-Al alloys.
2.The OCPs of each phase and a small area with the boundary in 0.1 M NaCl at pH 8.0 were compared:theβphase exhibited a higher potential,whereas theαphase exhibited a lower potential.The OCP of a small area containing theα/βphase boundary was the intermediate value of these phases.
3.Under natural immersion of the 0.1 M NaCl solution,discoloration and gas bubble generation were observed on a small area of theαphase,whereas no bubble generation was observed on theβphase.In the case of a small area with anα/βphase boundary,discoloration and gas bubbles were observed on theαphase,but no bubble generation was observed on theβphase.By long-time immersion as the discoloration (corrosion) of theαphase approached theβphase,the bubbles were generated on theβphase.
4.In micro-galvanic corrosion of theαphase and theβphase,it was determined that theβphase was not always the preferred cathode.Theαphase partially corroded (or discolored) and became the anodes,whereas the surrounding areas were likely to be the cathodes.When corroded areas (anodes) of theαphase approached theβphase,theβphase would become the cathodes.
5.Even after 1 h of immersion in the 0.1 M NaCl solution,the Al-enriched phase located close to theα/βphase boundary exhibited no discoloration.Al in the surface oxide fil inhibited corrosion and/or discoloration in the Al-enrichedαphase.
Data availability
The raw/processed data required to reproduce these find ings cannot be shared at this time because the data also forms part of an ongoing study.
Declaration of Competing InterestThe authors declare that they have no known competing financia interests or personal relationships that could have appeared to influenc the work reported in this paper.
CRediT authorship contribution statementZheng Shao:Investigation,Data curation,Methodology,Writing– original draft.Masashi Nishimoto:Data curation,Writing– review &editing.Izumi Muto:Conceptualization,Methodology,Writing– review &editing,Supervision,Funding acquisition.Yu Sugawara:Writing– review &editing.
Acknowledgments
Part of this work was supported by JSPS KAKENHI Grant Numbers JP17H01331 and JP21K18804.This study was supported by The Light Metal Educational Foundation Inc.of Japan.This research was also supported by Amano Institute of Technology and China Scholarship Council.
Supplementary materials
Supplementary material associated with this article can be found,in the online version,at doi:10.1016/j.jma.2022.10.020.
 Journal of Magnesium and Alloys2023年1期
- Journal of Magnesium and Alloys的其它文章
- Development of high-strength magnesium alloys with excellent ignition-proof performance based on the oxidation and ignition mechanisms: A review
- Development and application of magnesium alloy parts for automotive OEMs: A review
- Recent advances in surface endothelialization of the magnesium alloy stent materials
- Recent developments in high-pressure die-cast magnesium alloys for automotive and future applications
- Exploring the contribution of oxygen reduction reaction to Mg corrosion by modeling assisted local analysis
- Microstructures,mechanical properties,corrosion,and biocompatibility of extruded Mg-Zr-Sr-Ho alloys for biodegradable implant applications
