Nomogram for predicting non-proliferative vitreoretinopathy probability after vitrectomy in eyes with rhegmatogenous retinal detachment
Zhi-Qiang Gao, Pei-Yu Wu, Jing Zhang, Zhi-Sheng Ke, Xu-Ting Hu, Zhao-Liang Zhang,Jing-Wei Zheng, Zong-Duan Zhang, Qin-Tuo Pan
1Department of Ophthalmology, the Third People’s Hospital of Yuhang District, Hangzhou 311115, Zhejiang Province, China
2Department of Fundus Surgery, Eye Hospital and School of Ophthalmology and Optometry, Wenzhou Medical University,Wenzhou 325027, Zhejiang Province, China
3Department of Ophthalmic Clinic, Eye Hospital and School of Ophthalmology and Optometry, Wenzhou Medical University,Wenzhou 325027, Zhejiang Province, China
4Department of Gastroenterology, the First People’s Hospital of Linping District, Hangzhou 311100, Zhejiang Province, China
Abstract
● KEYWORDS: nomogram; proliferative vitreoretinopathy;rhegmatogenous retinal detachment; risk factor
INTRODUCTION
With decades of advances in vitreoretinal surgery, the primary success rate of surgery for rhegmatogenous retinal detachment (RRD) has increased to over 90%[1-2].Among RRD surgeries that fail, development of proliferative vitreoretinopathy (PVR) is the most common cause[3-4]. The incidence of postoperative PVR ranged from 4% to 34% in prospective studies[5]. Reduction of the incidence of PVR by surgical techniques or agents has always been a challenge for vitreoretinal surgeons[6]. A key step in achieving this is to identify patients at high risk for PVR development because they would benefit the most.
Previous studies have reported multiple clinical risk factors for PVR through univariate and multiple regression analyses,including preoperative PVR, preoperative vitreous hemorrhage,silicone oil (SO) tamponade, large retinal hiatus, choroidal detachment (CD), and excessive cryotherapy[7-8]. However,the results of these studies were frequently inconsistent and contradictory. Some researchers have used these risk factors to devise formulas to predict the risk for PVR development[9-12].Nevertheless, these formulas are complex, have low sensitivity and specificity, and external validation showed that they are not reliable for clinical application[13]. This prompted us to devise a more convenient, accurate, and clinically applicable method for predicting PVR occurrence.
A nomogram is a popular tool for predicting survival prognosis of cancer, including mortality and recurrence. It can construct a concise numerical estimation model to predict the probability of an event and effectively simplify complex statistical prediction models which contain a large number of factors[14].The nomogram is an easy to master form of graphical interface for clinical decision-making, which is a graphical representation of a complex mathematical formula[15]. In the same way, a nomogram can also be applied to eye diseases research to obtain statistical predictive models to predict the prognosis of eye diseases.
The purpose of this study was to identify the risk factors for postoperative PVR in patients with primary RRD. Furthermore,a nomogram was generated to predict the probability of being PVR-free in patients with primary RRD at different time points after vitrectomy.
SUBJECTS AND METHODS
Ethical ApprovalThe retrospective study protocol was approved by the Eye Hospital and School of Ophthalmology and Optometry Ethics Committee of Wenzhou Medical University(MEC numbers: 2021-083-K-72). All clinical procedures were performed in accordance with the Helsinki Declaration. The informed consent was obtained from the subjects.
PatientsThe patients who underwent first vitrectomy surgery to repair primary RRD in our hospital from January 2016 to January 2020 were reviewed. Surgical procedures included 23-G vitrectomy (Constellation vision system, Alcon,Fort Worth, TX, USA) combined with SO (SO, RT SILOL 5000cs; Carl Zeiss Meditec AG company, Germany) or perfluoropropane (C3F8) tamponade, and all patients underwent phacoemulsification and intraocular lens (IOL) implantation during the first operation. The exclusion criteria were previous intraocular surgery (e.g., vitreoretinal surgery, glaucoma surgery, or crystalline lens surgery), pseudophakia or aphakia,diabetic retinopathy, type 1 diabetes, history of trauma, history of severe intraocular infections or inflammatory disease, a follow-up time less than 6mo, or severe data loss.
Data CollectionPatients’ clinical data were obtained from hospital medical records, including age, sex, medical history,systemic disease, diagnosis, time from onset to surgery (TOS),lens status, surgical procedures, PVR grade, intraocular pressure, preoperative and postoperative routine examinations,perioperative complications, and follow-up time.
The following factors of postoperative PVR were evaluated:age, sex, silicone oil tamponade time (SOTT), cryotherapy,photocoagulation energy (PE), number of photocoagulation points (NOPP), electric coagulation (EC), type 2 diabetes(T2D), hypertension, retinal tear size (RTS), retinal detachment(RD) extension, SO or C3F8tamponade, preoperative CD, and preoperative PVR. The type of tamponade is chosen by the surgeon depended on experience and patient preference[16]. All operations were performed by an experienced vitreoretinal surgeon under retrobulbar block anesthesia.
PVR was graded according to the 1983 International Retinal Association Classification Guidelines[17]. The SOTT was divided into five grades according to the length of time: grade I,2-3mo; grade II, 4-6mo; grade III, 7-9mo; grade IV, 10-12mo;and grade V, >12mo. The PE was divided into four grades according to the energy used during the first surgery: grade I,120-165 mV; grade II, 166-210 mV; grade III, 211-255 mV;and grade V, 256-300 mV. The long diameter of a retinal tear was evaluated according to the diameter of the optic papilla(PD).
Statistical AnalysisKolmogorov-Smirnov inspection of continuous numerical variables was used to test for normal distribution. Chi-square test or Fisher’s exact test was applied for univariate analysis of categorical variables. Wilcoxon rank sum test was used for univariate analysis of rank variables and Student’s normalt-test was used to compare the mean values of normal distribution variables. The differences between groups with and without postoperative PVR were compared.Logistic regression analysis was applied to identify the risk factors for postoperative PVR. Stepwise regression analysis was used to further determine the risk factors which were used to establish the model. Based on the results of multivariate analysis, a nomogram was constructed to predict the 3-, 4-,5-, and 6-month postoperative PVR-free probabilities. We developed the model in the training set and then validated it in the validation set to ensure the prediction accuracy of the nomogram. Harrell’s consistency index (C-index) and the area under the time-dependent receiver operating characteristic(ROC) curve were used to estimate the prediction accuracy of the constructed nomogram. The calibration curves were used to compare the predicted probability and the actual results, using a 45-degree line as the optimal model. Finally,decision-curve analysis (DCA) was applied to evaluate the clinical nomogram application by quantifying the net improvement benefits under different threshold probabilities.Statistical analyses were performed using SPSS (version 24.0, SPSS Inc., Chicago, IL, USA) and R version 3.4.2 software (The R Foundation for Statistical Computing, Vienna,Austria. http://www.r-project.org). AP<0.05 was considered statistically significant.
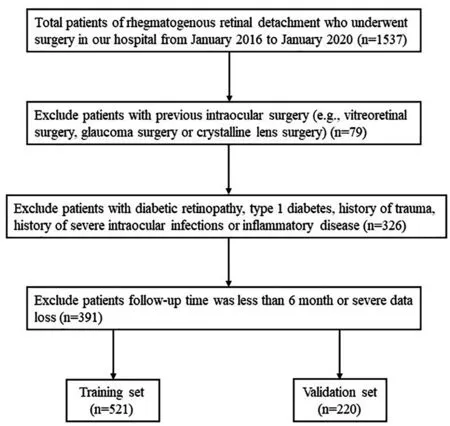
Figure 1 Flow diagram of the data screening process.
RESULTS
Patient CharacteristicsA total of 1537 eyes with primary RRD in 1537 patients were reviewed. Finally, 741 patients were included after screening with the exclusion criteria, and 521 were randomly assigned to the training set and 220 to the validation set (Figure 1). In the training group, most patients were aged <70y (94.7%) and male (56.2%), while 6% had T2D and 28.6% were hypertensive.
The TOS of patients was usually <7d (84.5% of 521). The most common primary RTS was <1 PD (77.9% of 521). RD extension in most patients was ≤2 quadrants (86.2% of 521).Preoperative CD was present in 51 (9.8% of 521) patients.There were 180 (34.5% of 521) patients with preoperative PVR, including 25 (13.9% of 180) with grade B and 155 (86.1%of 180) with grade C (Table 1). Following surgery, 117 (22.5%of 521) patients eventually developed postoperative PVR,including 15 (13.3% of 113) grade B and 98 (86.7% of 113)grade C (Table 2). In this study, patients in the training and validation sets were comparable in all clinical characteristics(Table 1).
Univariate and Multivariate Logistic Regression Analyses of Effects of Factors on Postoperative PVRIn the training cohort, univariate analysis showed that eleven variables of the characteristics were significantly associated with postoperative PVR, which were the SOTT, PE, NOPP, EC, cryotherapy,T2D, hypertension, RTS, SO tamponade, preoperative CD,and preoperative PVR (Table 2). However, only the SOTT,PE, hypertension, RTS, and preoperative PVR were identified as significantly associated with postoperative PVR in the multivariate logistic regression analysis (P<0.05; Table 3).
Nomogram ConstructionAll five significant independent risk factors for postoperative PVR identified by multivariatelogistic regression analysis were integrated to develop the nomogram. Figure 2 demonstrates the nomogram to predict the 3-, 4-, 5-, and 6-month postoperative PVR-free probabilities in the training set. By summing up the scores for each variable, it is convenient to calculate a patient’s individual postoperative PVR-free probability at different points in time.

Table 1 Characteristics of the training and validation cohorts n (%)
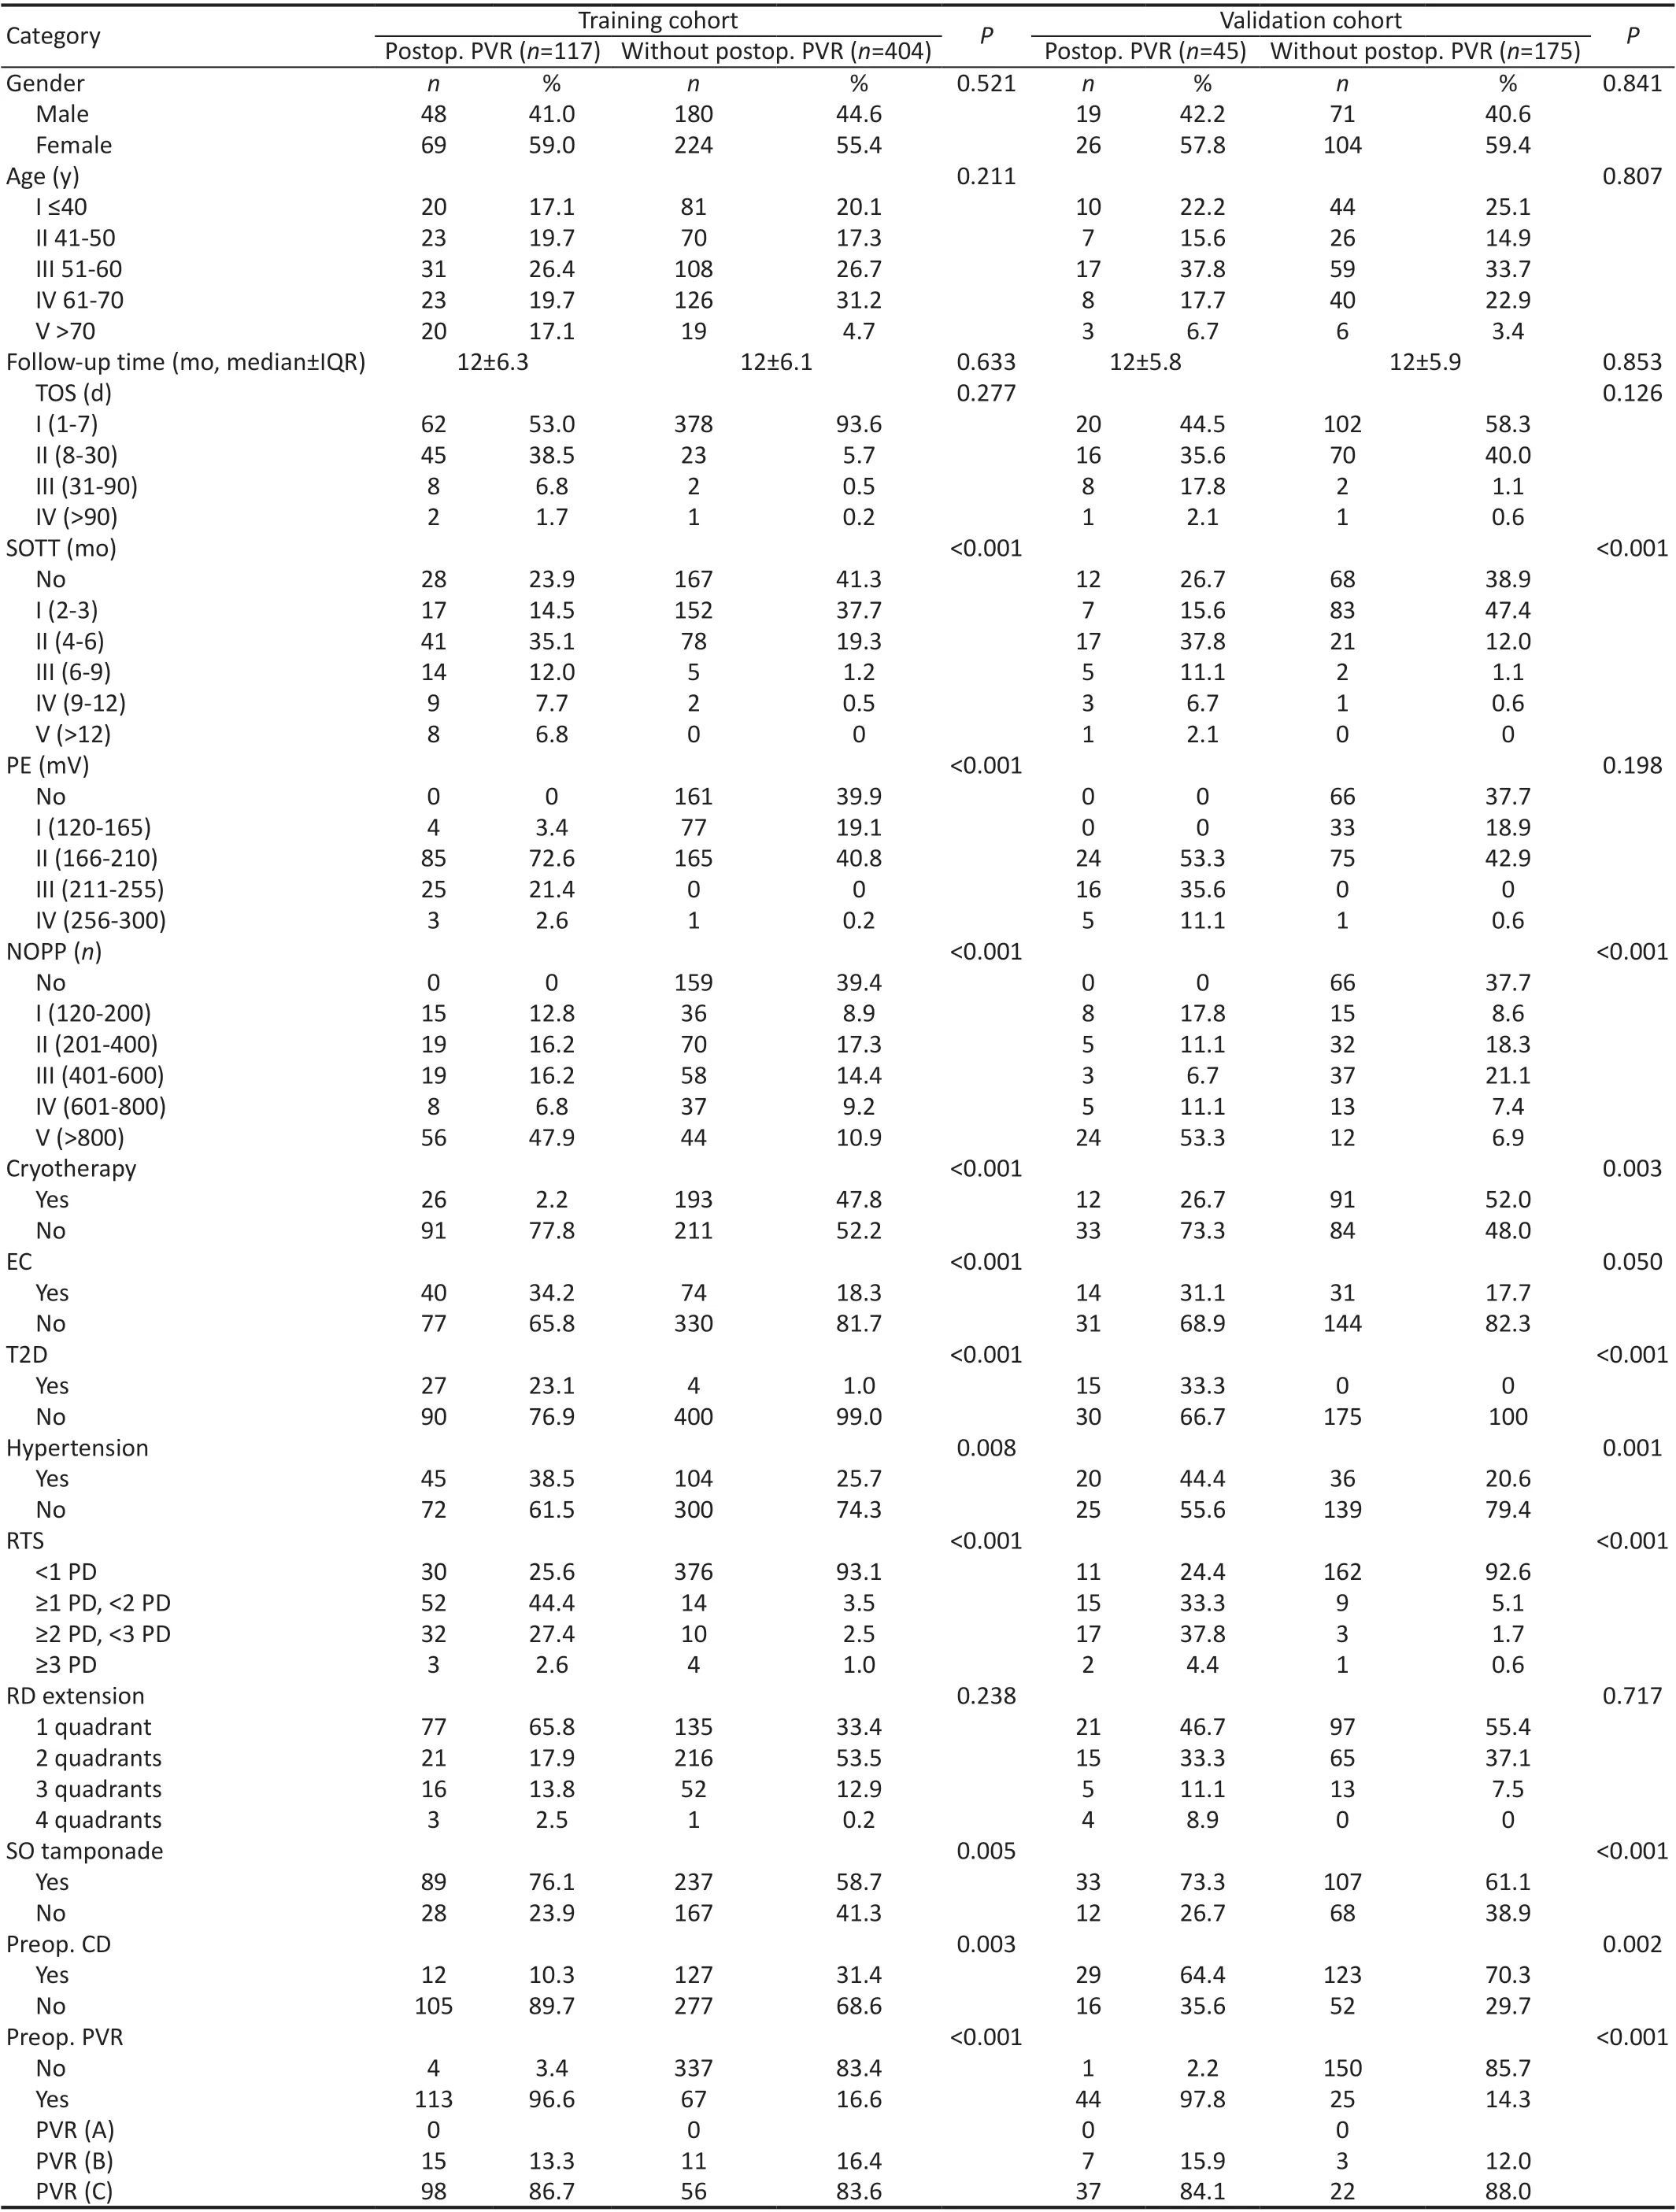
Table 2 Univariable association analyses in the training and validation cohorts
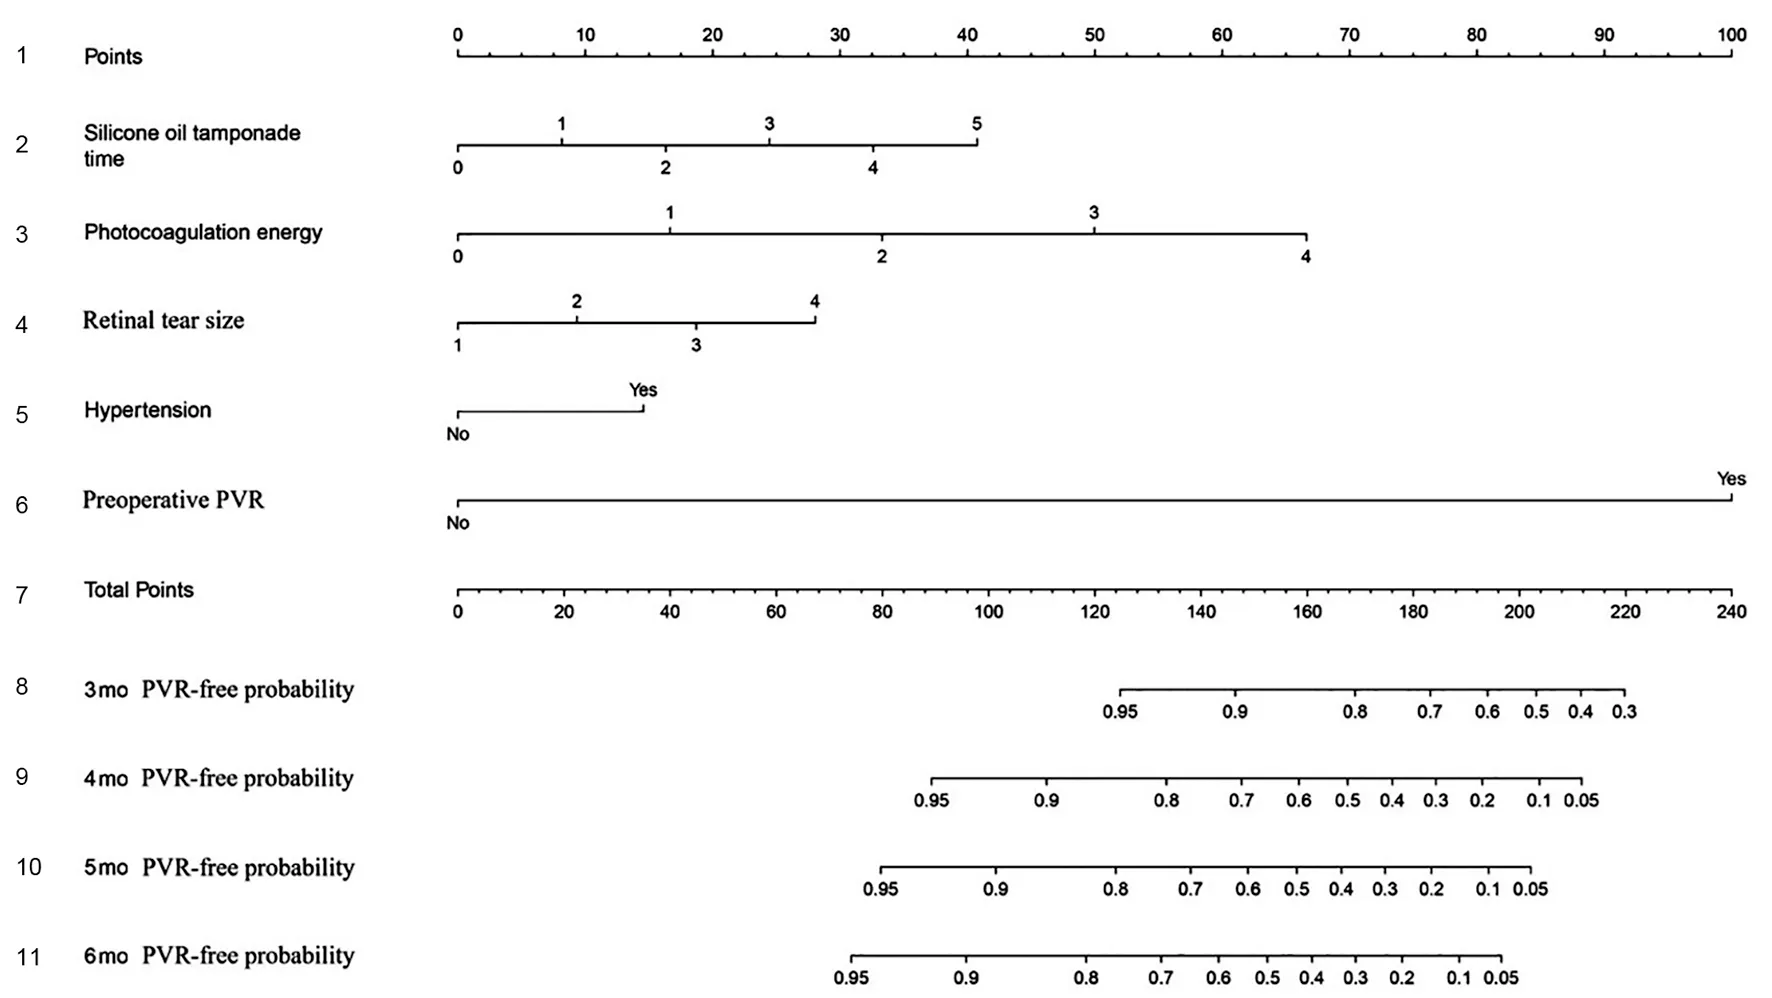
Figure 2 Nomogram predicting the 3-, 4-, 5-, and 6-month PVR-free probabilities after surgery of patients with primary RRD The row 1 shows the point assignment for each predictor. Rows 2-6 show the five predictors included in the nomogram. For each patient, each predictor is assigned a point value based on individual characteristics. The sum of these point values is located on the “Total Points” row. The rows 8-11 show the 3-, 4-, 5-, and 6-month PVR-free probabilities of patients with primary RRD after surgery. PVR: Proliferative vitreoretinopathy, RRD:Rhegmatogenous retinal detachment.
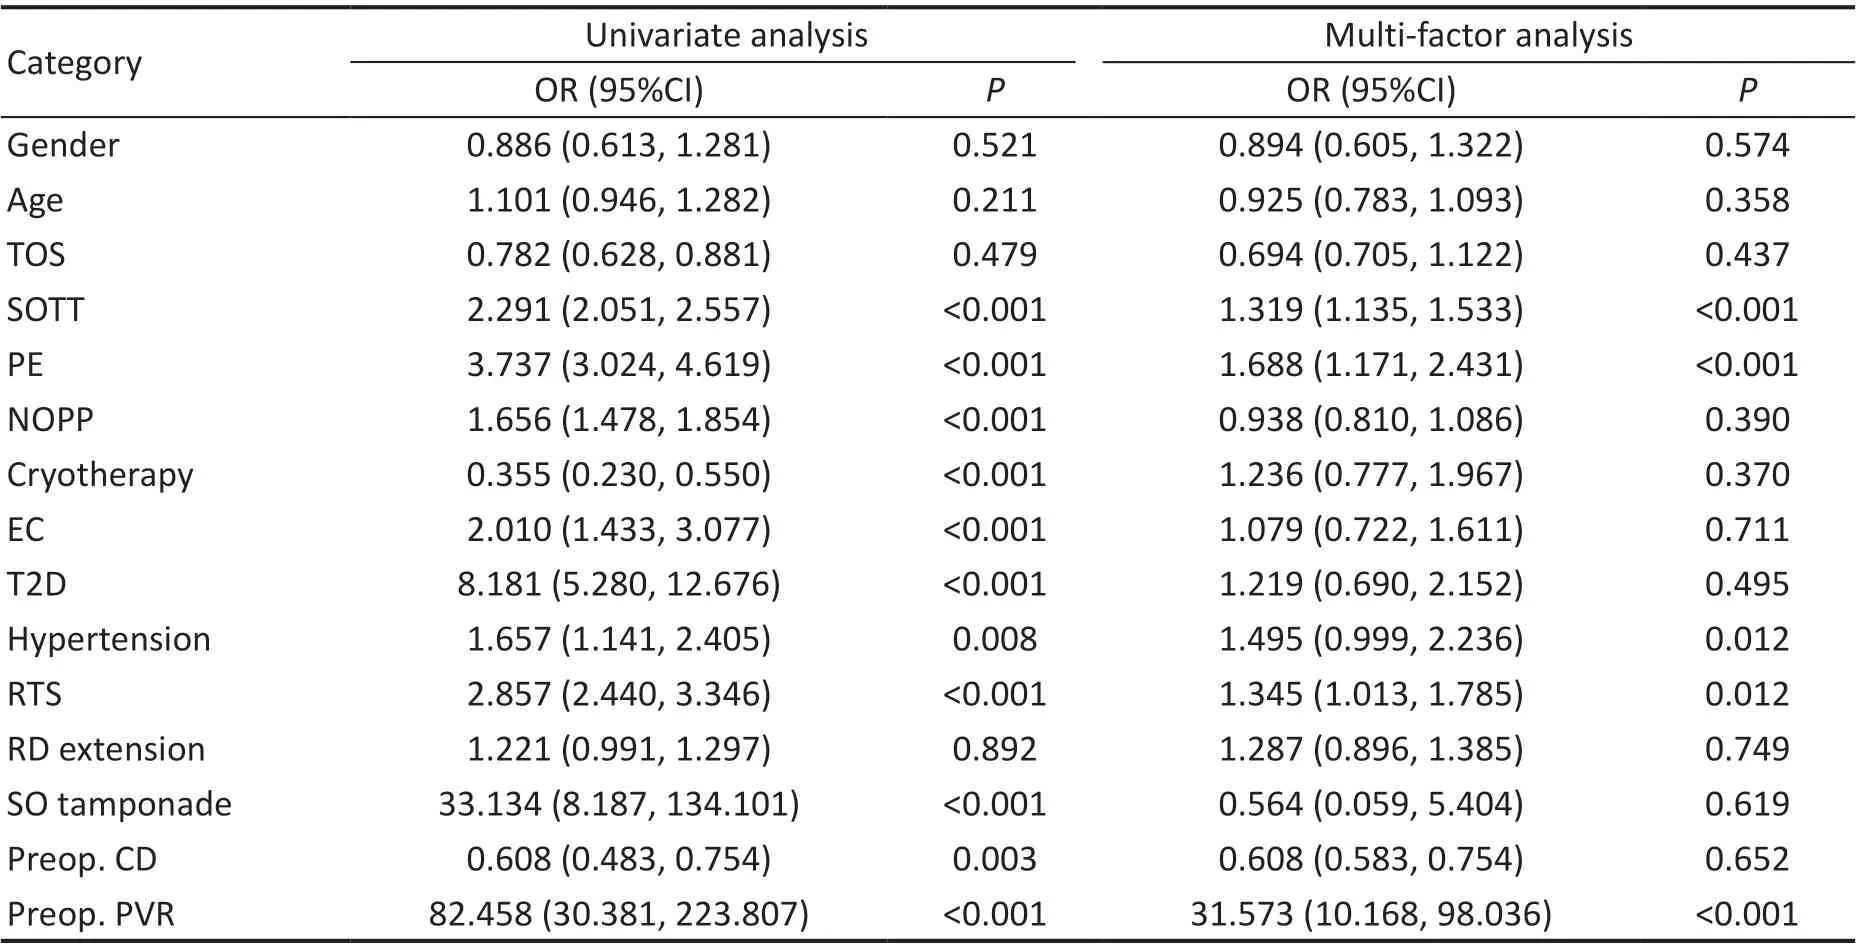
Table 3 Multivariate logistic regression analysis to identify risk factors of postoperative PVR in patients with primary RRD in training cohort
Internal and External Validation of the NomogramThe nomogram displayed good accuracy for predicting the postoperative PVR-free probability in both internal and external validation. In the training set, the C-index of the nomogram was 0.896, 0.936,0.961, and 0.972 for the 3-, 4-, 5-, and 6-month postoperative PVR-free probabilities, respectively. Additionally, the C-index values in the validation set were 0.860, 0.936, 0.951, and 0.965 for the 3-, 4-, 5-, and 6-month postoperative PVR-free probabilities, respectively (Figure 3). The calibration curves of nomogram at the different time points all indicated good agreement between the nomogram prediction and the actual observation in the validation cohort (Figure 4).

Figure 3 The ROC curves of the nomogram for the postoperative 3-, 4-, 5-, and 6-month PVR-free probability predictions of the training cohort (A) and validation cohort (B) The discrimination of the model is measured by the AUC. ROC: Receiver operating characteristic; AUC:Area under the curve.
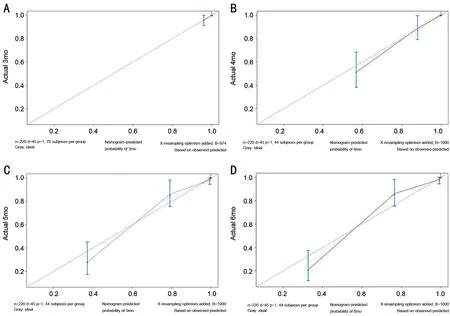
Figure 4 Calibration plots of the nomogram for the postoperative 3-, 4-, 5-, and 6-month PVR-free probability predictions in the validation cohort.
Decision-Curve AnalysisDCA of the nomogram for predicting the postoperative PVR-free probability at 3, 4, 5,and 6mo in the training and validation sets are depicted in Figure 5. The 4-, 5-, and 6-month DCA of the nomogram from the training and validation cohorts all showed significant net benefits over a large threshold probabilities interval. However,the 3-month DCA of the nomogram from the training and validation cohorts were both close to the zero net benefit horizontal line, which indicated that the nomogram at 3mo had limited value for clinical decision-making.
DISCUSSION
PVR is the most common cause of failure of RRD repositioning,which always requires further surgery and means a worse prognosis[3-4]. The development of PVR is a complex process involving inflammation and cell migration and proliferation,which has many similarities with the wound healing response[18]. A large number of previous studies have reported numerous risk factors for PVR, but their results were frequently inconsistent and contradictory, and could not accurately predict or calculate a patient’s individual postoperative PVR probability[19]. In this study, we identified risk factors for postoperative PVR in cases of primary RRD repair and established a well-calibrated prognostic nomogram to predict the PVR-free probability at different time points after surgery.

Figure 5 DCA for the nomogram in the prediction of the PVR-free probability of patients with primary RRD at the 3-, 4-, 5-, and 6-month time points after surgery in the training cohort (A) and validation cohort (B) The X-axis is the threshold probability and the Y-axis is the net benefit rate. The horizontal line indicates that all samples are negative and untreated, with zero net benefit. The oblique curve indicates that all samples are positive, and the net benefit is a backslash with a negative slope. PVR: Proliferative vitreoretinopathy; RRD: Rhegmatogenous retinal detachment; DCA: Decision-curve analysis.
To our best knowledge, the proposed nomogram is the first for predicting PVR in primary RRD patients after vitrectomy.In 2005, Pastoret al[10]devised a statistical model specifically for patients with RD repair surgery to assess the probability of PVR. Although the sensitivity and specificity of this model were higher than those of previous studies[9,11], the optimal values were still only 78.0% and 75.6%, respectively. Later,Wickhamet al[12]developed a simplified formula to predict the risk for PVR in patients with primary RD after vitrectomy using preoperative clinical data. The area under the ROC curve of this model was 0.86. However, the sensitivity and specificity of these formulas were not high enough for routine clinical use.In the present study, the C-index of the nomogram exceeded 0.9 at 4, 5, and 6mo in both the internal and external validations,demonstrating favorable discrimination. Additionally, the calibration curves confirmed the validity of the nomogram.This indicated that our innovative nomogram is reliable for predicting the 4-, 5-, and 6-month PVR-free probabilities of RRD patients after surgery.
The proposed nomogram in the present study included several independent prognostic factors—preoperative PVR, SOTT,PE, RTS, and hypertension. These factors were all identified by forward and backward stepwise selection methods in a Cox regression model. Previous studies have indicated that preoperative PVR is a significant predictor and risk factor for postoperative PVR[6,12,19-20]. For RD patients with preoperative PVR, the incidences of postoperative PVR and recurrent RD were reported to be significantly increased[21-22].Consistent with these reports, our study additionally found that preoperative PVR had the highest risk score of all the prognostic factors in the nomograms. In the present study,the incidence of postoperative PVR in the training group was 22.5%, which was higher than that previously reported[3,20].
This may be because of the higher proportion of patients(34.4%) who presented with preoperative PVR in the training group compared with previous studies[3,20]. Postoperative PVR formation may be a continuation of previous proliferative diseases. In addition, the majority of postoperative PVR were grade B (94.0%), which was less serious and did not affect the final surgical success rate.
Previous studies reported different results on whether tamponade (SO or gas) was a risk factor for PVR[11,19,23-24]. In the present study, the type of tamponade (SO or C3F8) was not associated with postoperative PVR. By contrast, multivariate analysis showed that a longer SOTT was associated with a greater incidence of postoperative PVR. Prolonged tamponade will cause SO droplets to migrate into the retina and other ocular tissues, leading to inflammation[25-26]. Furthermore, SO bubbles can occupy a large part of the vitreous cavity and may promote cell proliferation by aggregating active factors near the retina[22,27]. Moreover, a prolonged SOTT leads to a greater abundance of retinal pigment epithelial and glial cells, thus increasing the possibility of PVR formation[24]. Combined with our outcomes, we propose that SO removal at a suitable time(e.g., ≤3mo after tamponade) may reduce the risk for PVR.
Of note, we found that hypertension is also an independent risk factor for PVR, which has to our best knowledge not been reported in previous studies. Farioliet al[28]reported an association between blood pressure levels and RRD risk among non-myopic populations, but the causality has not been confirmed. How hypertension affects PVR remains unclear. We suspect that it may be related to the oxidative and inflammatory mechanisms of the excessive production of reactive oxygen species in hypertensive patients, but further verification is needed[29]. Retinal tear characteristics and excessive endolaser have been reported to be associated with PVR development in several studies[8,10,30]. Similarly, our findings demonstrated that PVR formation is positively associated with both PE and RTS.Furthermore, the risk factors included in our proposed nomogram prediction model can be readily obtained from clinical medical records. By inputting these readily accessible clinical variables into the nomogram, clinicians will be able to estimate the PVR-free probability for individual patients at postoperative 4, 5, and 6mo to assist in making clinical decisions during follow-up.
The main strengths of this study were its large sample size and is probably the first application of a nomogram to predict the PVR-free probability after primary RRD repair. There were several limitations in this study. First, the nomogram was constructed based on retrospective data from a single hospital,which might present selection bias. Second, many other factors associated with PVR, including retinal tear number, duration of the operation, intensity of retinal laser spot and pigment release during endodrainage, were not analyzed because of lack of data. Our future research will incorporate these factors.Third, a small number of patients with postoperatively lateonset PVR may have been missed because of the short followup time.
In conclusion, we identified preoperative PVR, SOTT, PE,RTS, and hypertension as risk factors associated with PVR formation. Based on the currently identified risk factors,we constructed and validated a novel nomogram to predict the PVR-free probability in patients with primary RRD at 4, 5, and 6mo after surgery. This nomogram, with its good discrimination and calibration, will be beneficial for personalized PVR prediction and facilitating clinical decisionmaking during follow-up.
ACKNOWLEDGEMENTS
We thank Liwen Bianji (Edanz) (www.liwenbianji.cn) for editing the language of a draft of this manuscript.
Conflicts of Interest: Gao ZQ,None;Wu PY,None;Zhang J,None;Ke ZS,None;Hu XT,None;Zhang ZL,None;Zheng JW,None;Zhang ZD,None;Pan QT,None.
 International Journal of Ophthalmology2023年2期
- International Journal of Ophthalmology的其它文章
- Perspectives and clinical practices of optometrists in Saudi Arabia concerning myopia in children
- Progression of myopia among undergraduate students in central China
- Flipped classroom approach to global outreach: crosscultural teaching of horizontal strabismus to Chinese ophthalmology residents
- Topical ketotifen treatment for allergic conjunctivitis: a systematic review and Meta-analysis
- Pseudomembranous conjunctivitis in a patient with DRESS syndrome
- Two cases of persistent shallow anterior chamber after cataract surgery combined with goniosynechialysis
