Computational fluid dynamics-discrete element method simulation of stirred tank reactor for graphene production
Shuaishuai Zhou, Jing Li, Kaixiang Pang, Chunxi Lu, Feng Zhu, Congzhen Qiao, Yajie Tian,,Jingwei Zhang,
1 College of Chemistry and Molecular Sciences, Henan University, Kaifeng 475004, China
2 National & Local Joint Engineering Research Center for Applied Technology of Hybrid Nanomaterials, Henan University, Kaifeng 475004, China
3 Department of State Key Laboratory of Heavy Oil Processing, China University of Petroleum, Beijing 102249, China
4 Zhejiang Luoxing Chemical Co., Ltd, Jiaxing 314001, China
Keywords:Computational fluid dynamics Discrete element method Stirred tank LPE process Liquid-particle interactions
ABSTRACT Liquid phase exfoliation(LPE)process for graphene production is usually carried out in stirred tank reactor and the interactions between the solvent and the graphite particles are important as to improve the production efficiency.In this paper, these interactions were revealed by computational fluid dynamicsdiscrete element method(CFD-DEM)method.Based on simulation results,both liquid phase flow hydrodynamics and particle motion behavior have been analyzed, which gave the general information of the multiphase flow behavior inside the stirred tank reactor as to graphene production.By calculating the threshold at the beginning of graphite exfoliation process, the shear force from the slip velocity was determined as the active force.These results can support the optimization of the graphene production process.
1.Introduction
Graphene has unique chemical,physical,and mechanical properties,which were usually produced through chemical vapor deposition(CVD)[1],oxidation-reduction reaction[2]and liquid phase mechanical exfoliation(LPE)[3].Among these protocols,LPE methods can maintain the intrinsic properties of two-dimensional graphene, thus has attracted great attention.Like each coin has two sides, in the production of graphene, the LPE method also has the disadvantages such as low production efficiency [4].The LPE method can be subdivided into five categories:(I)supersonic exfoliation[5],(II)high speed shearing[6],(III)high pressure homogenization[7],(IV)mechanical stirring[8]and(V)liquid ball milling process [9].In these processes, effective forces including normal force (changing the interlayer distance) and lateral force (sliding away), play the decisive role for the exfoliation.The minimum driving force to slide away an individual graphene layer was only one-twentieth that of changing the interlayer distance [10-12].Close investigation of these forces action on particles exfoliation probably disclose the reason for production efficiency.
The mechanical stirring method has advantages of easy scale up and low cost,which is one of the most promising LPE route for graphene large scale production.Stirred tank is the key unit of mechanical stirring LPE method for graphene production,in which the graphite is exfoliated by the shear force generated from the rotating fluid[13].The stirred tank system involved in LPE method(mechanical stirring) belongs to a typical liquid-solid multi-phase flow system.Previous studies regarding stirred tanks with liquidsolid systems mainly focused on particle suspension condition[14-16], flow hydrodynamics [17-19], particle motion behaviors[20-22] and fluid energy dissipation phenomenon [23-28].As to the multi-phase flow behavior inside the stirred tank, it can be divided into the radial flow and the axial flow according to the different structure of the impeller [29,30].Besides, the turbulence behavior inside the stirred tank reactor is difficult.To investigate the turbulent flow behavior inside stirred tank reactor,experimental methods have gradually evolved from the initial hot wire anemometer to the current particle imaging technology (PIV) and laser Doppler anemometer (LDV) [31,32].However, these experimental method are expensive both in operational and equipment investigation and the experimental results are also discontinuous.
With the development of computer technology, computational fluid dynamics (CFD) has been applied in the prediction of the complex flow behavior turbulent flow field in a stirred tank [33-36].The accuracy and the computational cost of simulation process are affected by the scale in which the interactions are simulated and three different scales exist: macroscopic scale, microscopic scale and mesoscopic scale [37].For the multiphase system investigated in this paper,each phase can be solved on its own scale.The Euler-Euler approach is a meso-meso scale strategy,which generally adopts the two-fluid model and have been carried out on multiphase system.The other method calling Euler-Lagrange approach, is a microscopic approach to study particles while resolving the fluid with different scales, which takes the motion of each particle into consideration (microscopic scale).Computational fluid dynamics-discrete element method (CFD-DEM)method is based on this approach, which combines CFD for fluid mechanics and DEM for granular dynamics, including resolved CFD-DEM and unresolved CFD-DEM [38].In this paper, the resolved CFD-DEM method is adopted to investigate the interactions between the liquid and the particles.
One of the most important issues in modeling multiphase interactions inside stirred tank reactor is the rotation of the impeller[39,40].Three methods are proposed to solve the rotation of the impeller: multiple reference frame method (MRF) [41], sliding mesh method [42] and immersed boundary method [43].The MRF method are composed of Lagrangian frame in rotation and Eulerian frame of reference in stator.The sliding mesh approach is generally used for unsteady state investigations coupling by an interpolation of the information at their interface to ensure the conservation of the flux, but which faces low interpolation accuracy by small gaps between the rotor and the stator.Immersed boundary method does not require a body fitted mesh of the geometry, which includes the discrete and the continuous one.For this method,significant local mesh refinement is required over the volume swept by the impeller,which can lead to a considerable number of cells and thus high computational costs.
This work aims at LPE process for graphene production.MRF method and sliding mesh method is used to simulate the steady state rotation and the transient state rotation in the stirred tank reactor, respectively.The general flow behavior and the interactions of the stirred tank reactor were given through CFD-DEM simulation.
2.Experimental
2.1.Mathematical model and numerical simulations
The fluid adopted for liquid phase exfoliation is N-methylpyrrolidone (NMP).A three-dimensional stirred reactor constructed by Plexiglas for convenient viewing was used in the experiment.The geometry of the apparatus was depicted in Fig.S1 (in Supplementary Material).The stirred tank located right below the agitator and the OS20-pro agitator was manufactured by DRAGONLAB Company (China).The rotational speed ranged from 50 to 2200 r·min-1.The tank internal diameter (ID) and height are 100 mm and 180 mm, respectively.The impeller adopted has six standard blades with a size of 18 mm × 33 mm.These blades are evenly distributed along the circumferential direction of a plate,which mounted at the end of the axis.The distance between the blades and the bottom of the reactor is adjustable.Different from previous reports, the solid phase investigated in this paper is composed by numbers of rectangular two-dimensional particles.Fig.S2 is the scanning electron microscopy picture of the graphite.The graphite particles belong to two-dimensional particles.The movement of two-dimensional particles in the stirred tank reactor is different from the spherical particles.In that case.In this paper,to investigate the motion behavior of the two-dimensional graphite particles in the stirred tank reactor, the model particles are adopted.The graphite sheet, whose dimension is presented in Fig.S3, is described by multi-spherical elements.
The heterogeneous liquid-solid system in the stirred reactor for graphene production is described mathematically based on Euler-Lagrange theorem.The liquid phase can be treated as the continuous phase, while the solid phase is modeled by discrete element method (DEM).
2.2.Mathematical model for fluid
The motion behavior and the forces acting on single particle are important for determination of the exfoliation.In this study, NMP is a typical non-Newtonian fluid,which is adopted to calculate the fluid viscosity.
where μLis the viscosity of NMP,Pa·s;Kpis the viscosity coefficient;n is fluid rheology index.The value of Kpand n are determined through rheology experiments.The flow behavior of NMP in stirred tank reactor is described by continuity equations.A momentum equation is also solved,where the stresses are closed using the realizable k-ε model.
2.2.1.Governing equations for fluid
Continuity equation, turbulence model and the momentum equation are the governing equations for the liquid-phase flow.The details of these equations are as follows
Continuity equation:
Momentum balance equation:
where S represents the interaction between the particles and the liquid phase and will be detailed in the following section.In this paper, the realizable k-ε turbulence model was chosen to simulate the turbulent flow behavior inside the stirred reactor, the corresponding correlations are listed as follows
2.2.2.Mathematical model for the particles
The motions of the two-dimensional particles in the stirred reactor consist of translational motion and rotational motion.The translational motion of a particle originate from the sum of the forces acting on it, while the rotational motion originate from the contact torques.
The equations governing the translational motion is as follows
The equations governing the rotational motion is as follows
where FD, FMand Fbare drag force, Magnus force and buoyancy force,respectively.These forces stem from the interaction between liquid and solid.Besides, the forces acting on particle stem from particle-particle, particle-wall and particle-impeller collisions is accounted by multi-sphere method [44].The rectangular twodimension particles adopted in this paper is modeled as many small sphere particles and the forces stem from collisions can be obtained through analysis of the sphere particles.Different number and arrangement of them give different non-spherical particles.The equations for the prediction of the mass, gravity center and inertia tensor of the non-spherical particles are as follows
where N is the number of the sphere particles used to model the non-sphere particles, mik, Oikand Iikare the mass, gravity center and rotational inertia respectively, xik, yikand zikare the distance from the corresponding axis.
The forces acting on single sphere particle stem from the collisions are to be investigated.As depicted in Fig.1, the forces acting on single sphere particle can be divided into two groups, forces stem from the particle-particle collisions and forces stem from the particle-wall collision.For particle-particle collisions,the contact forces and torques are modeled by the classical Hertz-Mindlin model [45,46].
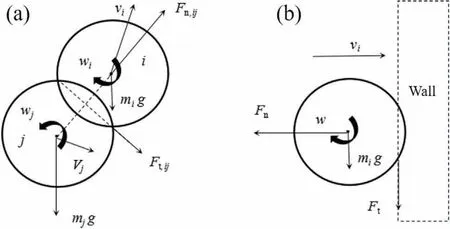
Fig.1.Forces acting on single sphere particles stem from collisions: (a) particleparticle, (b) particle-wall.
The resulting force inertia are calculated by the following equations
(i) The particle-wall and particle-impeller collisions
The particle-wall and particle impeller collisions can be described by the model in particle-particle collisions.While, the time-step for DEM simulation should be set at a suitable value to ensure every movement of the impeller.The time-step for DEM simulation is 1.5 × 10⁻⁶s and the maximum impeller movement at its tip in a DEM time-step is about 5 × 10⁻⁶m, which is much less than the particle diameter, so the simulation precision can be ensured with the physical model.
(ii) Interaction between liquid and particles
The interaction between liquid and particles is represented by momentum sink S, which is a volumetric summation of the forces between the liquid and particles.The momentum sink is composed by buoyant force (Fb), drag force (FD) and the Magnus force (FM).
(iii) Drag force For the liquid-solid system investigated in this paper,the resistance offered by the liquid is called drag force when the particles move through it.The drag for acts in a direction opposite to the particles motion and generated by the relative velocity between the solid object and the fluid.Whether the object or fluid is moving, drag occurs as long as a difference in their velocities.For the liquid-solid system, the Di Felice drag model is adopted for the prediction of the drag force for the graphite particle are described by multi-sphere model [47].This model adds a correction term to the free stream drag model,thus considerring the effects of neighboring particles on the drag force.The model is formulated as
(iv) Magnus force
The Magnus force originates from the spinning motion of the particle in the fluid, and the direction is perpendicular to the motion line.The Magnus force is calculated as [48,49]
2.3.Numerical method
To obtain the flow behavior of fluid and particles simultaneously, the CFD-DEM coupled method was adopted.In the CFDDEM coupled approach, FLUENT 19 and EDEM 19 are successfully coupled.The equations of liquid flow are solved using FLUENT,while the equations of DEM model are solved by EDEM.
To simulate the rotational motion of the impeller,the algorithm of multiple reference frames is applied.The regions around the impeller are simulated in a rotating frame of reference, while the other regions in the tank are applied with a stationary frame of reference.The no slip condition is applied at the tank wall and the impeller, and the free slip condition is adopted for the liquid surface.In each case, the single-phase flow is simulated without particles for 5 s to reach the steady state.Then particles are introduced to the whole tank randomly,and the time releasing the first particle is considered as t=0.From t=0 to 0.005 s,the particles are continuously released to the whole tank.The simulated system is a flat-bottom Rushton turbine tank with equal liquid height of 90 mm, standard pressure and temperature.The simulations are conducted in a 3D domain and the vessel geometry was meshed with 616813 cells as illustrated in Fig.2.
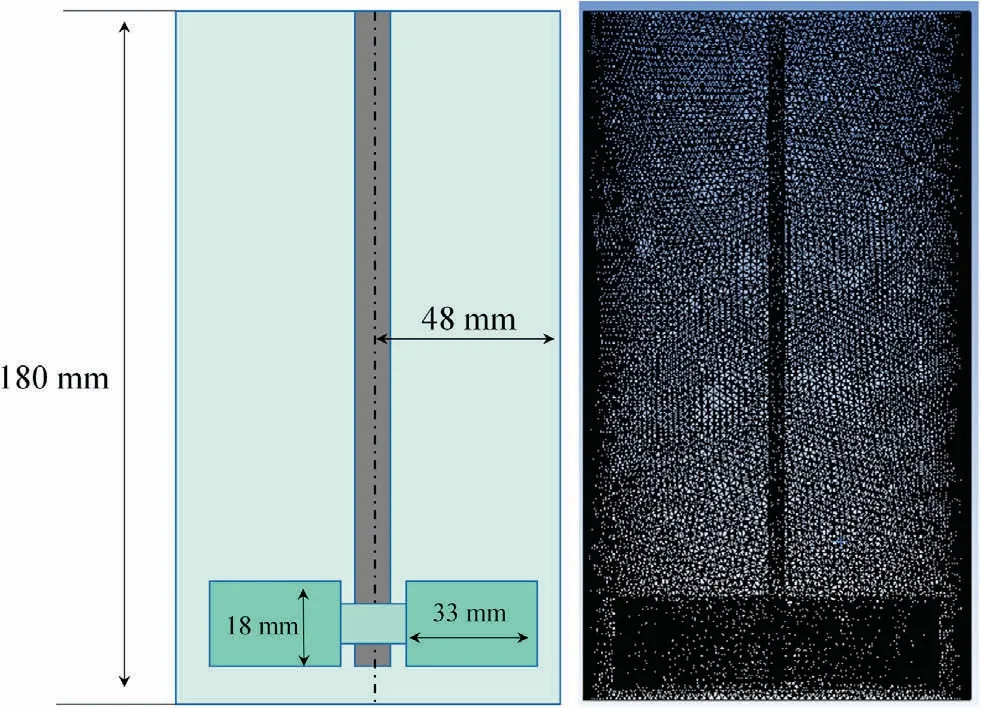
Fig.2.Dimensions and grids of the stirred tank reactor.
2.4.Computational conditions
The DEM time-step τDEMis determined by the Rayleigh time step and all the energy is Rayleigh waves [50].The Rayleigh time step,defined as the time for a DEM simulation of a quasi-static particulate collection in which the coordination number(total number of contacts per particle)for each particle remains above 1,is calculated as [51]
τDEMis set as 1.5×10⁻⁶s(15%τR).The time-step in FLUENT is set as 100 times of τDEM.The continuum model and momentum equations of liquid are solved by SIMPLEC and second-order implicit time integration method respectively.The convergence criteria is the iteration error less than 10-6.In DEM simulation, the explicit time integration method is adopted to solve the motions of the particles.The physical properties of dilute particles and the liquid employed in the simulation and the simulation parameters, if not mentioned in particular, are the same as those listed in Table 1.
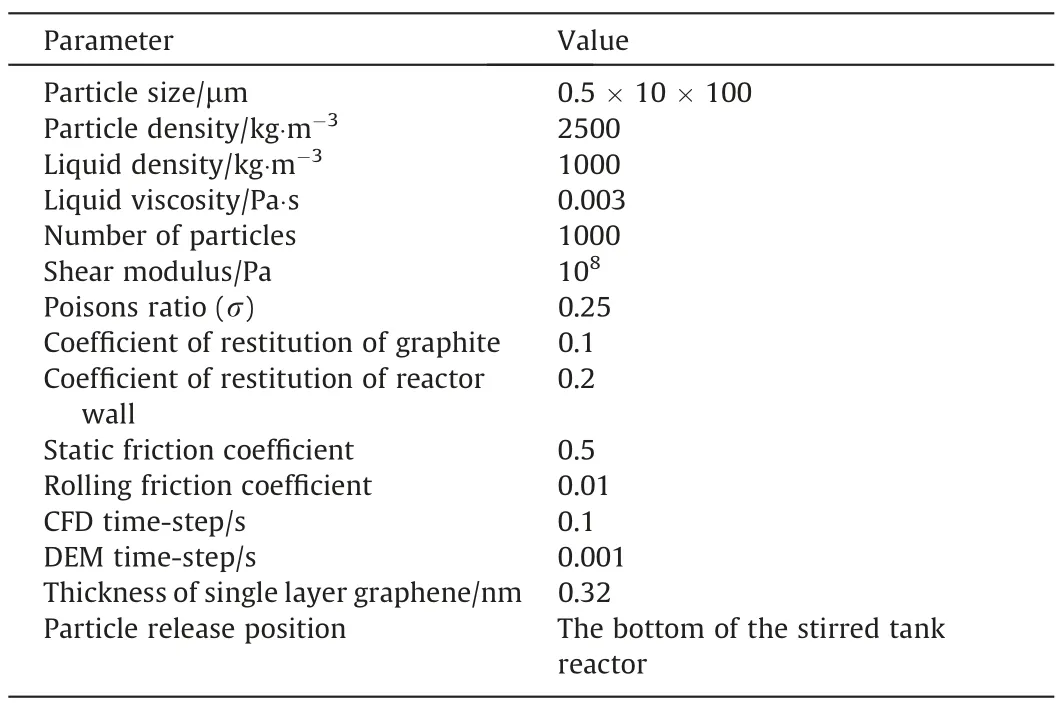
Table 1 Physical properties and simulation parameters
3.Results and Discussion
3.1.Validation of CFD simulations
In this paper, the variable used to verify the model is the position of the gas-liquid interface.The position of the gas-liquid interface climbs along the reactor wall as the impeller rotation speed increasing, which results from the balance between the gravity force and centrifugal force act on the liquid.During the experiment,the position of the gas-liquid interface was registered by camera.
The tank was filled with NMP liquid and the liquid take half of the total space.Before registering the position of the gas-liquid inter-surface, the stirred tank was running for one minutes, after which the gas-liquid surface become steady.Fig.3(a) is the position of the gas-liquid inter-surface.The NMP is colorless, which make it hard to capture the position of the gas-liquid intersurface.Copper (II) sulfate pentahydrate (Kermel, AR) was used to highlight the inter-surface inside the stirred tank.
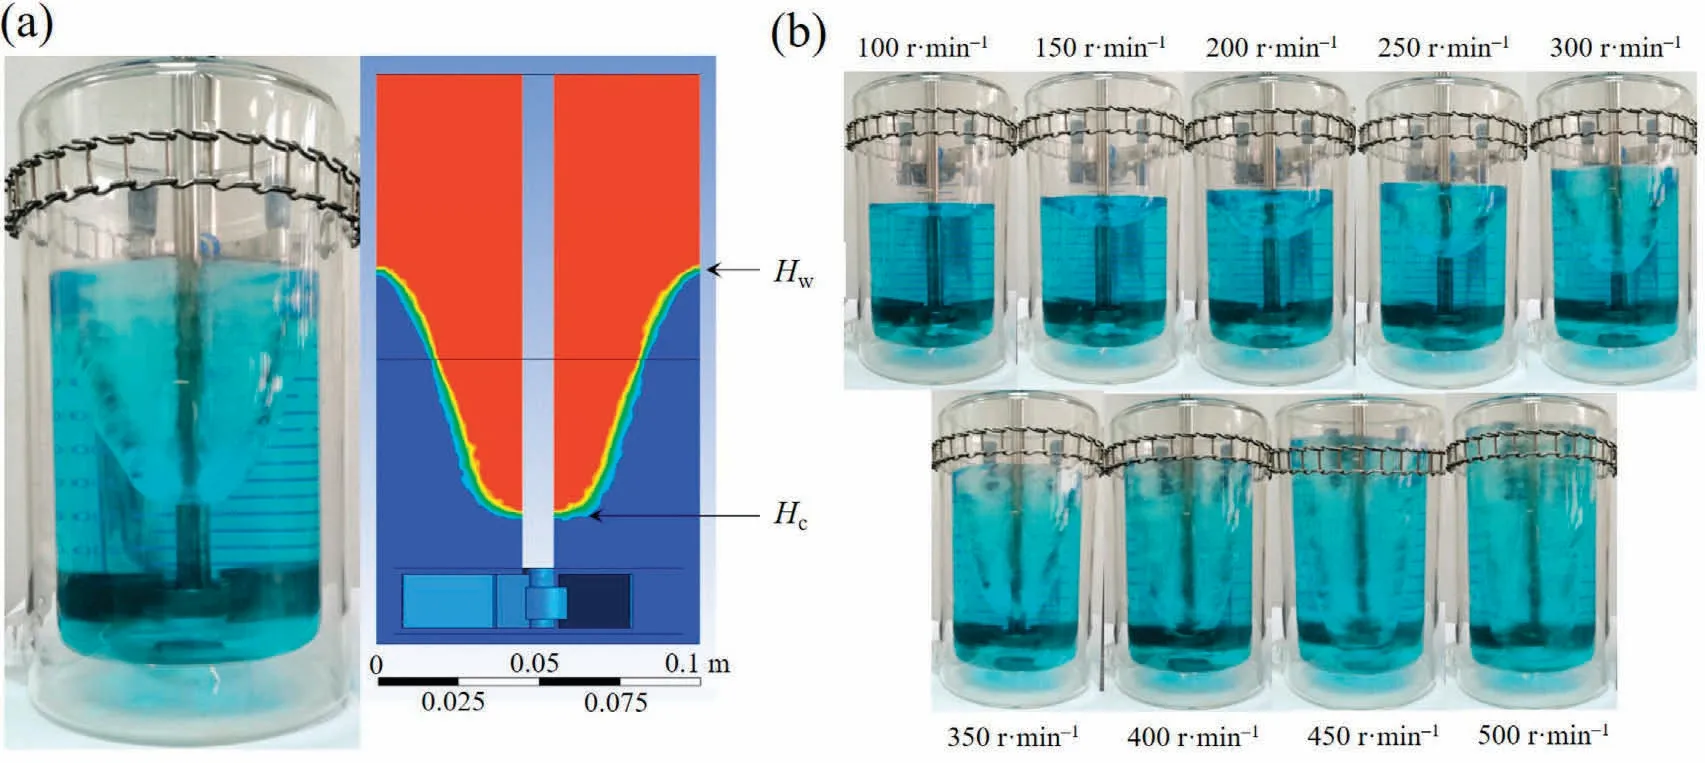
Fig.3.(a) Comparison between experimental and simulation results of the inter-surface; (b) Experimental results of the inter-surface under different rotating speed.
The inter-surface is presented as parabolic curve,which results from the forces balance among gravity force, centrifugal force and pressure force from the reactor wall.The height of the gas-liquid inter-surface has the peak value near the reactor wall and the valley value at the axis of the reactor, which is denoted Hwand Hc,respectively.Fig.3(a) compares the simulation results and experimental results of the gas-liquid inter-surface.The simulation curve of the gas-liquid inter-surface is similar as the experimental one.
Fig.3(b) is the variation of inter-surface with different rotating speed.The liquid climbs along the reactor wall as the rotating speed increases.In the region near the axis, the liquid surface moves downward as the rotating speed increases.This result implies that the energy input into the stirred tank system is partly consumed to elevate the liquid potential energy.On the other side,the inter-surface becomes blurred as the rotating speed increases,which probably results from the turbulent movement of the fluid.When the rotating speed reached 500 r·min-1, the liquid almost over-fills the stirred tank.So, the rotating speed is kept under 500 r·min-1in this paper.
Simulation process was also carried out to predict the intersurface under different rotating speed.Both the experimental and simulation results of the position of gas-liquid inter-surface under different operating conditions are listed in Table 2.Comparison between experimental results and simulation results indicate that the CFD model is suitable to predict the flow hydrodynamics of the gas-liquid flow in the stirred tank reactor.In that case, the CFD model is used to describe the flow behavior of liquid phase in the stirred tank reactor for graphene production.

Table 2 Comparison between experimental and simulated height of the gas-liquid inter-surface
3.2.CFD-DEM simulation
The calculation framework for the liquid phase is based on the Euler model.The calculation framework for the particle phase is based on the Lagrange model without consideration of the particle volume fraction.The rotating speed is kept at 400 r·min-1.Figs.4 and 5 is liquid phase velocity distribution from axial and radial cross-section in stirred tank reactor,respectively.Fig.4 shows that the liquid phase velocity is higher in the region near the blades,which ranges from 1.3 to 1.6 m·s-1.In the region near agitator shaft,the liquid phase velocity is almost zero.As the radial position moves away from the agitator shaft,the liquid phase velocity gradually increases.When the radial position approaches the reactor wall, the liquid phase velocity decreases again.This possibly results from the non-slip boundary condition assumption in the CFD model.Fig.5 shows that the liquid velocity distribution has valley value in region near the agitator shaft for all radial crosssections.In cross-section of z=20 mm,the liquid velocity has peak value near the edge of the stirring blades.In cross-section from z = 30 mm to z = 60 mm, the liquid velocity distribution changes to concentric circles shape, which indicates laminar flow occurs in these regions.
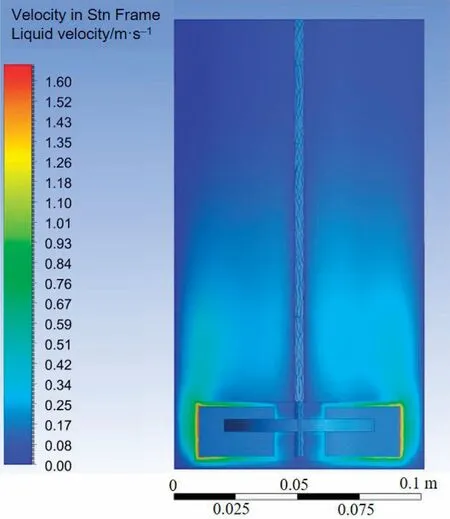
Fig.4.Velocity contour of liquid phase across axial cross-section of stirred tank reactor.
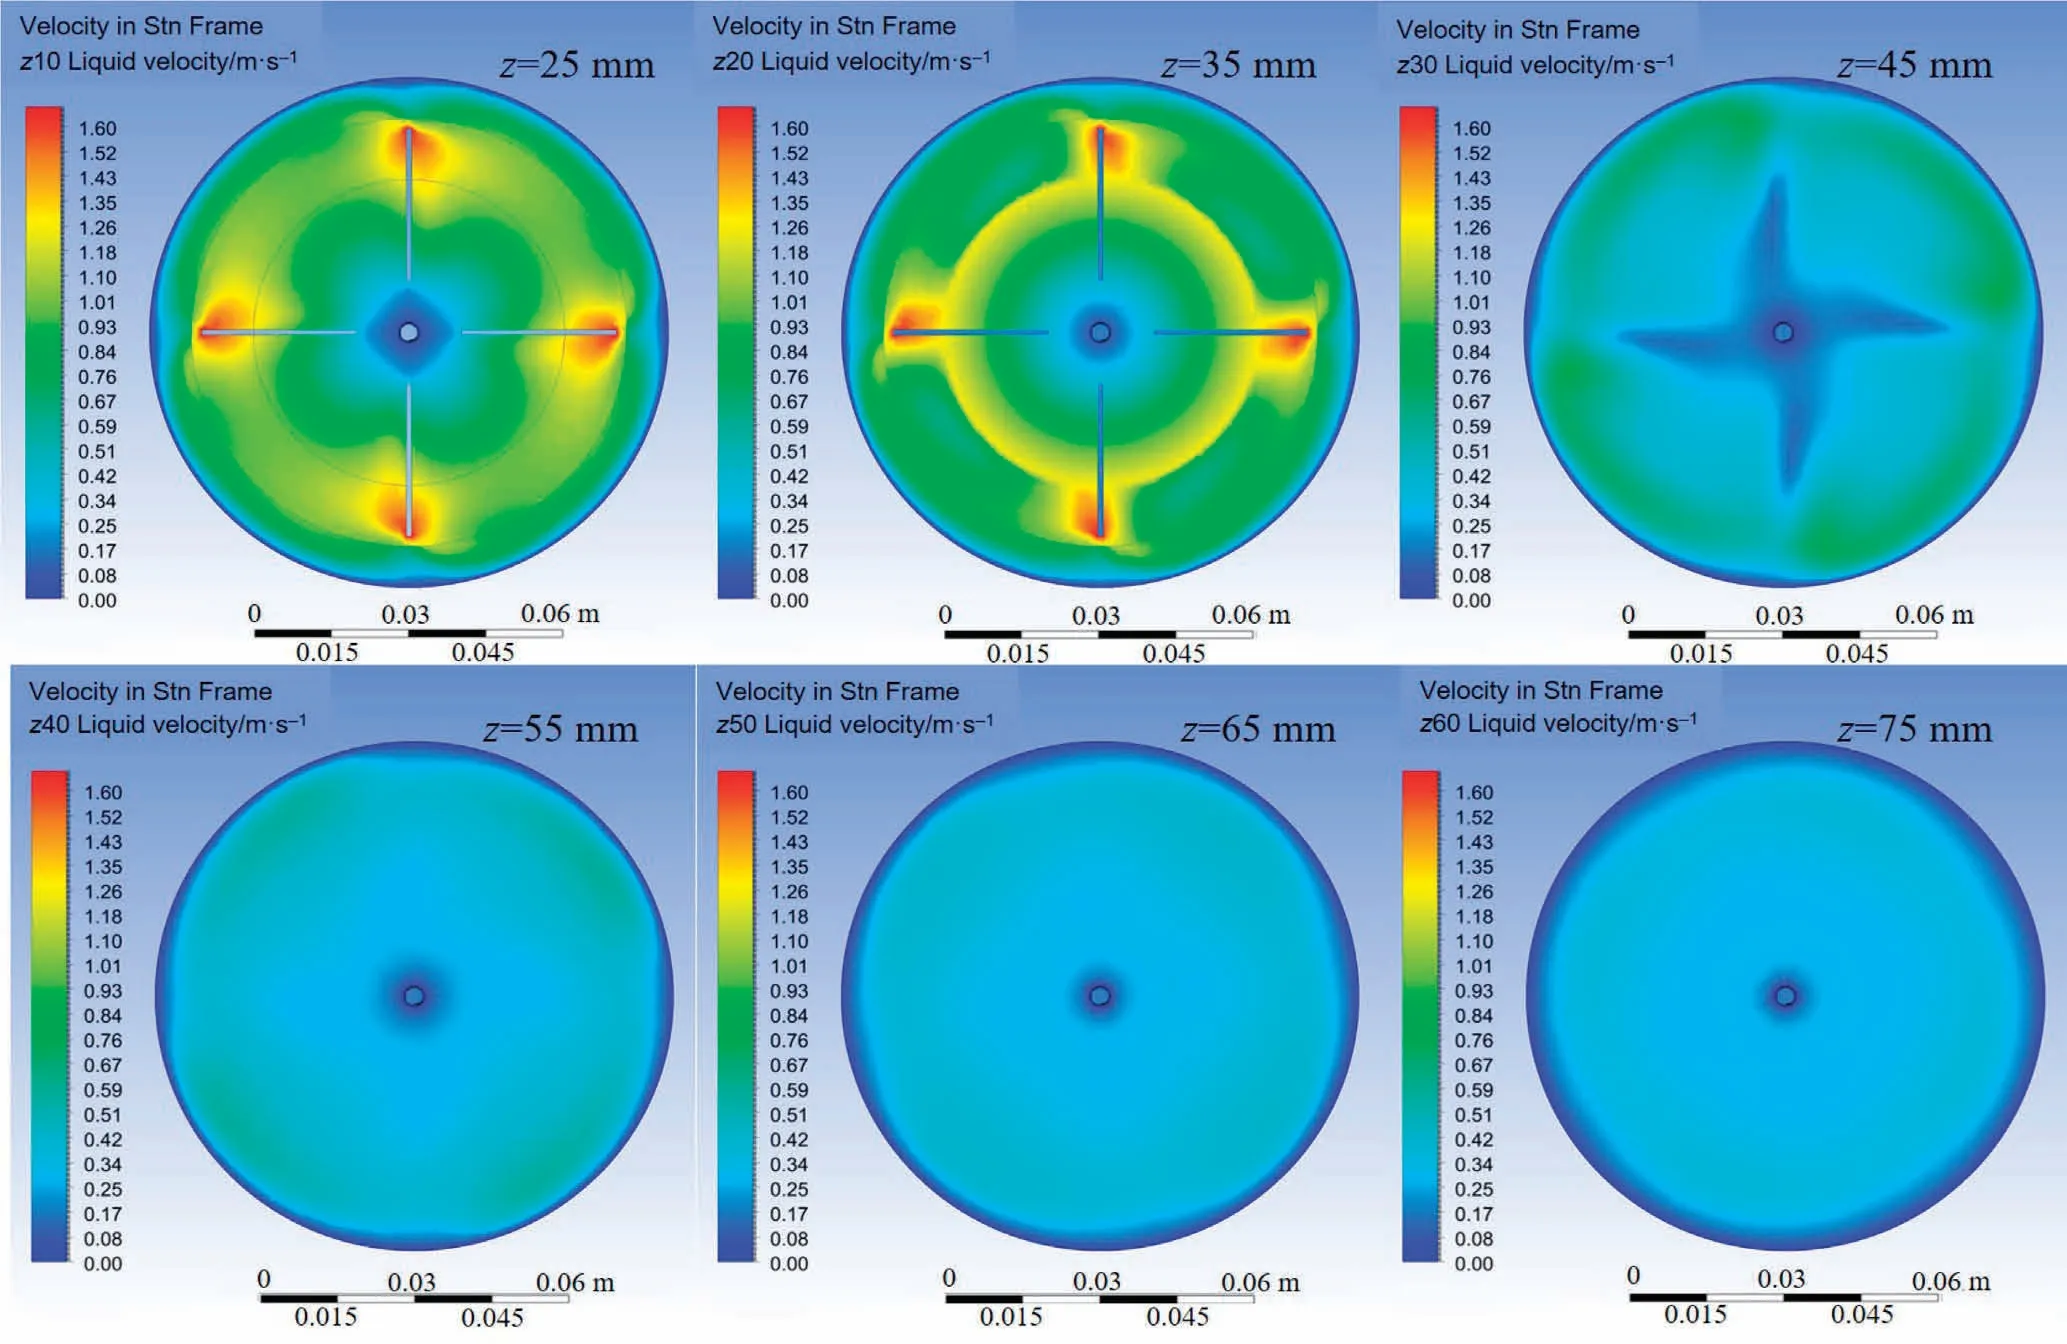
Fig.5.Velocity contour of liquid phase across radial cross-section.
The flow behavior of the liquid in the stirred tank is calculated by FLUENT.The flow behavior refers to the velocity and shear force distribution in the stirred tank.From the distribution of the liquid velocity, flow patterns across the stirred tank can be determined.The shear force is another important variable for graphene liquid mechanical exfoliation, which is closely related to the breakage of the graphite.Information about the shear force distribution is the basis for optimal design of the stirred reactor.The liquid flow behavior is quantified by the velocity distribution and shear force distribution along the reactor.The specific analysis is as follows.
3.2.1.Shear force distribution
(i) Viscosity shear force In the process of graphite exfoliation, the exfoliation efficiency mainly depends on the shear force.According to the law of viscous shear,the formula for calculating the shear force in the liquid-solid two-phase system is as follows:
where μLis the viscosity of the fluid; du/dr is the velocity gradient perpendicular to flow direction.The fluid used in this article is a non-Newtonian fluid, and its viscosity changes with the state of motion.It is impossible to investigate the influence of a single variable such as viscosity and velocity gradient (shear rate) on shear force.Therefore,this paper directly calculates the shear force distribution through CFD-Post software by defining variable.
Fig.6(a)gives the shear rate axial distribution within the stirred tank reactor, which showed that shear rate strengthened in the region near the stirring blades and the reactor wall.In the rest of the region within the stirred tank,the shear rate is of almost zero.This result is ascribed to the large velocity gradients in the region near the stirring blades and the reactor wall.In order to achieve a higher exfoliation efficiency of the graphite, the graphite particles are expected to distribute in the region near the stirring blades and the reactor wall as much as possible.
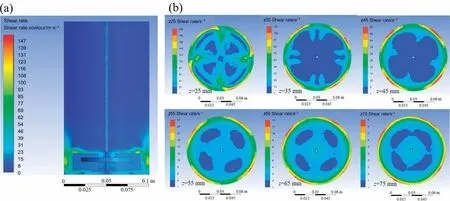
Fig.6.(a) Shear rate contour along axial cross-section; (b) Shear rate contour along different radial cross-sections.
Fig.6(b) gives the shear rate distribution along radial crosssection within the stirred tank reactor.It shows that the shear rate enhances in the region near the edge of stirring blades and the reactor wall(z=25 mm).The uniformity of the shear rate distribution along the radial cross-section gradually increases as the axial position elevated, while the value of the shear rate gradually decreases.When the axial position increases from z = 25 mm to z=45 mm,the high shear rate region gradually disappears,and the corresponding low shear rate region begins to dominate.As the axial position increases from z=45 mm to z=75 mm,the distribution of shear rates along the radial cross-section becomes uniform,and the low-shear region begins to dominate.These results indicate that the shear rate is higher in the region close to the blades and lower in the region away from the blades.Therefore, in order to ensure high graphite exfoliation efficiency, particles should be located in the region close to the blades.
(ii) Turbulent shear force
The shear force exerted by the turbulence motion can be calculated by
where μtis the turbulent viscosity resulted from the motion of the eddies.
Fig.S4 is the turbulence viscosity distribution in the stirred tank reactor along axial direction.The turbulence viscosity is enhanced in the region near the stirring blades and right above the stirring blades where the fluid motion circling.The turbulence viscosity ranges from 0 to 0.093 Pa·s, which is around 60 times of the molecular viscosity of NMP.This indicates the turbulence shear force is around 60 times of the molecular viscosity shear force.
3.2.2.Particle motion behavior
The particle motion behavior mainly composed of particle concentration distribution,particle movement trajectory and the variation of the forces acting on the particles.The particle concentration distribution is shown in Fig.7,in which the snapshot of the particle distribution is viewed from the bottom.The particles may exist at any radial or axial positions inside the stirred tank reactor.The blue color represents the particles and the gray color represents the volume of the stirred tank.The particle concentration distribution varies with the stirring time.As the stirring time increases, the particle concentration radial distribution periodically changes from uniform to nonuniform and verse versa.This results from the radial movement of the graphite particles.Along radial direction, the movement of the graphite particles controls by the forces acting on it, which are centrifugal force and press force of the reactor wall.The centrifugal force make the graphite particles move toward the reactor wall.When the graphite particles approache the reactor wall,the movement direction of the graphite particles are changed by the press force of the reactor wall.In that case, the graphite particle moves backwardly to the agitator shaft.This process makes the graphite particles distribution periodically vary with the stirring time.
Fig.8 is the particle distribution along axial direction within the stirred tank reactor.With the stirring time increasing,the graphite particles gradually fill up the stirred tank reactor.From t=0.01 s to t = 0.17 s, the graphite particles move downward, which probably results from the gravity force domination.From t = 0.17 s to t = 1.09 s, the graphite particles move upward, which probably results from the buoyant force domination.After t = 1.09 s, the movement of graphite particles along axial direction disappears when the gravity force equals the buoyant force.This phenomenon indicates the particles distribution reaches balanced state.The movement along radial and circumferential direction make the graphite particles presents within the stirred tank reactor periodically,which guarantees even distribution of the graphite particles.This result is not favored for graphite exfoliation, since the shear force only strengthened in the region near the stirring blades.The mismatch between the particle concentration distribution and the shear force distribution deteriorates the exfoliation efficiency.The particles distribution is affected by the properties of the fluid,the structure of the stirred tank and operating conditions.In that case,to increase the exfoliation efficiency,the coordination mechanism among these variables are to be determined, which will be reported in our future work.
Fig.9 illustrates the movement trajectory of a graphite particle.The variation of the color indicates different space position within the stirred tank reactor.The graphite particle moves around radial,circumferential and axial direction periodically.Along axial direction, the particle move upward in the first half period and move downward in the second half period.Along radial direction, the particle move toward to the stirring shaft in the first half period and toward the reactor wall in the second half period, which is probably ascribed the initial position of the selected graphite particle.Along circumferential direction, the particle movement trajectory is as a circle.The combination of these three movements make the trajectory of graphite particle is in spiral shape.The particles do not always stay in one particular region inside the stirred tank reactor.In fact, for graphite exfoliation, the particles stay in the region near the stirring blades and the reactor wall is desirable,where the shear force strengthened.
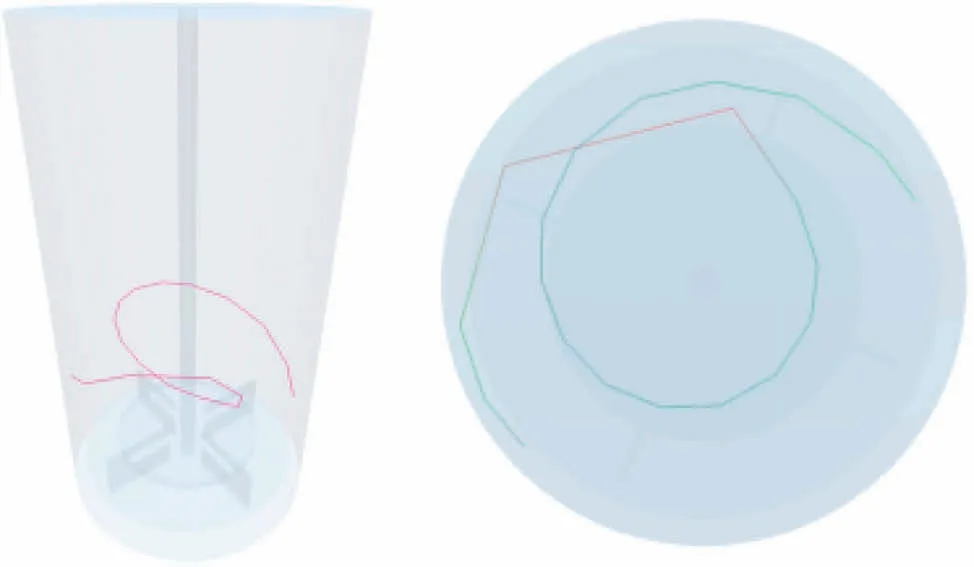
Fig.9.Movement trajectory of a graphite particle.
The macro scale motion of the particle determines the particle concentration distribution inside the stirred tank reactor.Moreover, the motion behavior of graphite particle indicates the collision between the particle and the reactor wall or stirring blades probably be the action for the starting of the exfoliation process.Thus, further investigation of the forces acting on single particle is important as to the determination of the active forces for graphene exfoliation.
3.2.3.Forces acting on single particle
The forces acting on single particle inside the stirred tank reactor include gravity force,drag force,shear force,and pressure force.In these forces, the pressure force (from the collision between the particle and the reactor wall/blades) and the shear force are most likely as the active forces for graphene exfoliation process.The following contents focus on the analysis of these two forces.Firstly,the threshold for the beginning of graphene exfoliation process is calculated.
(i) Threshold for the beginning of graphite exfoliation
The exfoliation happens when the shear force beyond the threshold.The shear force required for solvent exfoliation of graphene from graphite by molecular simulation [10] is calculated as
where Psis the shear force per unit area and equals to 4×10⁸N·m-2[10];S is the contact area between the solvent and the particle.The contact area S is calculated as
where w is the width of the graphite pellet and l is length of the graphite pellet.The calculated shear force thresholds vary with the variation of the graphite particle dimensions.For graphite particles with different dimensions,the calculated shear force required at the beginning of exfoliation are listed in Table 3.The variation of shear force threshold indicates the exfoliation process occurs more easily for small graphite particles.

Table 3 Shear force thresholds with different contact area
(ii) Pressure forces from the collisions
For single particle inside the stirred tank reactor, the pressure force from the collisions can be reflected by the total force from EDEM.Fig.10 gives the pressure forces from the collisions between the particle and the reactor wall or stirring blades with particle dimensions of 50 μm × 2000 μm.It shows that the total force is almost reaching zero during most of the interested time span.Only one main peak exists around time t = 0.75 s during the time span,which is the action from the collisions between the particle and the reactor wall or the stirring blades.The peak value is around 0.12 N,which is far less than the calculated shear force threshold for particle with dimensions of 50 μm × 2000 μm.Based on this results,the pressure force from the collisions probably be not the active force at the beginning of the graphite exfoliation.
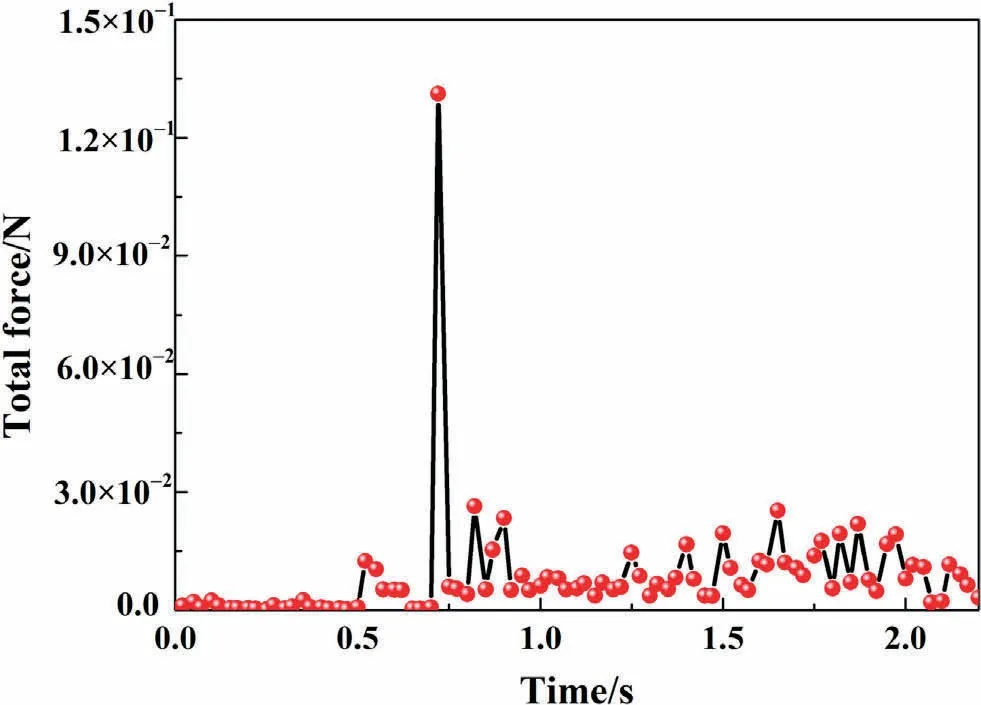
Fig.10.Variation of total force acting on a graphite particle with time.
(iii) Fluid shear force
The fluid shear force exerted on single particle inside the stirred tank reactor during exfoliation is composed of molecular viscosity shear force and turbulent viscosity shear force,which results from the van der Waals force (between solvent and graphite particles)and the eddies of the solvent, respectively.The fluid shear force can be calculated as
The calculated shear force has maximized value of 0.1 N for graphite particle with dimensions of 50 μm × 2000 μm, which is far less than the threshold value at the beginning of graphite exfoliation process.So,the fluid shear force is not the active force for graphite exfoliation process.
(iv) Shear force from slip velocity
Shear force from the velocity difference between graphite particle and solvent fluid, may be the other active force for graphite exfoliation.As depicted in Fig.11, for the graphite particle inside the stirred tank reactor, the particle macro motion is possiblely determined by the fluid flow behavior.
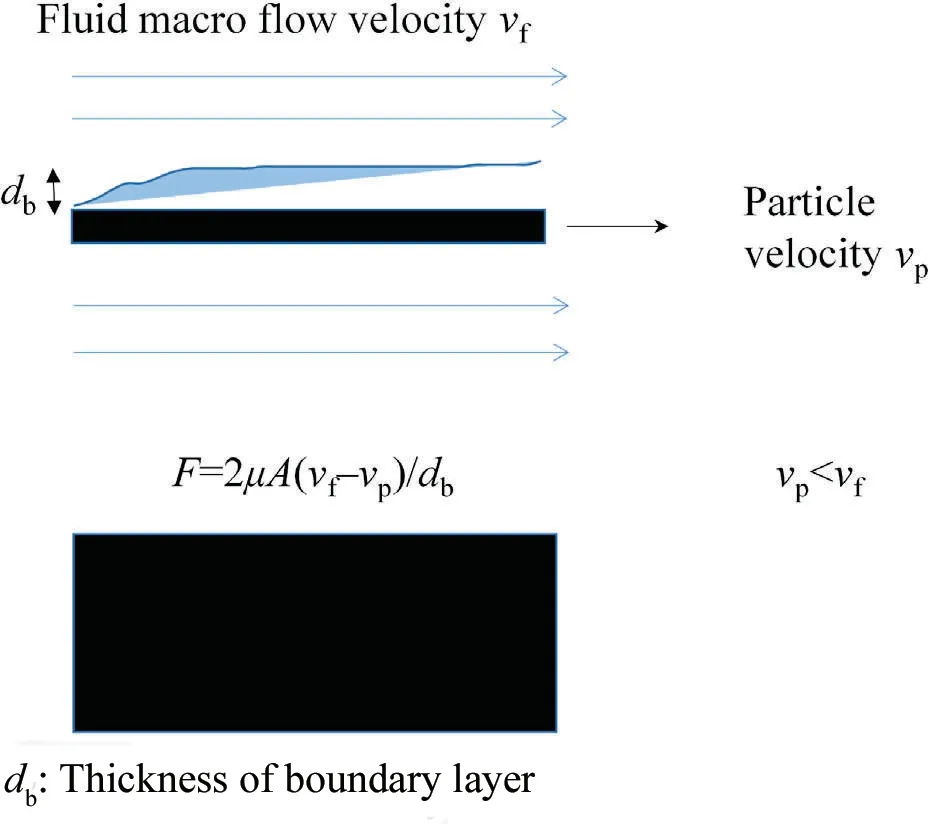
Fig.11.Shear force generated from slip velocity for single graphite pellet.
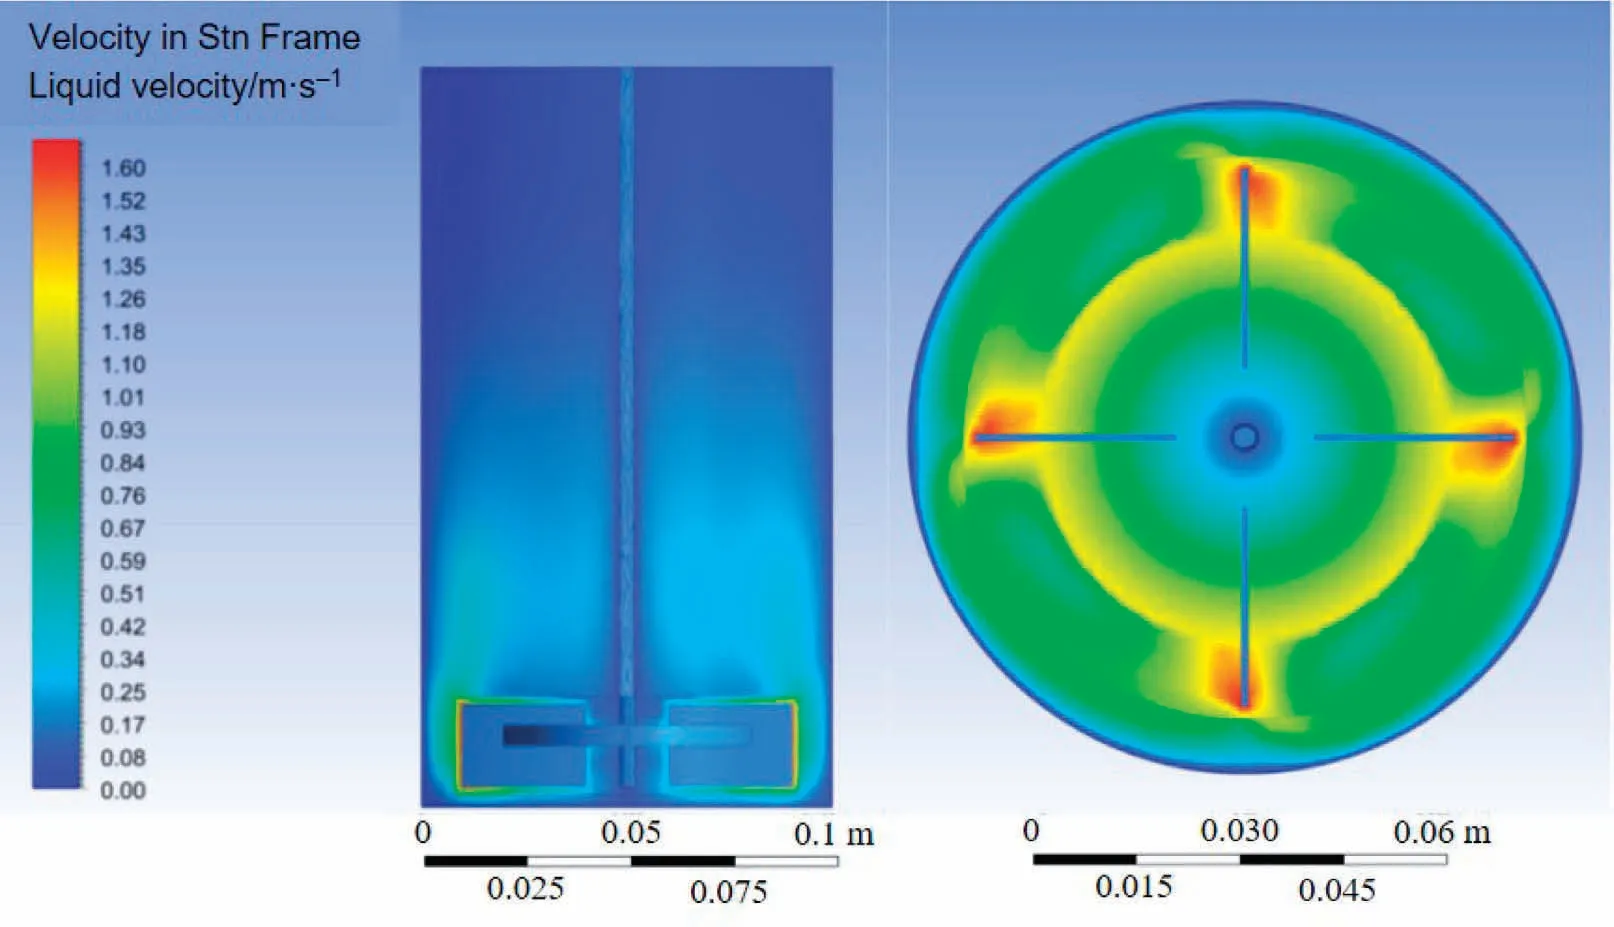
Fig.12.Fluid velocity distribution.
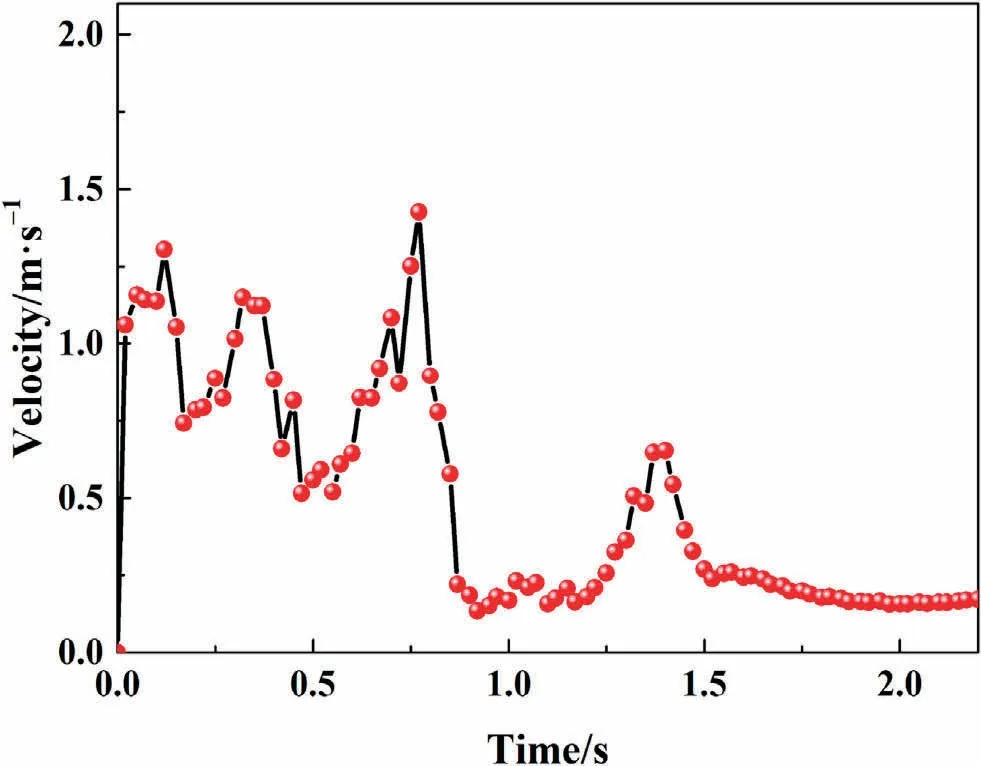
Fig.13.Variation of particle velocity magnitude of a graphite particle with time.
Along flow direction, the particle velocity is usually smaller than fluid, which is usually called slip velocity [52] and is calculated as
where vfis the velocity of solvent fluid and vpis the velocity of graphite particle.Figs.12 and 13 gives the velocity of solvent fluid and velocity of graphite particle distribution inside the stirred tank reactor, respectively.
For liquid solid multi-phase flow system, the liquid phase energy is results from the rotation of the impeller, while the solid particle velocity is related to the liquid phase flow hydrodynamics.For the liquid-solid system investigated, the prediction results from EDEM shows that the maximum particle velocity inside the stirred tank reactor is 1.5 m·s-1and corresponding position is depicted in Fig.14(a)and(b).Fig.14(c)is the liquid phase velocity distribution at the cross section where the maximum particle velocity happens.By subtracting the maximum particle velocity from the fluid velocity at the fluid location (particle velocity is maximum), the maximum slip velocity is 1.2 m·s-1.
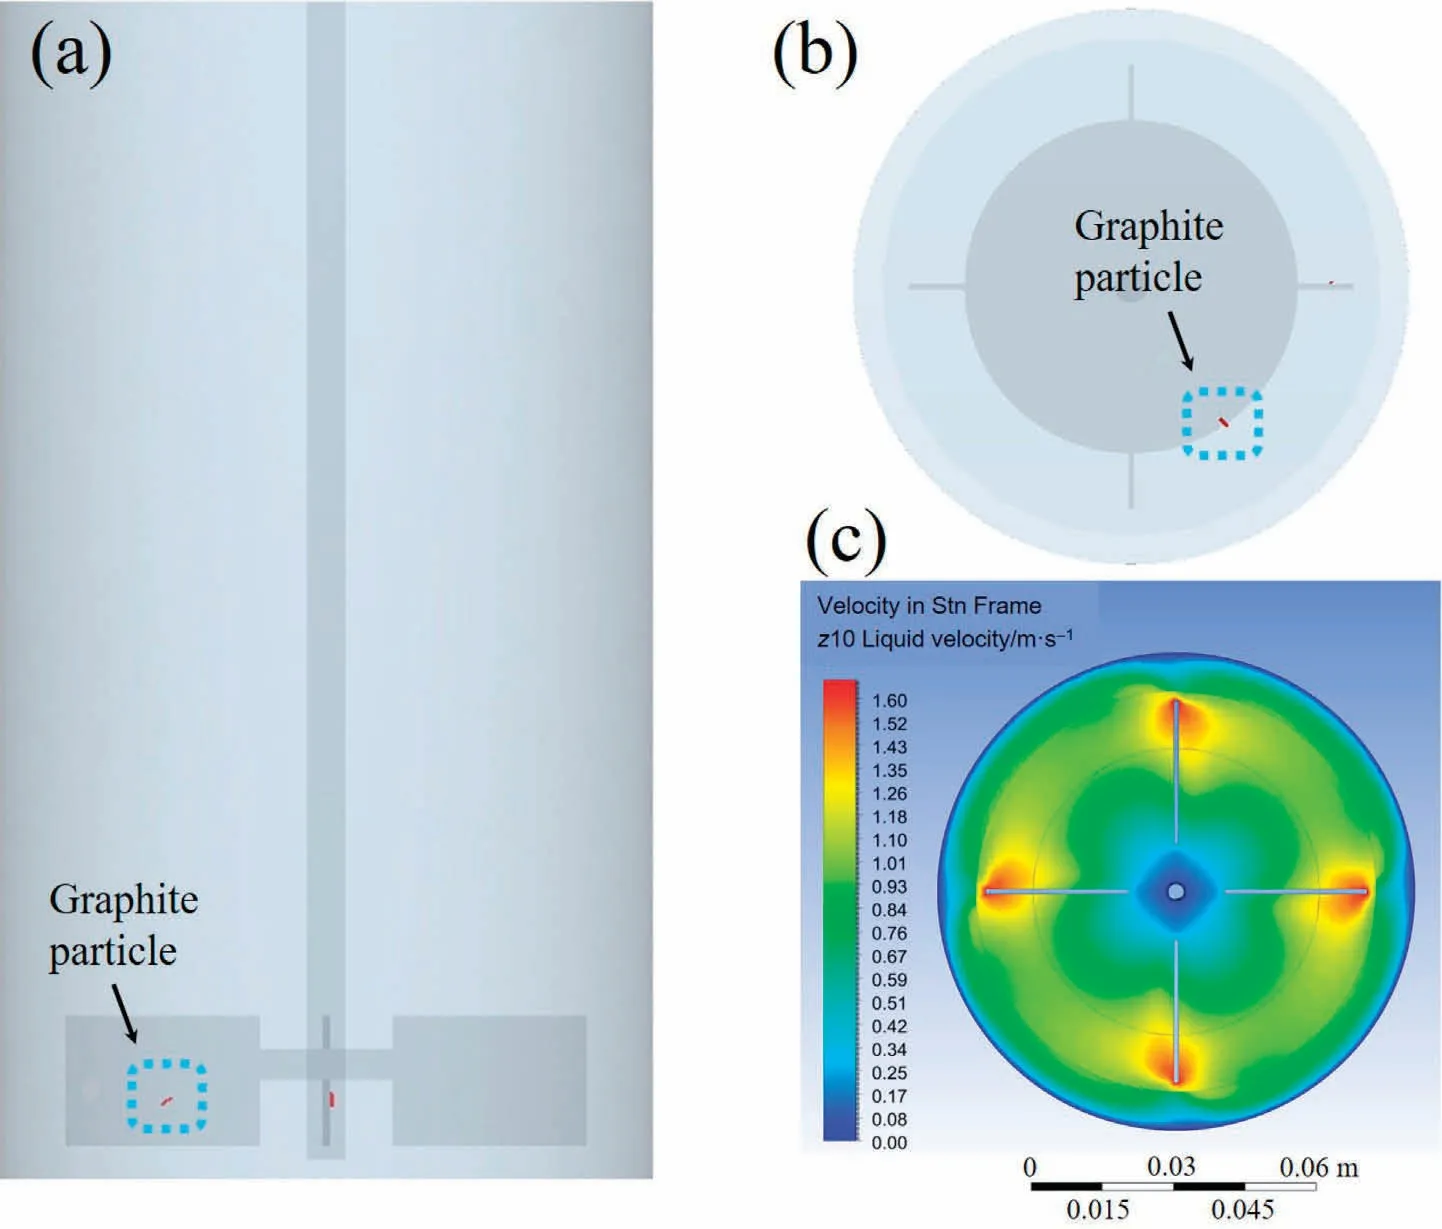
Fig.14.The position of the maximum slip velocity: (a) particle axil position, (b) radial position, (c) velocity distribution.
Based on that,the shear force generate from slip velocity can be calculated as
The thickness of the stagnant layer is calculated as
where dgis the thickness of graphene with single layer;n equals to one (based on single layer graphene).The shear force generated from slip velocity is calculated as
where μtotal= μ + μt= 0.00156 + 0.093 Pa·s, A = 50 × 10-6×2000 × 10-6m2for 50 μm × 2000 μm particles, vf- vp=1.2 m·s-1, db= 0.32 nm.Ffptis determined as 68 N, which is about 0.7 times higher than threshold force for graphite particle with dimensions of 50 μm × 2000 μm.This result indicates that the shear force generating from the slip velocity could be the active force at the beginning of the graphite exfoliation.Comparison between Eqs.(32) and (38), it is inferred that the ratio between shear force (from slip velocity) and threshold force is not affected by the contact areas between solvent and the graphite particle.For graphite particles with different dimensions, the shear force from the slip velocity in the stirred tank is higher than the threshold shear force for graphite exfoliation.Based on these results,the graphite exfoliation process can be optimized by increase the slip velocity between graphite particle and solvent fluid.
4.Conclusions
By the CFD-DEM stimulation,the quantitative description of the liquid-solid flow behavior for graphene production in stirred tank reactor was realized.The liquid velocity distribution indicated that laminar flow and turbulent flow occurred in the region near the reactor wall and near the stirring blades, respectively.By analysis of the particle motion behavior and forces acting, it can be concluded that the shear force resulted from the slip velocity is the active force at the beginning of the exfoliation.
Declaration of Competing Interest
The authors declare that they have no known competing financial interests or personal relationships that could have appeared to influence the work reported in this paper.
Acknowledgements
Financial supports by National Natural Science Foundation of China (U2004176, 22008055) and Technology Research Project of Henan Province (232102240034) are gratefully acknowledged.
Supplementary Material
Supplementary material to this article can be found online at https://doi.org/10.1016/j.cjche.2023.06.005.
Nomenclature
 Chinese Journal of Chemical Engineering2023年12期
- Chinese Journal of Chemical Engineering的其它文章
- Intrinsic kinetics of catalytic hydrogenation of 2-nitro-4-acetylamino anisole to 2-amino-4-acetylamino anisole over Raney nickel catalyst
- Experiments and model development of p-nitrochlorobenzene and naphthalene purification in a continuous tower melting crystallizer
- α-Synuclein: A fusion chaperone significantly boosting the enzymatic performance of PET hydrolase
- Influence of water vapor on the separation of volatile organic compound/nitrogen mixture by polydimethylsiloxane membrane
- Mass transfer mechanism and relationship of gas-liquid annular flow in a microfluidic cross-junction device
- Enhanced photocatalytic activity of methylene blue using heterojunction Ag@TiO2 nanocomposite: Mechanistic and optimization study
