
The influence of the underpassing frozen connecting passage on the deformation of the existing tunnel
2023-01-02 08:08JunHaoChenJianZhangBiJianChenGenLu
JunHao Chen,Jian Zhang,BiJian Chen,Gen Lu
1.School of Civil Engineering,Fujian University of Technology,Fuzhou,Fujian 350118,China
2.Key Laboratory of Underground Engineering,Fujian Province University,Fuzhou,Fujian 350118,China
ABSTRACT Based on the engineering background of the contact channel between Shangyang and Gushan of Fuzhou Metro Line 2 undercrossing the existing tunnel line,the freezing temperature field of the contact channel,the displacement field of the existing tunnel line and the contact channel with different net distances and horizontal angles are analyzed by ANSYS finite element software and field measurement method.The obtained results indicate that during the freezing period,the temperature drops at different measuring holes are almost the same.The temperature near the bottom freezing tube drops faster than that far from the tube.It is found that the bilateral freezing technique improves the formation of the freezing wall in the intersection area.In this case,the intersection time of the cross-section is 7 days faster than that of the adjacent ordinary section.The change curve of the displacement of the surface uplift in different freezing periods with the distance from the center of the channel is"M"shaped.The maximum uplift displacement at 12 m from channel center is 25 mm.The vertical displacement of the measuring point located above the central axis of the connecting channel is large.The farther the point from the central axis,the smaller the corresponding vertical displacement.When the horizontal angle between the existing tunnel and the connecting channel is less than 60°,the existing vertical displacement of the tunnel changes rapidly with the horizontal angle,reaching 0.17 mm/°.Meanwhile,when the net distance is less than 6.1 m,the change rate of the vertical displacement of the tunnel is up to 2.4 mm/m.
Keywords:existing tunnel;displacement field;connecting passage;freezing method;down crossing
1 Introduction
With the development of subway transportation networks,the mutual influence between subway tunnels has attracted scholars worldwide.As an important part of the subway tunnels,connecting passages affect the nearby tunnels during the construction process(Liet al.,2009;Sunet al.,2015;Penget al.,2017;Wuet al.,2018;Yinet al.,2018).Currently,numerous investigations have been carried out on the construction of contact channels.In this regard,experts obtained the normal distribution of the surface deformation by monitoring and analyzing the displacement field of the contact channel(Lang,2017;Yanget al.,2017;Tanget al.,2019;Zhao,2019).Liet al.2015)studied the orthogonal crossing of an existing tunnel through a contact channel and obtained the frost heave and thaw settlement change law of the existing tunnel in the upper part of the passage in the freezing construction.Scholars analyzed the mechanical properties of the freezing wall of the contact channel to provide a design and construction reference(Shiet al.,2011;Zhai and Cui,2012;Wang and Zhou,2013;Sunet al.,2018;Honget al.,2019;Li and Cai,2019).Others analyzed the freezing temperature field,surface displacement,internal force and deformation of tunnels on both sides of the tunnel during the construction of the subway connection channel,and provided a basis for the freezing construction of the connection channel(Wanget al.,2011;Mao and Liu,2013;Liet al.,2019).
Reviewing the literature indicates that the majority of investigations on the surrounding environment of the frozen connecting passage have focused on the displacement and deformation of the shield tunnel and the ground surface area connected to the left and right sides of the connecting passage.More specifically,investigating the influence of the freezing construction of the connecting passage on the upper existing tunnel is mainly confined to the study of the temperature and displacement fields under a single orthogonal or fixed vertical clearance between the existing tunnel and the connecting passage.However,for increasingly complex underground transportation networks,designing and planning of the spatial position between the two lines are often not an ideal orthogonal,or there is not a constant distance between adjacent lines.Therefore,it is necessary to study the action law of the upper existing tunnel with different net distances or horizontal angles in the process of channel freezing.
In the present study,the connecting passage between Shangyang and Gushan on Fuzhou Metro Line 2 is considered as the research object.It is intended to carry out field measurements and apply the finite element method to perform numerical simulations and investigate the connecting passage and the existing subway tunnel at different net distances and horizontal angles during the freezing process.The obtained displacements and deformation laws under the lower part are expected to provide a reference in the designing and construction of similar projects.
2 Engineering background
2.1 Project descri ption
In the present study,the subway line between Shangyang and Gushan in Fuzhou Metro Line 2,which passes through Wenfu Railway from north to south sides of Yanglizhong Bridge and there are more infrastructure and public facilities around,Moreover,a contact channel(hereafter called 1#)exists in this interval line.
The center mileage of the studied interval contact channel with a length of 42.68 m is YDK35+898.179(ZDK35+939.022).The channel is at a depth of 20 m with a 300 mm thick C25 shotcrete as initial support and a 400 mm thick mold C35 concrete as the secondary lining.The net width and net height of the tunnel are 2.5 m and 2.48 m,respectively.Meanwhile,the net distance between the contact channel and the upper existing tunnel is 7.1 m.
The soil layers at the top of the existing tunnel consist of silt(9.26-12 m thick),clay(4.7-9.5 m thick)and silt soil with a thin sand layer(8.7 m-10.8 m thick).The silt layer is dark gray,fluid plastic,saturated and highly compressible,which mainly consists of clay,silt with a thin sand layer.Moreover,the clay layer is shiny and impervious and has medium compressibility.Silty soil is highly compressible and weakly permeable and consists of a thin sand layer.
Above the left line of the channel is the block of Fuzhou Shuntai Motor Vehicle Detection Co.,Ltd.,and the right line is the edge of Fuzhou West Third Ring Auxiliary Road,where vehicles are always passing.A DN800 rainwater pipeline is installed on the lane of the third ring auxiliary road on the right side of the contact channel with a buried depth of about 2.5 m.Other pipelines are not distributed and have a negligible impact on the construction.The water level of the site is about 4.65 m.
2.2 Freezing design
In order to ensure soil stability during the construction,the ground mixing pile is used to reinforce the soil before excavating the contact channel.Considering the length of the contact channel,many factors affect the excavation process.To reduce the engineering risks during the construction,the scheme of'horizontal freezing in the tunnel to reinforce the soil and underground excavation in the tunnel'is used.In this regard,freezing pipes are arranged at both ends to perform the horizontal freezing,facilitate the drilling construction and achieve a better freezing effect.Accordingly,a total of 178 freezing holes were prepared on the left and right sides,andϕ108×8 mm seamless steel pipes were used as the freezing pipe.The active freezing period was considered 66 days in this project.
Based on the safety design requirements,the unconfined compressive strength of the frozen wall should be higher than 3.6 MPa.To this end,the interface temperature between the frozen wall and the segment and the average temperature of frozen soil should be maintained lower than-5 °C,and-10 °C,respectively.Moreover,the thickness of the horn mouth is 1.8 m,the normal section of the channel and pump house is 2.1 m,and the end of the channel is 2.4 m.Figure 1 illustrates the position of the contact channel relative to the freezing pipe.Section A-A is intercepted at the bell mouth 3.272 m from the center of the left tunnel,section B-B is intercepted at the normal section 12.254 m from section A-A,and the cross center of the freezing pipe is C-C.Figure 2 shows the layout of the left freezing hole.

Figure 1 The position relation graph of connecting channel and freezing pip

Figure 2 Layout of left line freezing hole
3 Calculation of the Contact Channel
3.1 Modelling
In the present study,ANSYS software,which is a widely adopted commercial finite element solver,is used to establish the model for the freezing contact channel.Considering the symmetry of the contact channel,only half of the domain is modeled.The established model is 89.2 m long,15 m wide,39 m high,and the net distance between the bottom of the existing tunnel and the top of the channel is 7.1 m.It is assumed that each soil layer is horizontal and isotropic.Moreover,the elastic constitutive model is adopted in calculations.Figures 3 and 4 show the position and grid division of the established model for the freezing pipe and tunnel structure,respectively.The calculation model is mainly composed of 4-hedron units,a total of 303,968 units and 528,676 nodes.
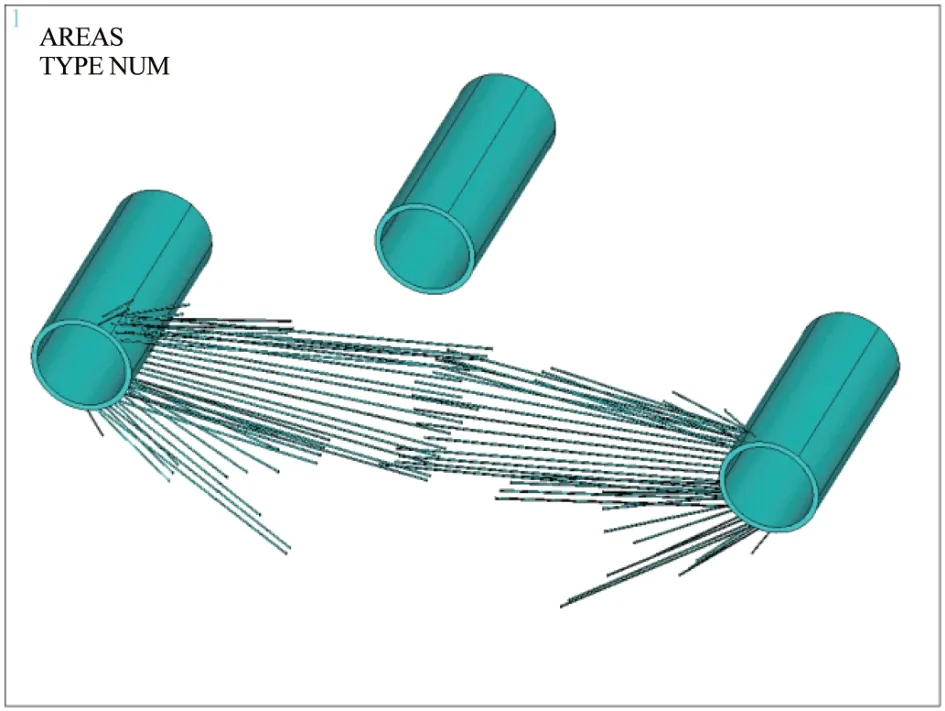
Figure 3 Half of the frozen mod
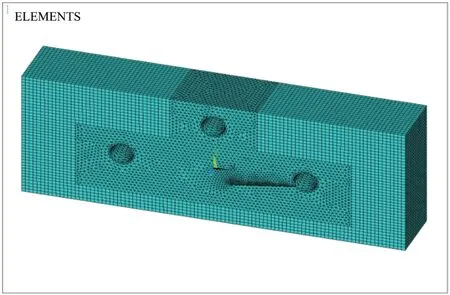
Figure 4 The distribution of model cell grid
3.2 Parameter selection
Tables 1 and 2 present the parameters of soil layers and tunnel structure,respectively.It is worth noting that these data are obtained from the geological survey of the project.The compression modulus and Poisson's ratio of soil layer at the temperature of-30 °C and-1 °C are 160 MPa and 0.26(Liet al.,2019).

Table 1 Parameter table of soil physical mechanics

Table 2 Thermodynamic parameters of soil layer
3.3 Simulating the freezing process
In the calculations,the transient thermal analysis module of ANSYS software is used to investigate the temperature field of the contact channel.Since the stratum is located in the hot spring concentrated area,the soil temperature reaches 40 °C so that the initial soil temperature is to 40 °C.The temperature load on the freezing pipe wall is applied according to the temperature curve of the left and right saltwater loops,shown in Figure 5.It should be indicated that the start time of the right line is 8 days earlier than that of the left line.After performing the simulation,calculated temperatures are imported into the model as the temperature load of displacement analysis for deformation analysis.
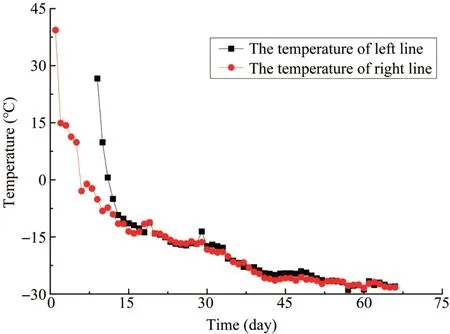
Figure 5 Temperature change chart of salt water in freezing pipes on both sides
4 Analysis of the freezing temperature field
4.1 Verifying the Numerical Calculation
In order to determine the rationality of the model temperature calculation results,three positions are considered to compare calculated temperatures with the measured values.In this regard,the outer temperature measuring hole C1-5 m and the inner temperature measuring hole C3-18 and C7-12 m are considered.It should be indicated that in the CN-Y format,N is the number of the temperature measuring hole,and Y denotes the hole depth.The distance between each measuring point and the freezing pipe is shown in Figure 2.Since the right line starts 8 days earlier than the left line,the field measurement results of each temperature measurement hole in the 9-58 d interval of the left line are compared with the temperature change of the corresponding region in the model.Figure 6 shows the obtained results accordingly.
It is observed that the simulated and measured temperature variations of points C1,C3 and C7 are the same trend.Before freezing for 40 days,the deviation between the two is 2-3 °C,and then the deviation is within 1 °C.Meanwhile,it is found that the temperature of the point C3 reaches-5 °C at the end of the freezing period and meets the design requirements.In addition to the deviation between simulation and measurement caused by the phase change heat release of the soil at 0 °C,the temperature difference at other freezing moments is consistent.Since point C7 is close to the bottom freezing tube,the temperature reaches-17°C at the end of the active freezing process.Temperature distribution at point C7 indicates that variation of the freezing temperature can be divided into three stages.The first stage,called the"rapid cooling zone",is the region where the temperature is higher than 0°C,and the temperature reduction rate is high,up to 2-2.5 °C/d.In the second stage,called the"stationary region",the temperature ranges between-5 and 0 °C and the temperature changes slowly,during 0.25-0.35 °C/d.Finally,in the third stage,known as the"slow cooling zone",the temperature is less than-5°C,and the variation rate is between the first two stages.Obtained results show that the difference between the simulation and the measured values at all points is less than 2 °C.However,the maximum difference during the phase transition is 5 °C.Accordingly,the simulation is verified.

Figure 6 Comparison between simulation and measurement of temperature measurement points
4.2 Analysis of temperature field results
The temperature change of the contact channel was simulated and the temperature contours at different times during the freezing process were obtained.Figure 7 illustrates temperature contours for 58 days process.According to the survey report,the soil freezing point temperature is-1°C.
It is observed that after 58 days of active freezing,the frozen wall is distributed along the full length of the channel.Moreover,it is found that the frozen wall in the horn mouth area is the thickest,reaching 4.3 m.The closer to the cross area of the middle freezing pipe,the thicker the freezing wall.At the depth of 8 m,the thickness of the freezing wall at the top of the channel gradually reduces from 3.6 m to 2.1 m.This may be attributed to the arrangement of the freezing pipes,indicating that an appropriate spacing between the freezing pipes significantly affects the freezing.Moreover,it is observed that the frozen wall in the cross area of the freezing pipe significantly thickens to 3 m,indicating that the bilateral freezing promotes the formation of the frozen wall in the cross area.
Affected by the divergent layout of the freezing pipe,the freezing pipe at the horn mouth section is the densest so that the thickest freezing wall forms at this position.The intersection time of the cross-section(14 d)is 7 d faster than that of the adjacent normal section(21 d).After active freezing,the thickness of the channel sidewall is 2.8 m>2.2 m>2.0 m.It is concluded that reasonable spacing between freezing pipes improves the freezing effect,thereby saving resources and reducing costs.
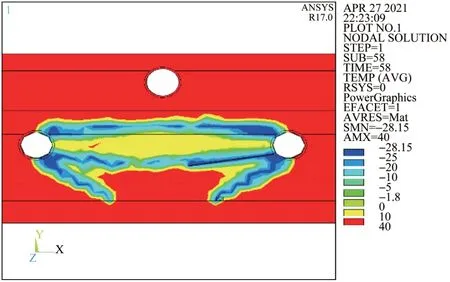
Figure 7 Temperature nephogram of contact passage for 58 days freezing
5 Analyzing the freezing displacement field of the contact channel
5.1 Displacement variation of the surrounding soil layer
The displacement calculation model above the existing tunnel,which is affected by the freezing of the lower contact channel,is carried out in ANSYS software.Figure 8 illustrates the Cloud atlas of the surrounding displacement field at the end of the active freezing process of the contact channel.
It is observed that the upward frost heaving displacement occurs along the horizontal centerline,and the maximum frost heaving displacement occurs at the upper part of the contact channel.After 58 days of freezing,the maximum displacement reaches 75 mm.The frost heaving displacement direction at the lower part of the contact channel is downward.After 58 days of freezing,the maximum displacement value reaches-47 mm.According to the cloud image,it is found that the closer the soil to the freezing pipe,the more obvious the frost heaving effect.In the contrast,the farther the distance,the smaller the frost heaving effect.
Figure 9 compares the displacement of the measuring points on the cross-section of the central surface is compared with the measured data.
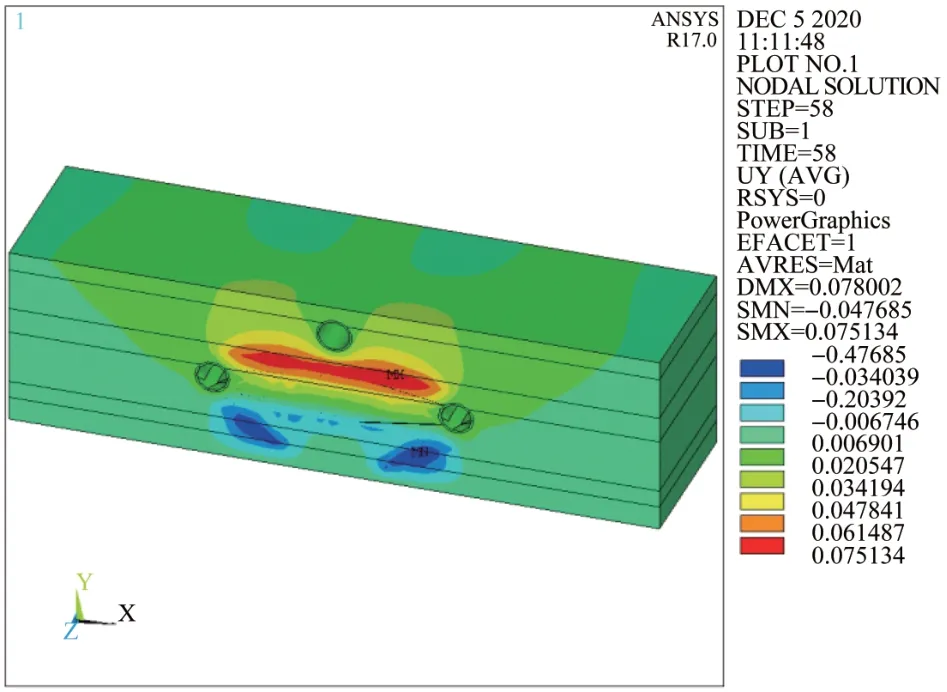
Figure 8 Displacement of stratum after 58 d freezing(m)
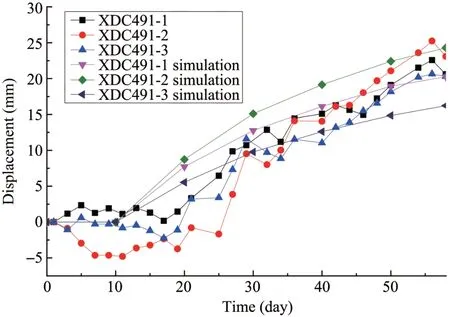
Figure 9 Comparison of ground displacement measured and simulated
It is observed that the measured displacements of XDC491-1,XDC491-2 and XDC491-3 are similar to the simulated values.Except for individual points,the measured displacement of XDC491-2 on the 20th day is-3.5 mm,while the calculated displacement is 8.5 mm.This deviation may be attributed to the measuring error,approximations in the calculations and uncertainties in material characteristics,boundary conditions and other aspects.However,the measured data simulations have similar variations.It is inferred that the performed simulation has an excellent consistency with the experiment.
In order to obtain the correlation between the surface uplift displacement and the distance,the surface displacement changes of four sections shown in Figure 8 are selected.Meanwhile,variations of the surface uplift displacement at the symmetric surface of 0 m at active freezing periods of 30 d,40 d,50 d and 58 d are obtained,as shown in Figure 11.
Figure 10 shows the variation trend of surface uplift displacement at four sections(0 m,10 m,20 m and 30 m).It is observed that the maximum vertical displacement is 25.0 mm,which occurs at the symmetric surface.Considering the influence of the existing tunnel in the upper part,as the distance from the symmetry center increases,the 0 m vertical displacement of the symmetry plane increases rapidly at first and then decreases gradually,while the 10 m vertical displacement of the symmetry plane only changes slightly.This may be attributed to the close arrangement of the freezing pipe above the contact channel so that the stress does not release.Figure 11 shows that the vertical displacement curve of the surface in different freezing periods is almost"M"shaped.It is observed that as the axial distance from the contact channel increases,the vertical displacement of the surface gradually increases.Moreover,12 m far from the center of the channel,the vertical displacement of the surface reaches the maximum value,which is 25.0 mm after 58 d of freezing.Subsequently,the vertical displacement of the surface gradually decreases.
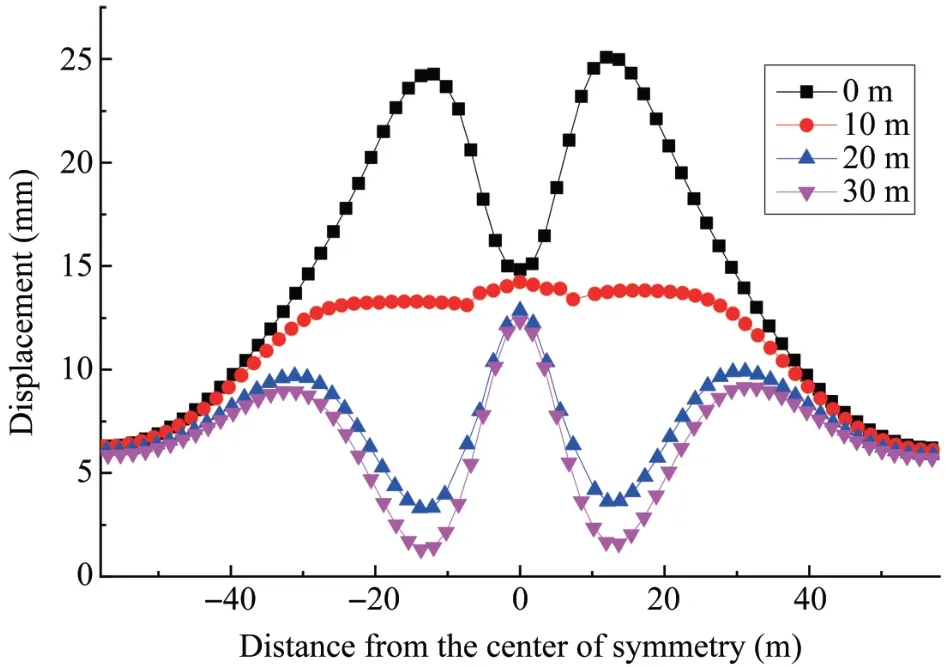
Figure 10 Relationship between surface uplift and distance

Figure 11 Relationship between surface uplift changes during different freezing periods
6 Displacement field analysis of existing upper tunnel
6.1 Relationship between displacement of the existing tunnel and the buried depth
To obtain the displacement variation law of the upper existing tunnel under different burial depths,the vault net distances of the existing tunnel and the contact channel of 7.6 m,6.1 m and 4.6 m are analyzed.Through the finite element simulation,the displacement change cloud chart of the upper existing tunnel with different net distances at 58 days of freezing is obtained,which is shown in Figure 12.
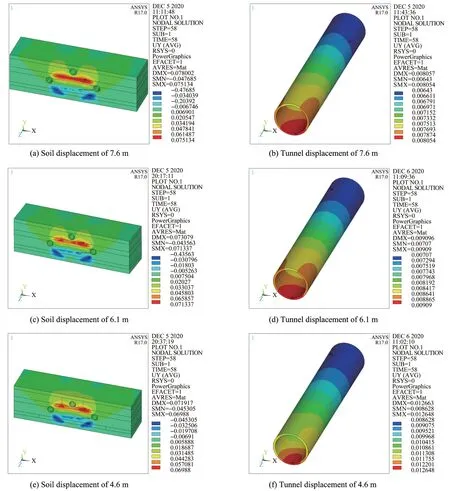
Figure 12 Displacement nephogram of existing tunnel and soil layer under different net distances
It is observed that for the net distances of 4.6 m,6.1 m and 7.6 m,the maximum vertical displacements of the soil layers are 69.8 mm,71.3 mm and 75.1 mm,respectively.At these points,the maximum vertical displacements of the existing tunnel are 12.6 mm,9.0 mm and 8.0 mm,respectively.It is found that as the net distance increases,the vertical displacement of the soil layer increases,while the vertical displacement of the existing tunnel decreases.This is because the smaller the net distance,the greater the soil layer impact on the existing tunnel.
Then the displacements at the arch bottom and arch top,and vertical displacements corresponding to the surface positions at different net distances of the existing tunnel in the upper part after 58 d of freezing are extracted.Obtained results are shown in Figure 13.
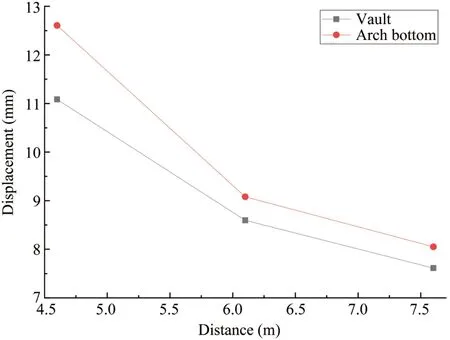
Figure 13 The relationship between the displacement of 58 days frozen and the net distance
It is observed that as the net distance increase,the displacement of the vault and arch bottom gradually decreases.For the net distances of 4.6 m and 6.1 m,the maximum corresponding displacements of the vault and arch bottom of the existing tunnel are 11.1 mm,12.6 mm and 8.6 mm,9.1 mm,respectively.It is found that when the net distance increases by 1 m,the displacement of the vault and the arch bottom reduce by 1.67 mm and 2.33 mm,respectively.A similar trend exists for the net distances within the range of 6.1-7.6 m and as the net distance increases by 1 m,the corresponding displacement of vault and vault bottom reduces by 0.73 mm and 0.87 mm,respectively.
In order to obtain the correlation between the surface uplift corresponding to the symmetrical section(0 m)at different net distances,deformations of the surface uplift against the path are extracted.
Figure 14 shows the variation of the vertical displacement of the surface for three net distances.It is observed that the vertical displacement of the uplift is almost"M"shaped,and variations of the surface uplift displacement for different net distances are similar.At a net distance of 7.6 m,as the distance increases,the surface uplift displacement rapidly increases first and then decreases slowly.Moreover,for the net distance of 18 m,the uplift displacement reaches the maximum of 25.0 mm.When the net distance is 0 m,the maximum vertical displacements for the net distances of 7.6 m,6.1 m and 5.6 m are 15.0 mm,16.5 mm and 21.5 mm,respectively.It is concluded that the closer the freezing pipe to the bottom,the stronger the freezing effect and the larger the vertical displacement.Distributions of the surface vertical displacement in Figure 14 reveal that the soil within 60 m from the axis of the contact channel is affected by the freezing process.
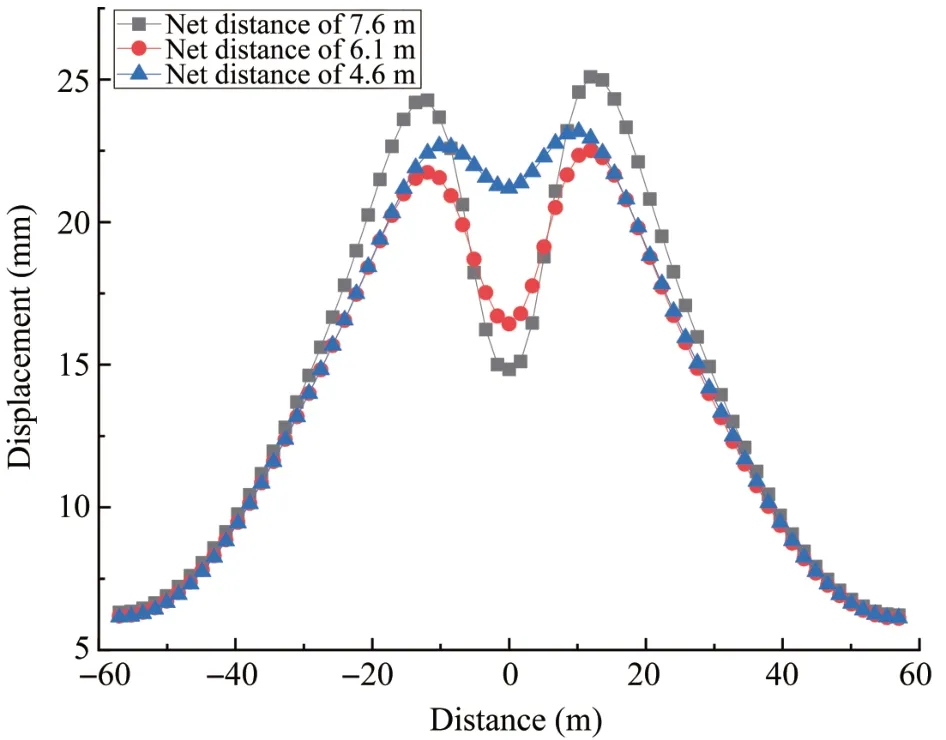
Figure 14 The relationship between surface uplift and distance with different net distances
6.2 Correlation between displacements of the upper existing tunnel and the horizontal angle
In order to obtain the correlation between the displacement of the upper existing tunnel and the horizontal angle of the lower contact channel,four cases are considered in this section.Horizontal angle refers to the angle(sharp angle)between the contact channel and the existing tunnel projection on the horizontal plane.In the selected cases,the vertical net distance between the upper existing tunnel and the lower contact channel is 5.6 m,and the horizontal angles are 45°,60°,75°and 90°,respectively.Figure 15 presents the displacement contours for selected cases.
It is observed that the maximum vertical displacements of the existing tunnel for the horizontal angles of 45°,60° and 75° are 19.0 mm,16.4 mm and 15.0 mm,respectively.Moreover,it is found that when the angle is less than 60°,the vertical displacement of the existing tunnel decreases by 0.17 mm/°of the horizontal angle.On the other hand,when the angle exceeds 60°,the vertical displacement of the tunnel decreases by 0.09 mm/° of the horizontal angle.The difference may be attributed to the higher energy loss for larger angles,originating from higher heat exchange rate with the surrounding soil of the existing tunnel in the freezing process.
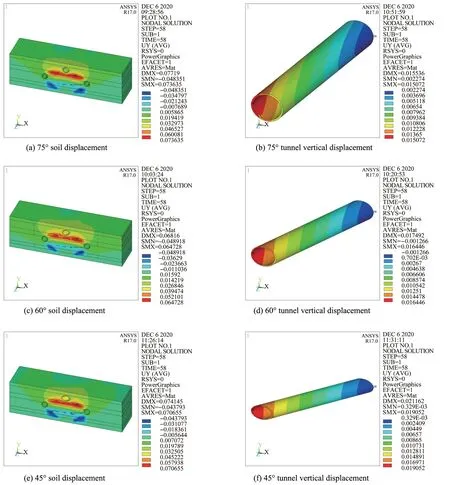
Figure 15 Relationship nephogram of existing tunnel displacement with angle change
Vertical displacements of the vault and the arch bottom of the upper existing tunnel at different horizontal angles are extracted,and the obtained results are presented in Figure 16.
It is observed that the vertical displacement of the vault and arch bottom gradually decreases as the horizontal angle increases.When the angle is between 45°and 90°,the displacement difference between the two cases is less than 1 mm.It is found that the displacement variations of vault and arch bottom with the angle are basically the same.
7 Conclusions
In the present study,the connection channel between Shangyang and Gushan in Fuzhou Metro Line 2,which passes through the existing tunnel line is investigated.Then displacements of the existing tunnel for different net distances and horizontal angles are analyzed.Based on the obtained results,the main conclusions can be summarized as follows:
(1)In the positive freezing period,the temperature drops at different holes are almost the same.The temperature near the bottom freezing pipe decreases faster than that far from the pipe.The bilateral freezing improves the formation of the freezing wall and the intersection time of the cross-section is 7 days faster than that of the adjacent normal section.
(2)During the freezing period,the displacement variations of different points are almost the same.The surface uplift displacement is the largest at the symmetry plane,and the vertical displacement curve of the surface in different freezing periods is"M"shaped.The longer the freezing time,the greater the surface uplift displacement.The maximum uplift displacement at 12 m from the channel center reaches 25 mm.
(3)The vertical displacement of the measuring point above the central axis of the contact channel is large,and the farther from the central axis,the smaller the vertical displacement.Moreover,the larger the net distance between the existing tunnel and the contact channel vault,the larger the vertical displacement of the existing tunnel.For the net distance of 7.6 m,the maximum vertical displacement at 12 m from the channel center is 25 mm.
(4)When the horizontal angle between the upper existing tunnel displacement and the lower contact channel is less than 60°,the change rate of the vertical displacement of the tunnel is fast,reaching 0.17 mm/°,indicating that the vertical displacement is greatly affected by the horizontal angle.
Acknowledgments:
This research was supported by the project of Natural Science Foundation of Fujian Province(No.2022J019 25),and supported by the project of the Fuzhou Science and Technology Plan Project(2021-P-047),and supported by the Open Project Program Foundation of Engineering Research Center of underground mine construction,Ministry of Education(Anhui University of Science and Technology)(No.JYBGCZX2021104).
 Sciences in Cold and Arid Regions2022年4期
- Sciences in Cold and Arid Regions的其它文章
- Influence of freeze tube deviation on the development of frozen wall during long cross-passage construction
- Thermal-Hydro-Mechanical coupled analysis of unsaturated frost susceptible soils
- Frozen curtain characteristics during excavation of submerged shallow tunnel using Freeze-Sealing Pipe-Roof method
- Discussion on pile axial load test methods and their applicability in cold regions
- Application of automated cone penetrometer for railway investigation using correlations with DCPI and Deflection Modulus
- Triaxial test on glass beads simulating coarse-grained soil