Investigate of the optimum process conditions for Co/HZSM-5 catalyzed propane dehydrogenation by a response surface method
QIU Xin-ling ,CHAI Rui-dong ,ZHONG Fu ,DI Xiu-ling ,LU Jiang-yin
(Key Laboratory of Oil & Gas Fine Chemicals Ministry of Education, Xinjiang Uyghur Autonomous Region, School of Chemical Engineering, Xinjiang University, Urumqi 830046, China)
Abstract: Co/HZSM-5 catalyst was fabricated for catalytic dehydrogenation of propane to propylene, which was pretreated to allow the reaction to react at low temperatures. A response surface approach was employed to examine the effect of process conditions on the reaction. The morphological and oxidative performance of Co/HZSM-5 was characterized by XRD, XPS,SEM, NH3-TPD, H2-TPR, and nitrogen physical absorption-desorption. Besides, the in-situ catalyst performance was evaluated by a fixed-bed reactor. Combining the actual experimental conditions, the optimal process conditions parameters obtained by the response surface method were as follows: a reaction temperature of 461 °C, a Co loading of 2.4%, and a GHSV of 4300 h-1. At this point, the propylene yield reached 27.7% and the corresponding propylene selectivity was up to 93.8%.
Key words: Co/HZSM-5 catalyst;response surface;propane dehydrogenation;process conditions
Propylene is one of the most important basic organic chemical raw materials. The processes used to manufacture propylene are relatively diverse, and there is a wide range of downstream industries[1,2]. Catalytic dehydrogenation of propane is an important way to produce propylene, among which the platinum[3,4]and chromium[5]based catalysts are the most studied.However, as Pt is more expensive which results in higher production costs, and Cr is toxic and unfriendly to the environment, it is essential to realize lower loadings of these catalysts or to discover new alternative catalysts. Cobalt-based catalysts[6]have the advantages of being economical and environmentally compatible, and are mostly applied in the oxidative dehydrogenation of propane to propylene process. But the process exhibits the drawbacks of deep oxidation and high operating hazard factor. Therefore, the investigation of cobalt-based catalysts in the field of direct dehydrogenation process is still prospective.
Zhang et al.[7]prepared Pt-based bimetallic catalysts such as Pt-Sn/ZSM-5 and Pt-Sn/SBA-15 for propane dehydrogenation by impregnation method,which proved that Pt-based catalysts with ZSM-5 molecular sieve as the carrier were more effective in dehydrogenation. Dewangan et al.[8]synthesized Cobased catalysts that supported on different morphologies of nanoscale Al2O3of nanosheets,nanofibers, and nanoplates. The experimental results expressed the strongest interaction between the Co species and the nanosheet-like support, which in turn led to the highest catalytic activity of the catalyst.Further analysis combining multiple characterizations concluded that the main side reaction resulted from the strong adsorption of propylene, and Co2+was the active site for the propane dehydrogenation reaction.
Different kinds of Co-based SPAO-34 catalysts were prepared through ion exchange, impregnation and solid phase grinding methods by Xu et al.[9]. Lewis acid-base theory was applied to explain the mechanism of propane dehydrogenation on these Co-based catalyst. The dissociation of the adsorbed C-H bonds was attributed to the electron conversion between Co species and C-H bonds. Besides, the relationship between Co species, C-H and C-C bond breaking was also explored, which showed that in the C2-C4dehydrogenation reaction the preferential C-H bond breaking was thermodynamically presented. But in specific cases, it was also accompanied by the deep cracking reaction brought by the Co-based catalyst.When the reaction temperature reached 600 °C, the C-C bond breaking was subsequently enhanced with the increase of the carbon chain number. However,with a lower temperature, the selectivity of the products improved, and the conversion of the reactants decreased. That is also related to the heat-absorbing reaction of dehydrogenation and the limitation of thermodynamic equilibrium.
There are also researchers who have developed novel materials with remarkable performances for propane dehydrogenation. Liu et al.[10-12]used ordered mesoporous carbon materials and activated mesoporous carbon materials for the first time. The highly ordered mesopore structure of the catalyst facilitated the mass transfer during the reaction, and improved the catalyst stability. The selectivity to propylene was about 90% under the steady-state condition after 50 h of reaction. Co-N@OCNT hybrid materials with high selectivity and good stability for the direct propane dehydrogenation were successfully prepared by Cao et al.[13]. A series of characterizations have shown that the Co-N species are homogeneously distributed on the carbon nanotube (OCNT) surface and the Co atoms are primarily coordinated to the four surrounding N atoms, forming a Co-N4structure, which is the main active site for dehydrogenation. Wang et al.[14]conducted the direct dehydrogenation of propane in an experimental setup of a novel multimode microwave multiphase gas-solid catalyst. The nonprecious metal Co-Sn/NC microwave catalyst was produced with a reduced apparent performance of 20.58 kJ/mol, permitting the reaction to proceed at a lower temperature of 450 °C.
Compared with oxide, molecular sieve has larger specific surface area and special pore structure, thus is more favorable to be the catalyst support for dehydrogenation reaction[15-18]. In this work, modified HZSM-5 that treated with sodium acetate[19]was used as support and non-precious metal Co was loaded by impregnation method. The obtained Co/HZSM-5 catalyst was characterized by SEM, XPS, XRD, NH3-TPD, H2-TPR, nitrogen physical absorption-desorption.The propane dehydrogenation performance of Co/HZSM-5 was investigated, and the response surface method was used to determine the optimal reaction process conditions.
1 Experimental
1.1 Preparation of catalysts
Modification of Molecular sieve:Firstly, HZSM-5 molecular sieve (Si∶Al = 81, Laboratory home-made)powder was mixed with a 4 mol/L sodium acetate solution (Tianjin Comio Chemical Reagent Co., Ltd)by the solid to liquid ratio of 1∶20 (%). The mixture was stirred in a water bath at 80 °C for 2 h, then cooled sharply with ice water. The solids were collected by filtration, washed with deionized water to neutral, dried at 120 °C for 12 h. The obtained modified molecular sieve was denoted as HZ-0. For comparison, the HZSM-5 molecular sieve without alkali treatment was denoted as HA.
Preparation of molecular sieve supported Co catalysts:Taking 10.00 g of the catalyst with 1% Co loading as an example, 9.90 g of alkali-treated HZSM-5 powder was added into an aqueous cobalt nitrate hexahydrate solution (0.50 g of cobalt nitrate hexahydrate dissolved in 13.3093 g of deionized water). The mixture was stirred for 3 h until uniform,left to stand for 12 h, dried at 60 °C for 3 h, and finally calcined at 600 °C for 2 h with a heating rate of 5 °C/min. The obtained samples were denoted as HZ-x,wherexis the Co loading (x= 1.0%, 1.5%, 2.0%,2.5%, 3.0%).
1.2 Characterization of catalysts
The X'Pert PRO MPD X-ray diffractometer was used to analyze the physical phases of the samples. The test conditions are: CuKα as the standard light source,a tube voltage of 40 kV, a tube current of 40 mA, a scan rate of 2(°)/min and a scan interval of 5°-80°. The surface morphology of the samples was observed using a JSM-7800 (Prime)in situultra-high resolution field emission scanning electron microscope (SEM). The surface acidity and the reducibility of the active fraction were characterized by using an AutoChem II 2920 chemisorption instrument from Mac Instruments,USA. The sample to be measured (40-60 mesh) was packed into a quartz tube and firstly purged with helium gas at a flow rate of 30 mL/min for 40 min at 400 °C. After waiting for the temperature to drop to 100 °C, ammonia gas at a flow rate of 10 mL/min was switched to adsorb for 30 min. Then, the gas was changed to helium and purged at a rate of 30 mL/min for 30 min. After the purging was completed, the NH3-TPD spectrum was obtained by warming up to 750 °C according to the procedure. The signal was recorded by TCD and the desorption curve was generated. The pore structure of the samples was determined using an ASIQMO002-2 automatic specific surface and pore size analyzer from Conta Instruments, USA. The total specific surface area of the samples was calculated according to the multi-point BET method. The specific surface area and volume of micropores (pore size <2 nm) of the sample were fromt-plot method. The average pore size of the sample was measured according to the Barrett-Joyner-Halenda (BJH)adsorption method. The mesopore (pore size 2 to 50 nm) volume of the sample was according to the BJH desorption method. The total pore volume of the samples was determined at a relative pressure of 0.995.Surface chemical state of the catalyst was measured using an ESCALAB 250Xi X-ray photoelectron spectrometer from Thermo Fisher Scientific, USA.Calibration of the charge electron effect is based on a binding energy of 284.8 eV for C 1sas a benchmark.
1.3 Catalytic performance test
The catalyst performance for propane dehydrogenation was evaluated in a continuous fixedbed differential reactor (6 mm, length 400 mm). The catalyst was charged at 0.40 g with particle size of 40-60 mesh, and the reaction pressure was 0.1 MPa.From the diameter of the reaction tube and the catalyst filling volume, the catalyst filling volume can be computed as 0.792 cm3. Therefore, the total gas flow rate can be calculated from the known GHSV by Equation (1), and the flow rates of nitrogen and propane can also be calculated according to their feed ratios. As illustrated in Figure 1, before reaction,catalyst is firstly reduced by H2with a flow rate of 50 mL/min under 600 °C for 1 h. After the reduction pretreatment, the system continues to be under a hydrogen atmosphere with the temperature decreasing.When the temperature is reached to the reaction temperature, the hydrogen gas stream is turned off and the feed gas is switched. Nitrogen could be used as a protective gas when heating up or cooling down.During the reaction, nitrogen is used to dilute the propane gas with a nitrogen to propane volume ratio of 2. The reaction products were sampled every 30 min using gas chromatography (GC) type SP-3420A and analyzed on-line by GC (column: KB-Al2O3/Na2SO4capillary column, FID detector). At the 20th minute of the reaction, the first chromatogram was measured. The catalytic evaluation performance data were collected at the 80th minute, when the data were at the reaction stabilization stage. Propane conversion and propylene selectivity were calculated by carbon equilibrium[20].The molar percentages of each component are derived in Equation (2), whereAirepresents the peak area of theicomponent andfiis the relative molar correction factor for theicomponent. The formula for propane conversion rate is presented in Equation (3), in which C1is methane,is ethane,is ethylene,is propylene, andis propane. The selectivity of each constituent is calculated by Equation (4), and the propylene yield is calculated by Equation (5).
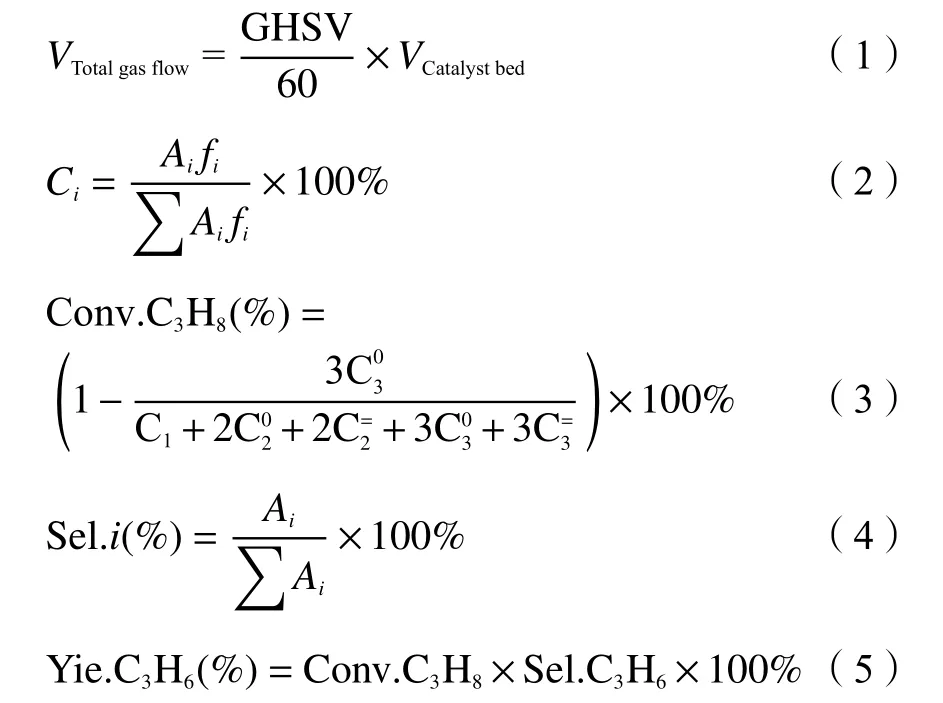
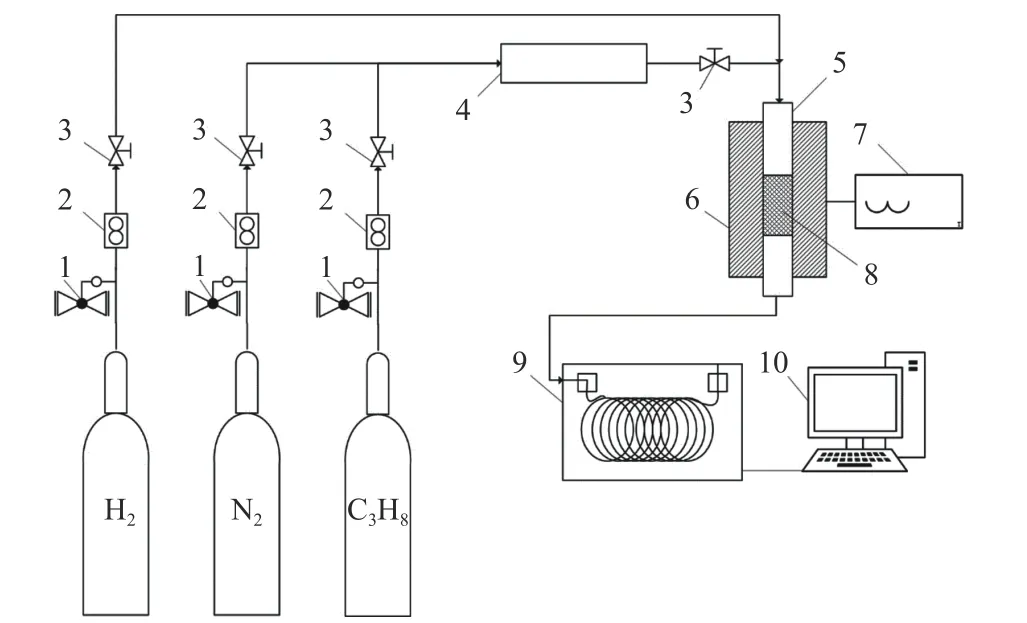
Figure 1 Schematic illustration of catalyst performance evaluation for propane dehydrogenation
2 Results and discussion
2.1 Catalyst characterization
As depicted in Figure 2, the characteristic diffraction peaks of HZSM-5 at 7.96°, 8.82°, 23.18°,23.99° and 24.45° are present in the XRD spectra of both HA molecular sieve and HZ-0 molecular sieve[21],indicating the crystal structure of the alkali-treated molecular sieve was not destroyed[22]. It could be attributed to the fact that sodium acetate is a weakly alkaline salt, thus has a relatively low degree of erosion on the skeletal structure of the carrier. The XRD spectrum of HZ-3.0 shows an obvious diffraction peak of Co3O4at 36.68°, which does not appear when the loading of Co is lower than 3.0%, which is due to the uniform distribution of cobalt species on the carrier surface. The morphological characteristics of the molecular sieve can be reflected by SEM characterization. As can be seen from Figure 3, the molecular sieve crystal morphology before treatment shows a hexagonal state with small particles of uniform size attached to the surface. After alkali treatment,layered sheets present on the surface of molecular sieve, which are still angular, and the attached particles change into clusters with different sizes. This is consistent with the XRD results, indicating that although the HZSM-5 crystals are partly damaged by alkali treatment, the basic morphology of the crystal still exists.
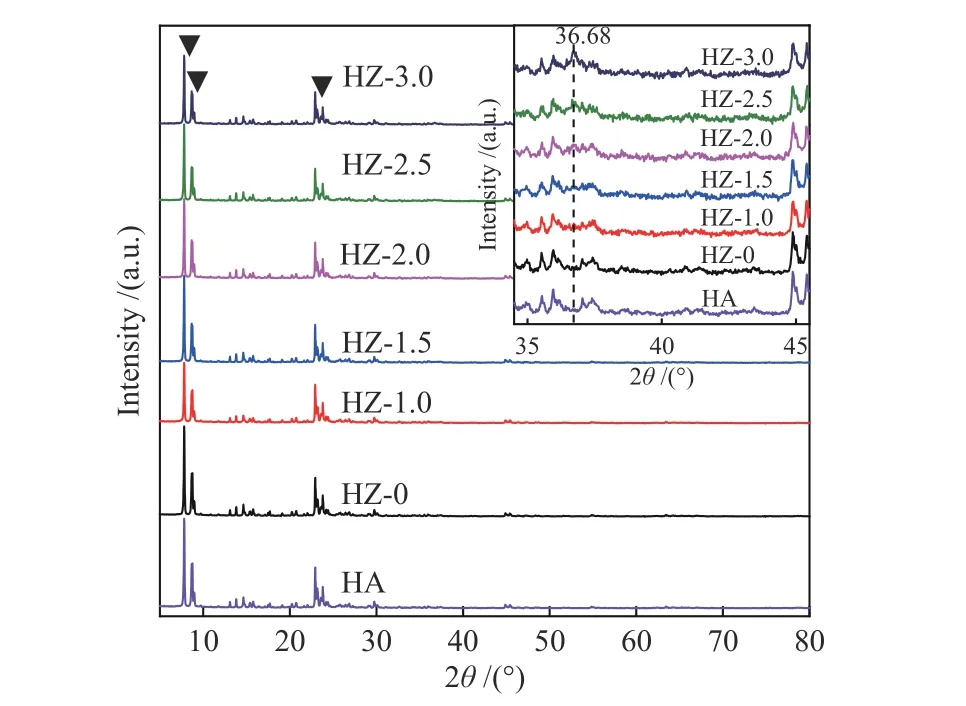
Figure 2 XRD patterns of HZSM-5 and samples with different Co loadings before and after alkali treatment
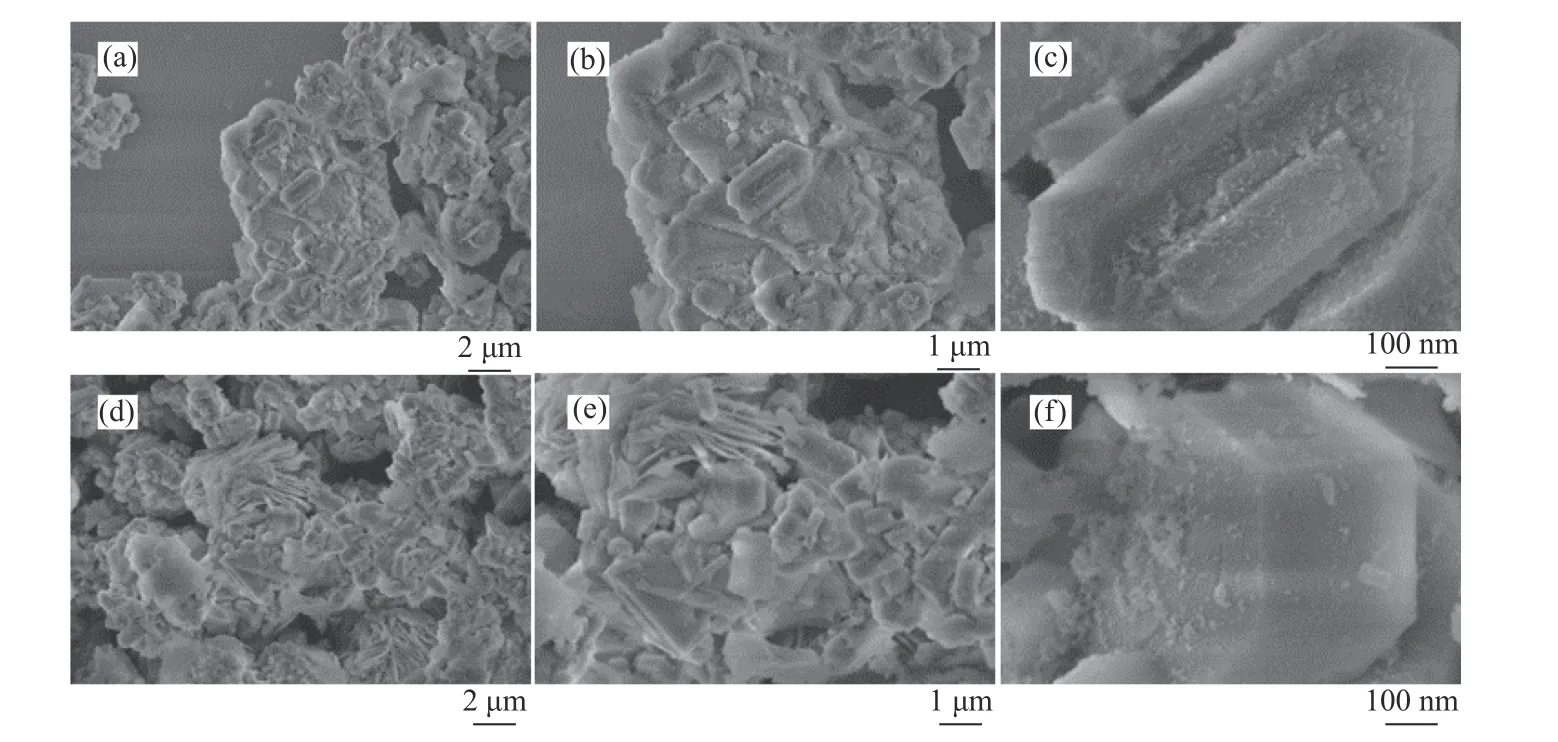
Figure 3 SEM images of molecular sieve before and after alkali treatment
Researches have indicated that the reduction of pure Co3O4is carried out in two steps (Co3O4-CoOCo)[23-25]. Figure 4 shows the spectra of H2-TPR for the HZ-xcatalysts. An asymmetric reduction peak at about 450 °C is referred to the first reduction step. This reduction peak is shifted towards higher temperature as compared to the reduction peak of pure Co3O4,presumably because the presence of some larger particles of Co3O4in the catalyst that makes the reduction more difficult[26]. The fainter reduction peak around 620 °C is classified as the second reduction step of Co3O4. In addition, when the loading was within 2.5%, the area of the reduction peaks increases significantly with the increasing Co loading and slightly shifted to the low temperature. This can be possibly attributed to the increased Co species that prompt the reduction and the reduced interaction force between Co species and the carrier. However, when the Co loading is up to 3.0%, the reduction peak appears in the range of 680-750 °C, because there is another Co species on the carrier which is difficult to be reduced in the dispersed state.
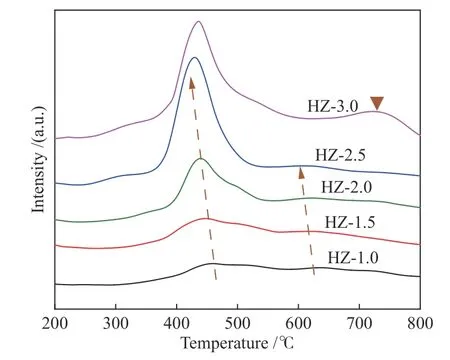
Figure 4 H2-TPR spectra of HZ-x catalyst
XPS was used to detect the chemical state of Co element in catalysts. Figure 5 shows the XPS spectra of Co 2pof Co/HZ-2.5 catalyst before and after reduction.It can be seen that, no metallic Co (Co0) species present in the fresh catalyst, but after being reduced a certain amount of Co0species generated, which is consistent with the H2-TPR results. The corresponding Co 2p3/2and Co 2p1/2binding energy for metallic Co are 778.1 and 793.3 eV[27], respectively. Co0species are known to be the active site of cracking reaction[28,29], and at high temperature it is more favorable for deep dehydrogenation of olefin molecules. As shown in Table 2, when the reaction temperature increases, the selectivity of methane and ethane rises drastically.When the reaction temperature was declined, the target product propylene was successfully generated.However, it is the decrease of the reaction temperature that makes the propane conversion to be relatively poor. The peaks at binding energy of 779.5 eV[30]and 795.9 eV were attributed to the Co3+ions in Co3O4[31],and a satellite peak of Co3+ions appears at 804.8 eV[32].Co2+is believed to be the active and selective species for propane dehydrogenation[28,33-36]. The position of the binding energy peak for Co 2p3/2and the satellite peaks around 786 and 803 eV suggest that the element Co is predominantly present as Co2+ions in the catalyst[27].The XPS spectrum of the reduced catalyst reveals a stronger characteristic peak for the Co2+satellites,which implies that the reduced catalyst contains more Co2+species. It is conjectured that the larger amount of both Co2+and Co0species in reduced catalyst enables the reaction to be carried out at low temperatures and maintain a certain degree of propylene selectivity. To confirm this, an in-depth analysis of the reaction mechanism is required.
The main purpose of treating HZSM-5 molecular sieve with low concentration of alkali solution is to reduce the acidity of the catalyst and change the silicaalumina ratio of the catalyst, when the change of acid strength and acid amount is mainly related to the nonskeletal aluminum[37]. The NH3-TPD results are shown in Figure 6, where M marks the NH3desorption peak corresponding to the weak acid center, and N marks the NH3desorption peak corresponding to the strong acid center.
From the NH3desorption curves of HA and HZ in Figure 6, it is observed that the acidity of the alkalitreated molecular sieve is weakened, the weak acid peak shifts to the low temperature region (150 °C), and the strong acid peak disappears. When the Co loading reaches 2.5% and 3.0%, the weak acid peaks show a shoulder peak at about 250 °C, attributed to the more acidic Co species that generated with the increasing Co loading. When the Co loading is higher than 3.0%, the weak acid site decreases and the strong acid center reappears at 450 °C, which is not beneficial to the reaction. When the Co loading was 1.0% and 1.5%,there is also a small amount of strong acid sites, which needs to be further investigated to be known.
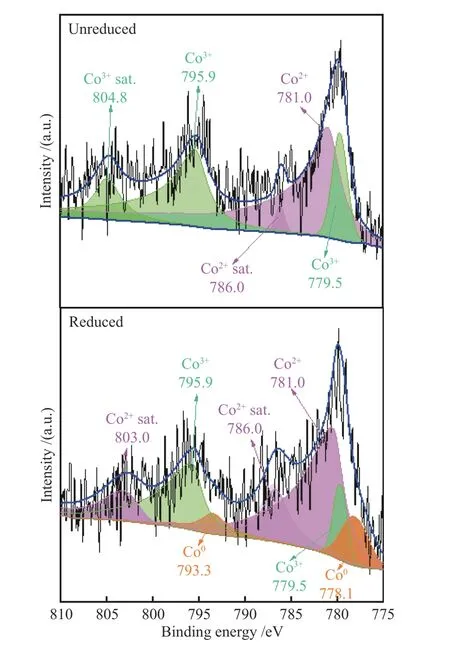
Figure 5 XPS profiles of HZ-2.5 catalyst before and after reduction
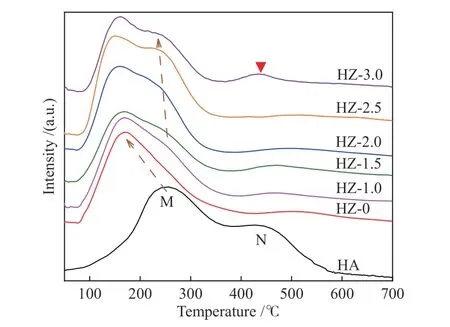
Figure 6 NH3-TPD patterns of HA and HZ-x catalysts
The pore structure of molecular sieve may be affected by Co loading[38]because pore structure is one of the main characteristics of molecular sieve[39].Figure 7 shows the adsorption-desorption isotherms of HZ-xcatalysts. It can be seen that all catalysts show type IV isotherm characteristics. H4-type hysteresis rings appear at thep/p0at 0.44-0.97, indicating the existence of mesoporous structures (2-50 nm) in samples. When the Co loading is 2.5% and 3.0%, the hysteresis rings are mainly concentrated in the range ofp/p0at 0.44-0.72, indicating that the generated mesopore size is more concentrated. In addition to this,it also suggests that the molecular sieve itself also has a partial mesoporous structure.
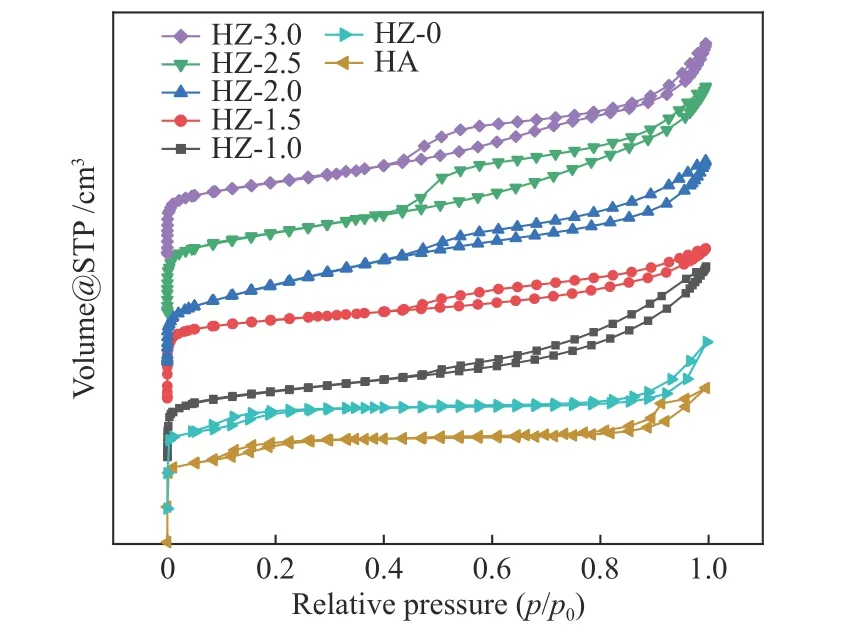
Figure 7 N2 adsorption-desorption isotherm of HA and HZ-x catalyst
The pore structure parameters of HZ-xcatalysts are listed in Table 1. Compared with the untreated molecular sieve, the total pore volume of the alkalitreated molecular sieve increased slightly, which proves that the alkali treatment has a pore-expanding effect on the molecular sieve. When Co was loaded on the molecular sieve, the pore volume of the mesopores increase and the pore volume of the micropores decline. This may due to the agglomeration of Co that creates some of the mesopores, or because the pore size is reduced by filling some of the mesopore channels[40,41]. This corroborates with the NH3-TPD characterization results. At a Co loading of 3.0%, the specific surface area and pore volume of the micropores decreased relative to that at a Co loading of 2.5%, presumably because as the Co loading increasing, the loaded Co species blocked some of the pore channels of the carrier.
2.2 Catalytic performance
The reaction temperature of propane dehydrogenation to propylene is generally in the range of 550-620 °C, which is, however, does not apply to our Co/HZ-xcatalysts. When the reaction temperature is above 500 °C, it gives a large amount of methane.Therefore, it is essential to examine the optimal process conditions for this reaction using the response surface methodology.
The response surface methodology is an optimization strategy that combines experimental design and modeling to find optimal conditions[36]. This method is based on the regression fitting of the process and a continuous variable surface model. It allows continuous analysis of each level of the experiment and more intuitive representation of the optimal value of the dependent variable, whereas orthogonal experiments are based on the design of a linear model[42]. Response surface methodology has been applied in many fields, including chemical industry,biology, pharmacology, engineering, etc[43].
2.2.1 Single-factor experiment
In this paper, the effects of three factors,temperature, Gas hourly space velocity (GHSV), and Co loading, on the reaction of propane dehydrogenation were investigated. Among them,temperature was explored in the range of 350-550 °C.GHSV was explored from 1500 to 7500 h-1, and Co loading was explored in the range of 1.0%-3.0% for a single-factor investigation. All the samples were pretreated by H2at 600 °C for 1 h, and then reacted for 2 h.
Based on previous researchers, we chose GHSV=4500 h-1and Co loading of 2.0% to investigate the effect of reaction temperature on propane dehydrogenation and to determine the scope of temperature factor in response surface method. As shown in Table 2, the propylene yield reached the maximum when the reaction temperature was 450 °C.When the temperature was 550 °C, the selectivity of propylene dropped sharply, accompanied by the production of a large number of by-products. When the reaction temperature was 350 °C, however, the propane conversion is less than desirable. Propane dehydrogenation to propylene is a heat-absorbing process, and is limited by the thermodynamic equilibrium. Therefore, the reaction temperatures of 400, 450 and 500 °C were chosen for the response surface examination.

Table 2 Influence of reaction temperature on propane dehydrogenation performance
Table 3 presents the effect of different GHSV on the reaction of propane dehydrogenation. From the table, the propylene yield reached the maximum when GHSV was 4500 h-1. When GHSV is too large, higher GHSV values, e. g. 6000 and 7500 h-1, lead to the shortening of the residence time of the reactants on the catalyst surface, which will significantly reduce the propane conversion. Therefore, GHSV of 3000, 4500,and 6000 h-1were chosen for the response surface investigation.

Table 3 Influence of GHSV on propane dehydrogenation performance
Table 4 shows the effect of different loadings on the reaction of propane dehydrogenation. From the table, the selectivity and yield of propylene reached the maximum when the Co loading was 2.5%. Co loadings of 2.0%, 2.5% and 3.0% were chosen for the response surface examination.

Table 4 Influence of Co loading on propane dehydrogenation performance
2.2.2 Selection of factor levels for response surface experiments
The results of single-factor experiments were integrated. The Box-Behnken model was selected according to the response surface method using Design Expert 8.0 software.Athree-factor, three-level experimental design was carried out for the process conditions of Co/HZSM-5 catalyst, with reaction temperature (A), GHSV (B), and Co loading (C) as the main investigating factors and response variables, and propylene yield (D) as the response value.Amathematical regression model was thus established.Experimental factors and level range data are shown in Table 5.

Table 5 Experimental design of three factors and three levels of response surface method
WithA,BandCas response variables, andDas the response value, the propane dehydrogenation to propylene experiment was proposed. Pre-reduction by H2for 1 h was firstly conducted and followed by reaction for 2 h. The results are shown in Table 6, in which five central points were used to do repeated experiments to estimate the experimental error. The response surface analysis software Design-Expert 8.0 was employed to perform multiple regression date analysis in Table 7.
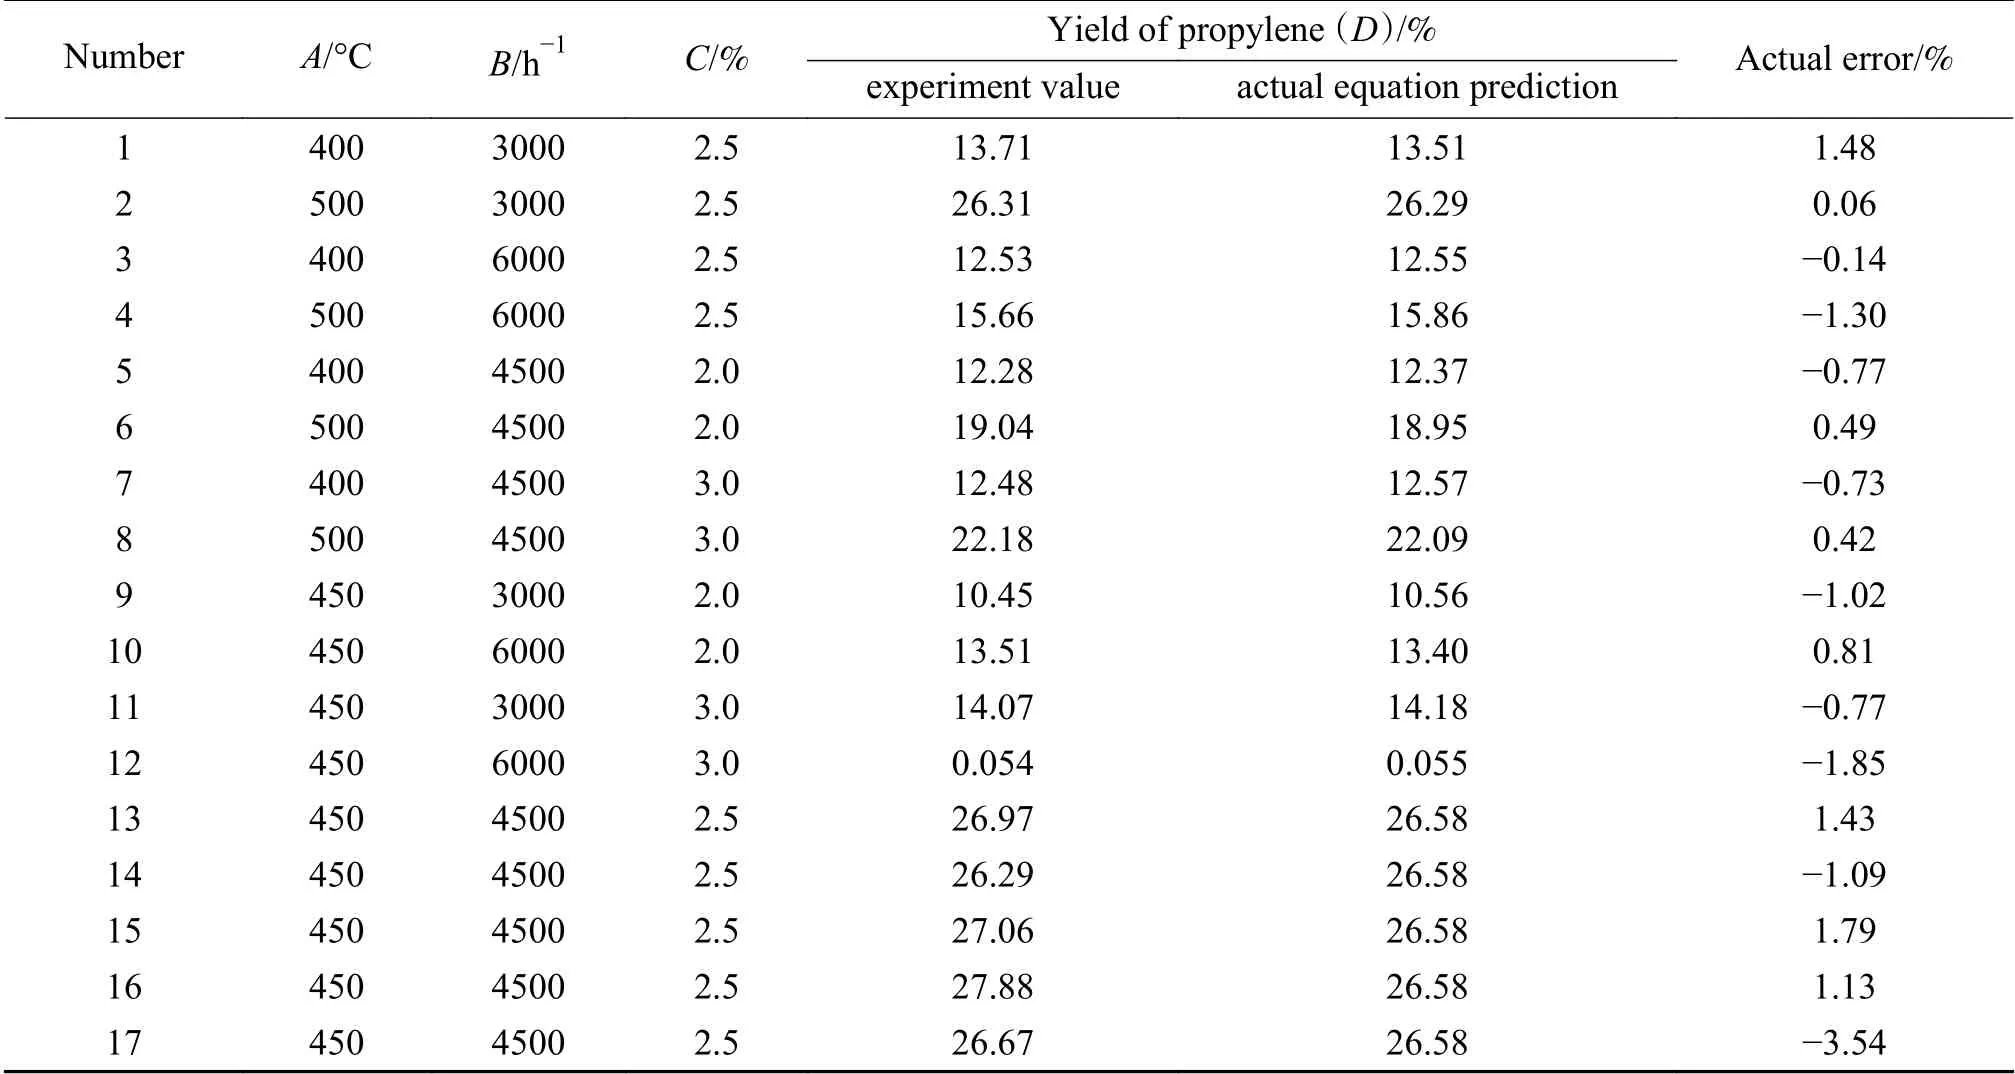
Table 6 Box-Behnken response surface experimental design and results

Optimization was performed manually to remove the insignificant termsA2BandAB2, in terms of establishing a ternary cubic response surface model,and the actual factors were calculated to obtain the final equation in Equation (5).
As can be seen from Table 6, the error range between the experimental values and the predicted values of the actual equation obtained from the regression is (-3.54%)-1.79%; the degree of deviation between the actual and predicted values ofDunder the three-factor condition obtained from the experiment[44].
From the ANOVA results in Table 7, it is clear that the model has a high significance (p< 0.0001)withF= 382.36, indicating high reliability of the model[45]. In the experimentally range, the importance of the three factors on theD-value of propylene yield was: reaction temperature, GHSV, and Co loading.
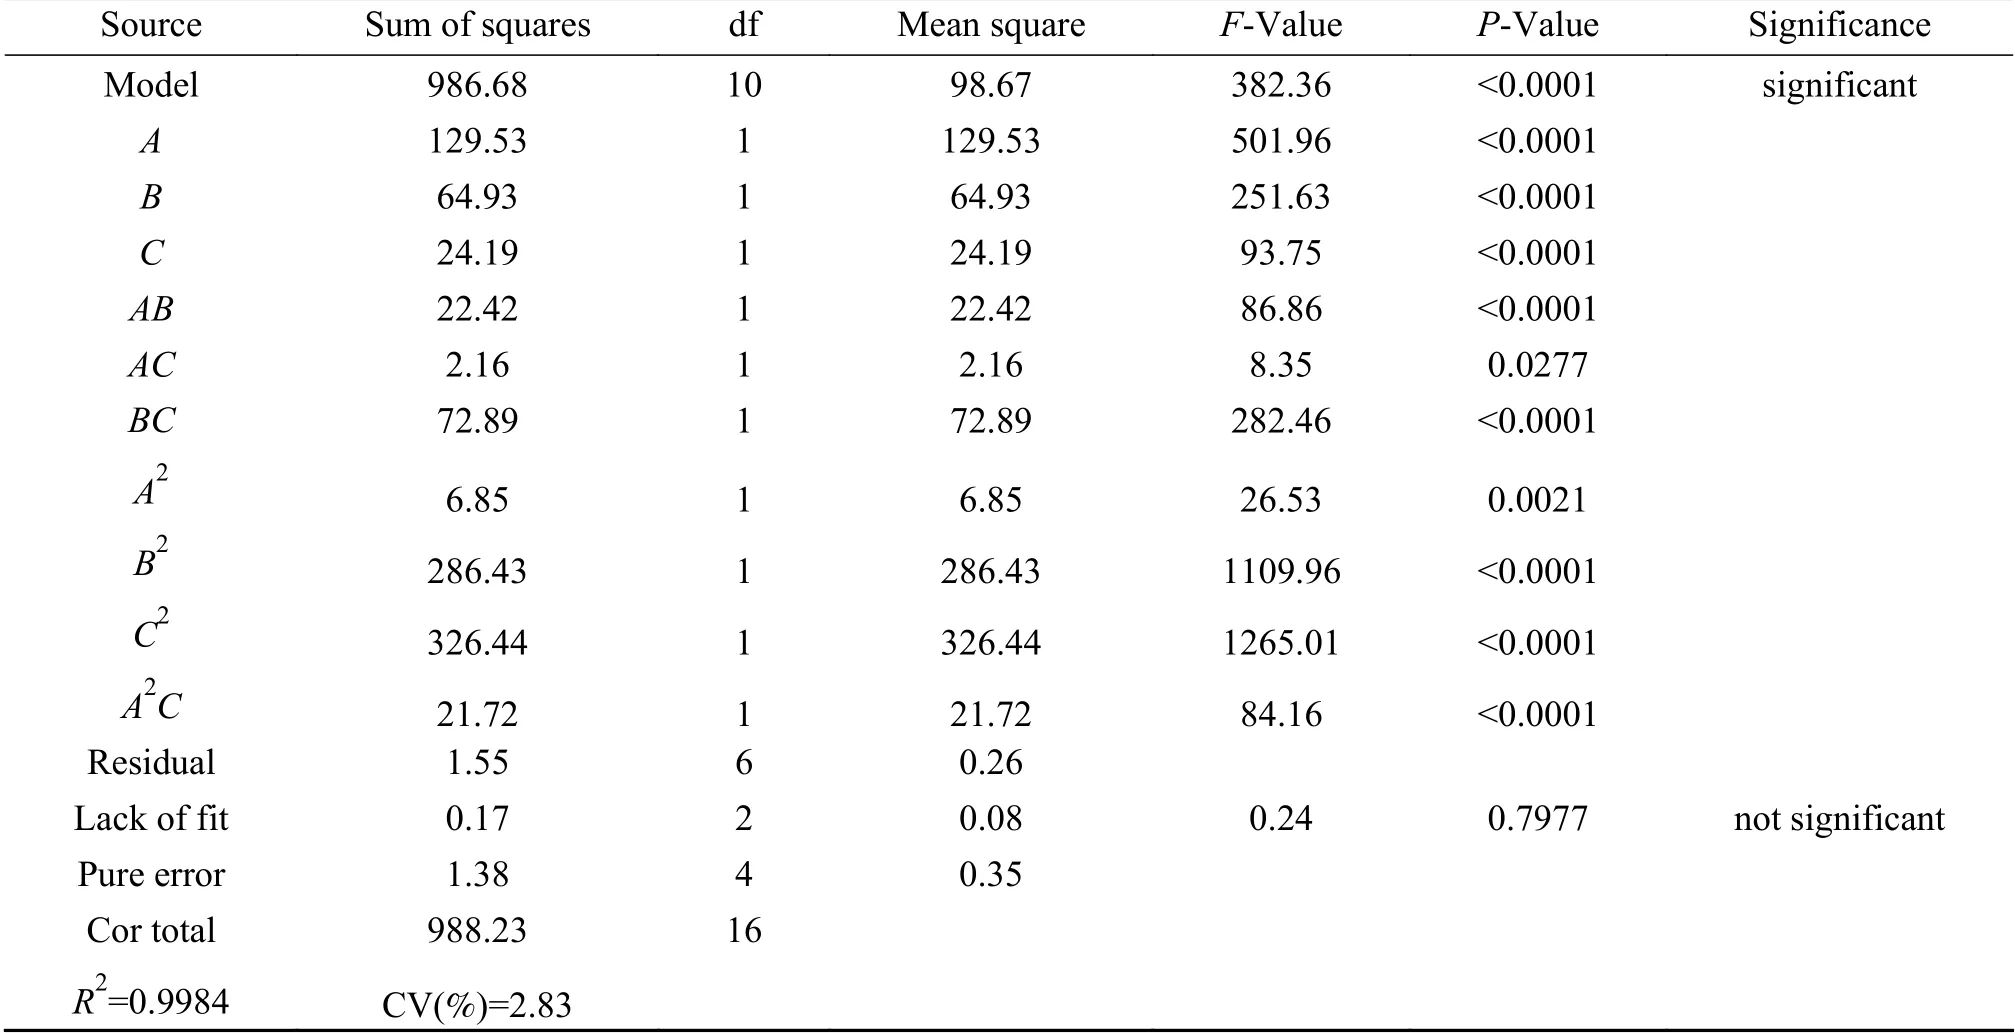
Table 7 Analysis of variance (ANOVA)
And the order of influence of the interaction between the factors on theD-value of propylene yield was:BC>AB>AC. The model misfit termP= 0.7977,indicating that the misfit caused by the error was not significant, and the model coefficient of determinationR2= 0.9984, explaining that the correlation between predicted and measured values is good. As a consequence, this experimental method is more reliable with a low coefficient of variation (CV 2.83%), the experimental model has high accuracy and good stability.
2.2.3 Model analysis
Figure 8 displays the response surface contour plot and response 3D plot of each factor on theDvalue, which reflects the effect of the interaction of each factor on the response value. The denser contours and greater slope of the fitted surface the more significant effect of this factor[46]. From Figure 9,presents relatively sparse contours and gentle slope of the response surface compared to Figure 8, indicating the least effect between reaction A and C on the propylene yield. Contrarily, Figure 10 the densest contours and largest slope of the fitted curve illustrate that the interaction between B and C has the greatest effect on D.
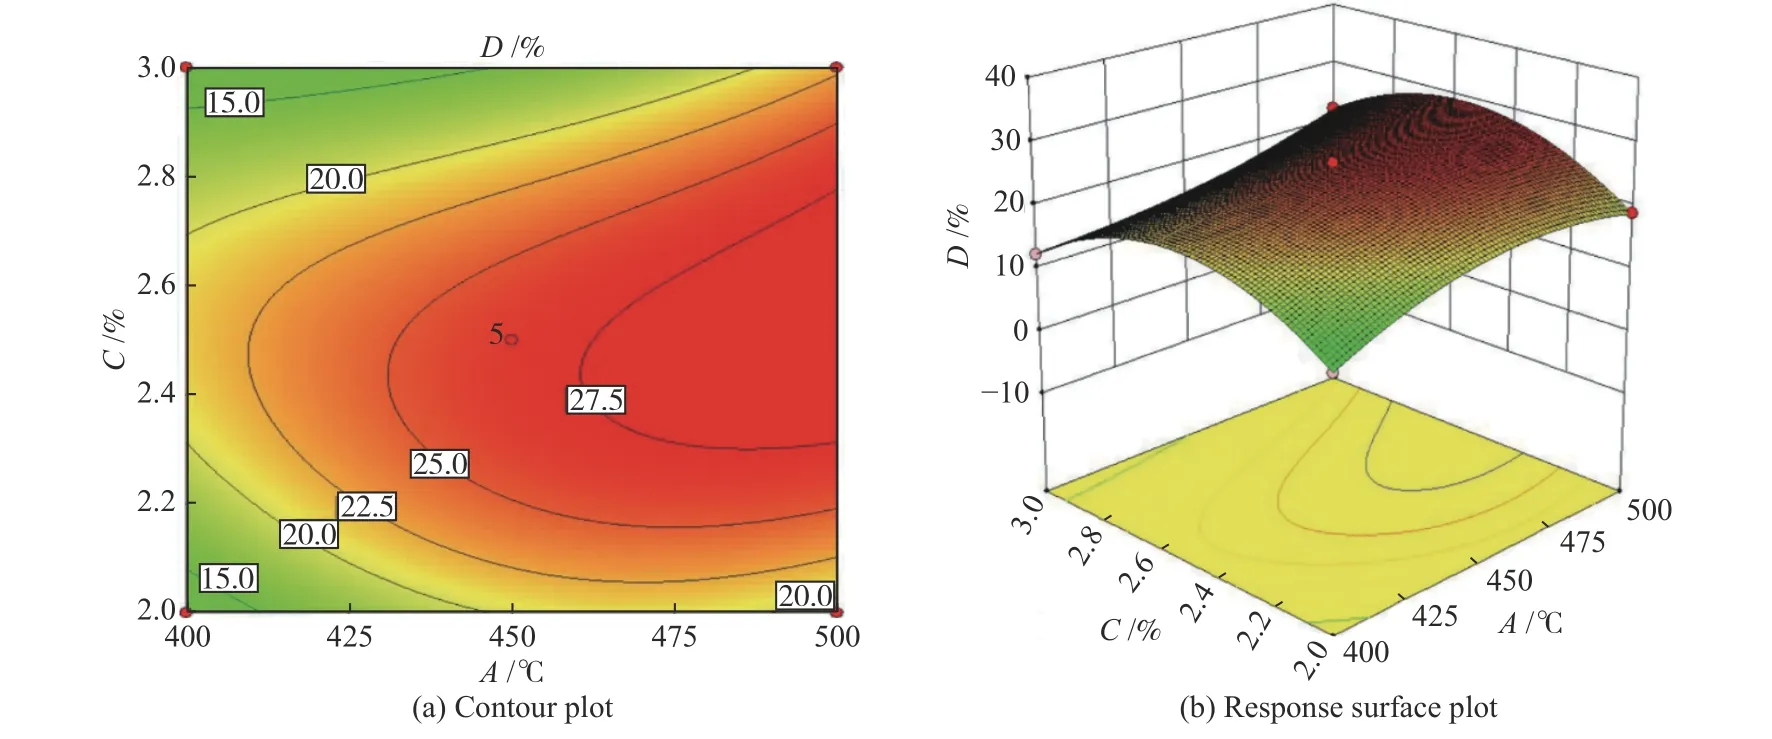
Figure 8 Contour map and response surface plotted on reaction temperature and GHSV
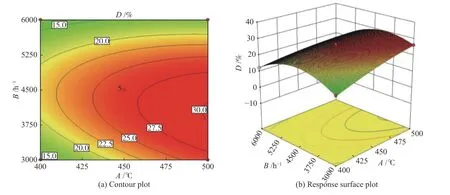
Figure 9 Contour map and response surface plotted on reaction temperature and Co loading

Figure 10 Contour map and response surface plotted on GHSV and Co loading
2.2.4 Prediction and verification of optimal process conditions
The optimal process conditions were analyzed using Design-Expert 8.0 software. It was found that the reaction temperature of 461.11 °C, GHSV of 4388.89 h-1,and Co loading of 2.43% were the optimal process parameters in this study. And theDvalue (propylene yield) was predicted theoretically by this model as 27.696%. Applying to the actual situation, the model was revised to a reaction temperature of 461 °C, a GHSV of 4300 h-1, and a Co loading of 2.4%, at which the D value was predicted as 27.666%. Three sets of parallel validation experiments were conducted, and the results are shown in Table 8.

Table 8 Experimental and predicted values of optimal process parameters
3 Conclusions and outlook
The effects of three factors, reaction temperature,GHSV, and Co loading, on the dehydrogenation of propane to propylene were investigated, and the order of significance is: reaction temperature (A) > GHSV(B) > Co loading (C). Among them, the interaction of GHSV and Co loading was the most significant on the propylene yield (Dvalue).
The response surface method was used to investigate the process conditions of the Co/HZSM-5 catalyst for propane dehydrogenation, adopting a ternary cubic response surface model, and the final equation (Eq. (1)) was obtained by calculating the actual factors. Referring to the optimal process conditions given by the design and combining with the actual situation, a group of parameters were obtained:the reaction temperature was 461 °C, the GHSV was 4300 h-1, the Co loading was 2.40%. Three sets of parallel experiments were conducted under these conditions, and the obtained the propylene yields were in good agreement with the predicted values.
When the Co/HZSM-5 catalyst was used for the propane dehydrogenation to propylene reaction, it had the advantage that the temperature used (461 °C) was lower than that used by other catalysts (520-620 °C). On the basis of the experimental results, there is a preliminary assumption that the presence of a large number of active sites, Co2+and a small amount of Co0,may have enabled the reaction to proceed at low temperatures with high selectivity for propylene. The real mechanism is more complicated and will be explored in depth to facilitate the modification of the catalyst to improve the yield of propylene.

