Optical study on topological superconductor candidate Sr-doped Bi2Se3
Jialun Liu(刘佳伦) Chennan Wang(王晨南) Tong Lin(林桐) Liye Cao(曹立叶) Lei Wang(王蕾)Jiaji Li(李佳吉) Zhen Tao(陶镇) Nan Shen(申娜) Rina Wu(乌日娜) Aifang Fang(房爱芳)Nanlin Wang(王楠林) and Rongyan Chen(陈荣艳)
1Center for Advanced Quantum Studies and Department of Physics,Beijing Normal University,Beijing 100875,China
2International Center for Quantum Materials,School of Physics,Peking University,Beijing 100871,China
3Collaborative Innovation Center of Quantum Matter,Beijing 100871,China
Utilizing infrared spectroscopy,we study the charge dynamics of the topological superconductor candidate SrxBi2Se3.The frequency-dependent reflectivity R(ω) demonstrates metallic feature and the scattering rate of the free carriers decreases with temperature decreasing. The plasma edge shows a slight blue shift upon cooling, similar to the behavior of CuxBi2Se3. As the carrier concentration n obtained by Hall resistivity increases slightly with the decreasing temperature,the effective mass is proved to increase as well, which is in contrast with that of CuxBi2Se3. We also perform the ultrafast pump-probe study on the Sr0.2Bi2Se3 compounds. Resembling its parent compound Bi2Se3,three distinct relaxation processes are found to contribute to the transient reflectivity. However,the deduced relaxation times are quite different. In addition,the electron-optical-phonon coupling constant is identified to be λ =0.88.
Keywords: topological superconductor,infrared spectroscopy,ultrafast spectroscopy
1. Introduction
In recent years,topological superconductors(TSCs)have attracted a great deal of attention due to their great significance in both fundamental research and potential application in quantum computing.[1–9]A TSC can have a full gapped superconducting bulk state together with a topologically protected gapless surface state. Majorana quasiparticles, which is crucial to the future fault-tolerant quantum computer, are believed to exist in the surface state of TSCs.[10]Up to date,searching for TSC materials is still an important task since there are only a few candidates discovered.
In 2010,Horet al.[11]found that superconductivity could be realized in the layered topological insulator Bi2Se3by Cu intercalation. The obtained CuxBi2Se3was soon proposed to be a topological superconductor with a full gap and an oddparity paring symmetry by theoretical calculation.[3,12]Experimentally, a zero-bias conductance peak expected for a topological superconductor was observed by point-contact spectroscopy, possibly due to Majarona fermions.[13]Although a scanning tunneling microscope measurement suggests that CuxBi2Se3is a conventional s-wave superconductor,[14]further investigations demonstrate that it is more likely to be caused by an odd-parity superconductivity with a cylindrical Fermi surface.[15]More importantly, a twofold symmetry of the superconductivity is broadly identified by a large number of angle-resolved experiments in spite of its threefold symmetric lattice,which provides strong bulk evidence on the topological superconductivity.[16,17]Similar behaviors are revealed in the Sr[18–23]and Nb[3,24–26]doped Bi2Se3as well, and this spontaneous rotational-symmetry breaking or nematicity was found to persist even above the superconducting transition temperature in SrxBi2Se3,inferring the underlying connection between nematicity and unconventional superconductivity.
So far, there are still a lot of controversial issues in understanding the superconductivity inMxBi2Se3(M=Cu, Sr,and Nb). Among them, CuxBi2Se3is very sensitive to air and intrinsically inhomogeneous, so it has a rather low superconducting volume fraction (~56%).[27]In contrast, the SrxBi2Se3compound exhibits excellent stability in air[28]and has a much larger shielding volume fraction (~91.5% at 0.5 K),[29]therefore it is more extensively studied. Additionally, although SrxBi2Se3hosts the lowest carrier density (~1019cm-3), its superconducting phase transition temperature(~2.9 K)[28,30]is very close to that of CuxBi2Se3(~3.8 K)[11]and NbxBi2Se3(~3 K). In this paper, we use infrared spectroscopy and ultrafast pump-probe technique to study the optical responses of SrxBi2Se3in both equilibrium and nonequilibrium state.We find a very slight blue shift of the plasma edge, which is associated with the simultaneous variation of the concentration and effective mass of the itinerate carriers.In addition, the electron-phonon coupling strength is yielded by our time resolved measurements.
2. Experimental
Single crystals of SrxBi2Se3for nominal concentrationsx= 0.20 were synthesized by the flux method.[28]The obtained crystals were easily cleaved with a silvery shining mirror-like surface. The typical dimensions of the obtained single crystals are about 3×2.5×0.5 mm3, as shown in the inset of Fig.1(a). The x-ray diffraction(XRD)measurements were conducted along the basal plane and the results are shown in Fig.1(a),which indicate the samples are of high purity and the surface is along the(00l)plane.
The temperature-dependent resistivityρ(T)and magnetizationMwere measured in a Quantum Design physical property measurement system(PPMS),as shown in Figs.1(b)and 1(c).The resistivityρ(T)decreases with temperature decreasing in the normal state.It begins to drop dramatically at around 2.85 K and approaches zero at around 2.6 K, remarking the superconducting phase transition. A diamagnetic signal was observed in the magnetic susceptibility at the same time. The large residual resistivity value of~110 and the narrow superconducting transition width both indicate the high quality of our single crystalline samples. Hall effect measurements were also performed in the PPMS with the temperature ranging from 300 K to 2 K in perpendicular magnetic fields up to±9 T. In the case that the orientation of the Hall electrode is not applied strictly perpendicular to the direction of the current in the basal plane of Sr0.2Bi2Se3single crystals,the Hall resistivity is defined asρxy=[ρxy(+B)-ρxy(-B)]/2, whereρxy(+B)andρxy(-B)are the Hall resistance measured by increasing and decreasing the magnetic fields,respectively.
Infrared spectroscopic studies were performed on the asgrown shinny surfaces of Sr0.2Bi2Se3single crystals with a Bruker IFS 80V in the frequency range from 30 to 25000 cm-1and as a function of temperature. In the measurement of frequency-dependent reflectivityR(ω), either gold or aluminum coating techniques are adopted in order to eliminate the impact of microscopic surface textures of the single crystalline compound. The real part of the optical conductivityσ1(ω)is derived through the Kramers–Kronig transformation of the reflectivityR(ω), which is extrapolated by a Hagen–Rubens relation to zero at the low frequency end, and x-ray scattering functions[31]for the high energy extrapolations.
Ultrafast optical pump-probe spectroscopy of Sr0.2Bi2Se3was performed between 4 and 150 K.In this study,we used a femtosecond Ti:sapphire amplifier as the light source for probe beam,which can produce an 800 nm pulsed laser at 1 kHz repetition. The pump beam with a wavelength of 400 nm is obtained through the ultraviolet frequency doubling BBO crystal.The 100 fs time duration of the laser pulses enables ultrashort time-resolved measurement. The pump intensity was set to be~2 μJ/cm2and the probe intensity was 10 times lower.

Fig. 1. (a) XRD pattern of Sr0.2Bi2Se3 single crystal. The inset is a photo of the single crystal. (b) The resistivity ρ(T) as a function of temperature in the range of 1.8–3.4 K.The inset shows the resistivity ρ(T)as a function of temperature in the 0–300 K range.(c)Magnetization M as a function of temperature in the 0–20 K range.
3. Results and discussion
The frequency-dependent reflectivityR(ω) is displayed in Fig. 2(a). It can be seen thatR(ω) approaches unit at low frequencies and increases with decreasing temperature in the far infrared region,showing a typical metallic response.As the frequency increases,R(ω) drops rapidly and reaches a minimum around 790 cm-1at 300 K, which is usually called a“screened” plasma edge. The sharpness of the plasma edge indicates a good metallic property while the small edge minimum corresponds to a low carrier density. According to a previous report,[32]the reflectivity of Bi2Se3and CuxBi2Se3displays plasma edges as well. Their edge minima locate at around 550 cm-1and 1150 cm-1, respectively. The intermediate value for Sr0.2Bi2Se3obtained in our measurements demonstrates that the Sr intercalation has indeed introduced free carriers into the parent compound Bi2Se3,but not as much as Cu doping.
As shown in Fig. 2(b), the real part of the optical conductivityσ1shows a Drude component at the low energy range, reflecting the metallic nature of Sr0.2Bi2Se3. The zero-frequency conductivity increases upon cooling, consistent with the behavior of the resistivityρ(T). Moreover, the Drude component becomes more sharp as temperature decreases, indicating the reduction of the scattering rate of free carriers. To qualitatively study the evolution of the physical properties,we decompose the real part of the optical conductivityσ1according to the Drude–Lorentz model:

whereωpandγDare the plasma frequency and scattering rate of the itinerate carriers, whileωj,γjandSjare the resonant frequency,damping and strength of thejth Lorentz oscillators,respectively. The first term on the right-hand side of Eq.(1)is the Drude component modeling intraband transitions of free electrons while the second Lorentz term describes interband transitions across energy gaps.
A representative example of the fitting results ofσ1(ω)at 10 K is plotted in the inset of Fig. 2(b), where one Durde and four Lorentz terms are employed. The four interband transitions,centered at 5300 cm-1,8000 cm-1,12640 cm-1,and 23920 cm-1,are basically temperature independent. It is worth noting that these four Lorentz peaks located very closely to that of CuxBi2Se3,which suggests that the band structure of the parent compound Bi2Se3is quite stable against doping,providing a solid platform to realize topological superconductivity.

Fig. 2. (a) Reflectivity of Sr0.2Bi2Se3 single crystals in the frequency range of 0–1500 cm-1 at different temperatures. The inset shows the reflectivity in the frequency range of 0–25000 cm-1. (b) The real part of the optical conductivity σ1 and (c) the energy loss function Im[-1/ε(ω)] of the Sr0.2Bi2Se3 single crystal. The inset of (b) shows the real part of the optical conductivity σ1 in the frequency range of 0–25000 cm-1 at different temperatures.
Shifts of plasma frequency were also observed in the Bi2Se3and CuxBi2Se3materials. Bi2Se3shows a red shift and CuxBi2Se3exhibits a blue shift with temperature decreasing. The redshift of Bi2Se3was ascribed to the decreasing carrier density, which is caused by the reduction of thermal excitations. However,Hall experiments reveal that the carrier density of CuxBi2Se3remains unchanged with temperature decreasing,[8]so Tao and coauthors attributed its blueshift to the reduction of effective mass,induced by the shift of Fermi level relative to the band structure. In order to verify whether the blueshift of SrxBi2Se3shares a similar underling mechanism with CuxBi2Se3,we performed the Hall resistivity measurement on SrxBi2Se3.
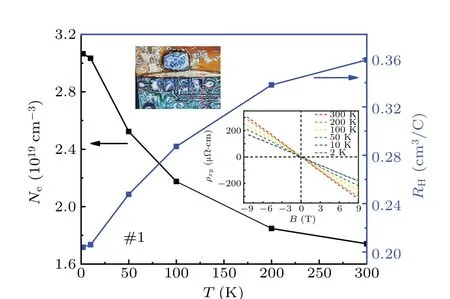
Fig. 3. The carrier concentration and Hall coefficient versus temperature. The upper inset is a photograph of the sample and the lower inset shows its Hall resistivity versus applied magnetic field at different temperatures.

Now that we know the values of carrier concentrationnand the screened plasma frequencyω′p,the evolution of effective massm*with temperature could be obtained. The ratio ofm*from 300 K to 10 K is estimated to be about 0.625,which indicates an increase ofm*upon cooling. By comparison,the effective mass of CuxBi2Se3was reported to decrease fromm*=0.4215meat 300 K tom*=0.3888meat 10 K, which was ascribed to the change of dispersion nearEF. Adopting a plasma frequencyωp= 1674 cm-1and a carrier densityn= 3.03×1019cm-3, the effective mass of Sr0.2Bi2Se3at 10 K is calculated to be 0.970me, which is much larger than the value of CuxBi2Se3. As the carrier density of Sr0.2Bi2Se3is very close to that of Bi2Se3and much smaller than that of CuxBi2Se3, the Fermi level of SrxBi2Se3is supposed to be much closer to that of Bi2Se3. Especially, the effective mass of Sr0.2Bi2Se3nearly approached the static electron massmeat 4 K,suggesting that the Fermi level locates near a parabolic band. Considering that there are multiple conduction and valence bands near the Fermi level located at different momentum positions in the Brillouin zone,there may be a thermal redistribution between bands with different effective masses,as proposed by Parket al.[33]The differences between SrxBi2Se3and CuxBi2Se3reveal the complexity of the band structure near the Fermi level.
In order to get more information about the bulk band structure of Sr0.2Bi2Se3, we also performed ultrafast pumpprobe measurements. Figure 4(a) shows the photoinduced reflectivity ΔR/Rin long (main panel) and short (inset)timescales at room temperature. Its overall profile highly resembles that of the parent compound Bi2Se3.[34,35]First of all,two strong oscillations could be resolved. The slow one with a frequency lower than 0.1 THz is almost temperature independent and most likely resulted from the coherent longitudinal acoustic phonons. The second fast oscillation located atωfast=2.17 THz at room temperature,which is slightly higher than that observed in Bi2Se3(2.15 THz), inferring the structure modulation caused by the Sr intercalation. Furthermore,a very gentle softening ofωfastwith temperature increasing is illustrated in Fig.4(c),owing to the thermal effect.

Fig. 4. (a) The transient reflectivity ΔR/R of Sr0.2Bi2Se3 at room temperature over long (main panel) and short (inset) timescales. (b) The fitting results of ΔR/R at 4 K.The black and red solid line represent the experimental and fitting data,respectively. The three dotted lines are the three exponential functions used for fitting. The red arrow marks the kink shown in the rising edge. (c)The frequency of the fast oscillation as a function of temperature.
The transient reflectivity ΔR/Rdisplays a sharp rise persisting until 0.5 ps, which is much longer than most conventional semiconductors and metals(~300 fs).[36]According to the two-temperature model, this process is usually governed by the thermalization of carriers through electron–electron interactions.[37,38]Especially,a kink can be resolved at around 0.3 ps,indicating more than one relaxation channels. Following the procedure used to deal with the parent compound,[34]we find that the non-oscillating part of our data can be well reproduced by three-exponential decay as well. The fitting results at 4 K are shown in Fig.4(b).
Similar to Bi2Se3, one negative amplitudeA2and two positive amplitudesA1andA3are yielded by fitting. The first (third) relaxation channel is assigned to be governed by the couplings between the excited quasiparticles and optical (acoustic) phonon modes in Bi2Se3, whereas the second one is suggested to be related to the defect-induced charge trapping.[34]Here, we believe these three channels work for Sr0.2Bi2Se3as well,due to their remarkable similarity. However, the corresponding relaxation times of Sr0.2Bi2Se3are identified to beτ1= 0.095±0.01 ps,τ2= 0.15±0.02 ps,andτ3=0.80±0.05 ps, which are quite different from the values for the parent compound (τ1=0.11±0.02 ps,τ2=0.32±0.03 ps, andτ3=2.3±0.2 ps). It is worth remarking that the fitting values of the parameters depend partly on the choices of initial values,and the above results are the best outcome we could obtain.
In time-resolved ultrafast spectroscopy, it is well known that the thermal relaxation rate (γT= 1/τ) for the excited quasiparticles returning back to local equilibrium state via electron-phonon interaction satisfiesγT=3¯hλ〈Ω2〉πkBT,[38,39]whereλis the electron–phonon coupling constant, andΩis the phonon frequency, andkBis the Boltzmann constant, andTeis the electron temperature after photo-excitation. Since the relaxation timesτ1andτ3are mainly determined by the electron-phonon coupling process, their smaller values compared to the parent compound indicate that both the electron–optical-phonon coupling and electron–acoustic-phonon coupling are enhanced by the Sr doping, which agrees well with the results of Raman measurements.[40]At the same time,Sr doping will introduce more defects into the system,which may probably lead to decrease ofτ2.
Since the fast oscillation observed in our measurement is very close to the optical A1gmode,[40–42]we can obtain the electron-optical phonon coupling constant by adoptingΩ1=2.22 THz at 4 K. The quasiparticle temperatureTecould be calculated by

4. Conclusion
In summary, we have performed infrared spectroscopy and ultrafast time-resolved optical spectroscopy on the topological superconductor candidate Sr0.2Bi2Se3. The equilibrium optical response of Sr0.2Bi2Se3is characterized by a slight blue shift of the plasma frequency with temperature decreasing. As the carrier density is demonstrated to increase upon cooling by Hall measurements, the effective mass is proved to show a similar trend, which is different from the behavior of CuxBi2Se3. Since the Fermi level of Sr0.2Bi2Se3is lower than that of CuxBi2Se3and closer to the conduction band minimum, we believe this difference is caused by the complex band structure near the Fermi level. Our nonequilibrium measurements reveal three relaxation channels in SrxBi2Se3, similar to the spectra of its parent compound Bi2Se3. However,the relaxation times are quite different due to the change of electron-phonon coupling strength and introduction of defected by Sr doping. We also obtain the electronoptical-phonon coupling constantλ=0.88.
Acknowledgements
Project supported by the National Natural Science Foundation of China (Grant Nos. 12074042 and 11704033), the National Key Research and Development Program of China(Grant Nos. 2021YFA1400400 and 2016YFA0302300), and the Fundamental Research Funds for the Central Universities.
- Chinese Physics B的其它文章
- A design of resonant cavity with an improved coupling-adjusting mechanism for the W-band EPR spectrometer
- Photoreflectance system based on vacuum ultraviolet laser at 177.3 nm
- Topological photonic states in gyromagnetic photonic crystals:Physics,properties,and applications
- Structure of continuous matrix product operator for transverse field Ising model: An analytic and numerical study
- Riemann–Hilbert approach and N double-pole solutions for a nonlinear Schr¨odinger-type equation
- Diffusion dynamics in branched spherical structure

