
Direct Radiative Effects of Dust Aerosols over Northwest China Revealed by Satellite-Derived Aerosol Three-Dimensional Distribution
2022-11-07 05:33:16RuiJIAYuzhiLIUYanLIJunLIXiaolinHURongluGAOYunfeiTIANYanlingSUNNannanMUandMinfenZHAO
Rui JIA, Yuzhi LIU, Yan LI, Jun LI*, Xiaolin HU, Ronglu GAO, Yunfei TIAN, Yanling SUN,Nannan MU, and Minfen ZHAO
1 Collaborative Innovation Center for Western Ecological Safety, Lanzhou University, Lanzhou 730000
2 Zibo Meteorological Bureau, Zibo 255000
3 Shandong Meteorological Service Center, Jinan 250000
ABSTRACT
Key words: aerosol three-dimensional distribution, direct radiative effect, Northwest China
1. Introduction
Northwest China is located in the interior of the Eurasian continent. The dry climate, intensive evaporation, and scarcity of rainfall make the ecosystem fragile and sensitive (Zhao and Wu, 2013), which is vulnerable to climate change (Wang and Zhao, 2001). Over the past century,the global average temperature has shown an upward trend and the “global warming hiatus” observed in the past decade has faded away (Zhang et al., 2019). With drought as the main climatic background, Northwest China is a certain region that responds significantly to global warming and its temperature increases considerably higher than that of East China and the global average (Wei and Wang, 2013). Climate change is varying the temporal and spatial patterns of soil moisture and water resource availability (Zhang et al., 2010) and affecting the agricultural productivity (Zhang et al., 2008). The expansion rate of semiarid regions in China is nearly 10 times of those in arid and semihumid regions (Huang et al., 2019). Climate change and ecological environment evolution in this region have attracted widespread attention (Jiang et al., 2009; Huang et al., 2010, 2014; Ma et al., 2018).
Despite the center stage of greenhouse gases in global warming discussion, it is known that aerosols also play a crucial role in climate change, which is more localized.Compared with the slow warming and persistent greenhouse effect, the local forcing and internal feedback process caused by aerosol may play a significant role in the faster warming, drying, and glacier retreat (Kang et al.,2010; Lau et al., 2010; Lee et al., 2013; Shi et al., 2021).Aerosols emitted by urban industries are sufficient to play an important role in the mesoscale weather system,and they are enough to induce large-scale changes in temperature, wind pattern, and precipitation distribution(Kawecki et al., 2016). Weather-related factors (e.g.,winds, precipitation, and underlying surface conditions)can directly affect the formation and outbreak of dust storms (Shen et al., 2010), while aerosols floated in the air can change the thermal structure of atmosphere, and affect the cloud development and precipitation process(through direct, indirect, and semidirect radiative effects)by contrast (Chen et al., 2011; Huang et al., 2014; Jiang et al., 2018).
Northwest China belongs to an arid and semiarid climate zone, a critical landscape for dust emission and transport in Asia (Chen et al., 2017; Wang et al., 2021).As highly absorptive aerosol, the traditional heating effect of dust aerosols on atmosphere has been challenged by more complex mechanisms. Dust suspended in high altitudes can enhance the stability of lower atmosphere and inhibit convection through heating up the upper atmosphere and then affect the convective activity and cloud development by modifying the thermodynamic structure (Lau et al., 2010). Dust aerosols near the boundary layer can heat up the atmosphere and cool down the ground, hinder shallow convection, delay the release of energy and water to supplement, and strengthen deep convection (Fan et al., 2015; Lee et al., 2017;Yuan et al., 2021). Dust aerosols can also accelerate the evaporation of low-level cloud droplets and aggravate the drought conditions over arid and semiarid regions(Huang et al., 2014). Severe dust event even can cause the upper tropospheric temperature reversal to substantially impact the subsequent evolution of atmospheric circulation and precipitation process (Lau et al., 2006).With aerosol playing such critical roles in atmospheric processes, reducing the uncertainty in the research on radiation effects of aerosol is the key and basis for studying climate change and ecological environment evolution. In this regard, Northwest China makes a particularly relevant candidate.
Previous studies on the radiative effects of dust aerosols mainly applied numerical models and satellite data (Chen et al., 2013; Yang et al., 2017). Application of various parameterization schemes and aerosol secondary transformations has resulted in huge differences among the simulation results (Paukert et al., 2017; Ma et al., 2021).Due to the vertical transport, the vertical distribution of aerosols in reality might be contrary to the profile assumptions based on empirical relationships in the model(Adams et al., 2012). There are still large uncertainties in evaluating the radiative effects of dust aerosols due to the lack of adequate direct measurements (Yuan et al., 2021).To reduce these uncertainties, it is essential to obtain the three-dimensional distribution of dust aerosols (Zarzycki and Bond, 2010; Samset and Myhre, 2011; Samset et al.,2013). Any changes in the concentration and three-dimensional distribution of aerosols will lead to the generation of uncertainties in assessing aerosol direct radiative forcing (Soldatenko, 2020). In addition, it is not easy to separate the different types of aerosols, and it is difficult to predict their respective behaviors. These aspects make the study of climate change and ecological environment evolution over Northwest China quite challenging. Apparently, more research is required to understand the behavior of aerosols.
2. Datasets and methodology
2.1 Datasets
2.1.1 CALIPSO
The Cloud–Aerosol Lidar and Infrared Pathfinder Satellite Observations (CALIPSO) improves representation of the vertical structure and properties of clouds and aerosols through carrying a pulsating laser lidar, the Cloud–Aerosol Lidar with Orthogonal Polarization(CALIOP), which executes vertically sliced scanning of the earth’s atmosphere from space unremittingly. On 8 November 2016, the CALIPSO project began the release of version 4.10 (V4.10) of the CALIPSO data products,providing a substantial advance in the algorithms used to retrieve the spatial and optical properties of aerosols and clouds over the previous data releases (Young et al.,2018). Significant overall improvements in cloud–aerosol discrimination (CAD) reliability were shown by developing a new set of CAD probability distribution functions (PDFs), especially in the classification of lofted aerosols and cirrus clouds. The CALIPSO Level 2 aerosol products include instant layer (ALay), profile (APro),and vertical feature mask (VFM) information along the satellite orbit. CALIPSO V4.10 Level 2 APro and VFM products are used in this study. The CALIPSO APro product provides profiles of particle extinction, backscatter, and additional information derived from these fundamental products. The extinction profiles reported in the CALIPSO V4 APro product, used in this study, are produced by a modified and substantially enhanced version of the hybrid extinction retrieval algorithm used in earlier releases. The CALIPSO Level 2 VFM data product describes the vertical and horizontal distributions of clouds and aerosols. Several improvements to aerosol subtyping have been implemented in the V4.10 VFM product(Young et al., 2018), which divides aerosols into dust(i.e., pure dust in this study), polluted dust, marine aerosol,clean continental aerosol, polluted continental aerosol, elevated smoke, dusty marine (new aerosol subtype), etc.
2.1.2 CloudSat
Similarly, the experimental satellite CloudSat helps to unravel the complexity of the climate system by providing a globe-circling slice of the earth’s atmosphere, remaining in particularly close proximity to CALIPSO.They complement each other to provide nearly synchronized observations, which are considered to be simultaneous in this study. The level-2 Fluxes and Heating Rates product (2B-FLXHR-LIDAR) is an upgrade of the original 2B-FLXHR only using CloudSat to constrain clouds. The calculation of 2B-FLXHR-LIDAR product is based on the basis of radar and lidar backscatter from CloudSat and CALIPSO, radiance measurements from Moderate Resolution Imaging Spectroradiometer, and ancillary temperature and humidity profiles from the ECMWF (Henderson et al., 2013). The 2B-FLXHR-LIDAR product derives profiles of radiative fluxes and heating rates throughout the atmosphere, which are combined into two broadband estimates (longwave and shortwave, abbreviated as LW and SW respectively), covering a 4-yr period from 2007 to 2010. The variables of column-integrated radiative heating (RH) and atmospheric radiative heating rates (QR) are used in this study.
2.1.3 MISR
The Multiangle Imaging SpectroRadiometer (MISR)was launched onboard the Terra satellite in 1999, which was designed to improve our understanding of the earth’s ecology, environment, and climate. The MISR has nine push-broom cameras on the optical bench pointing at different fixed view angles (70.5°, 60.0°, 45.6°, 26.1° for both backward and forward and 0°) and each of the nine cameras has four spectral bands (446, 558, 672, and 866 nm). This design overcomes the adverse effects of angular variation of reflected sunlight on the observed scenes derived from that most satellite instruments observe straight down or toward the edge of earth. The high spatial resolution, wide range of along-track view angles,and high-accuracy calibration make it uniquely capable of tracking the aerosol plume (Kahn et al., 2009). The level-3 products are aggregated into global grids with a spatial resolution of 0.5° × 0.5° on daily, monthly, and yearly timescales. Monthly aerosol optical depth (AOD)from MISR Version 23 L3 products are used to analyze the horizontal distribution of aerosols together with CALIPSO observation in this study.
2.2 Methodology
The three-dimensional distribution of aerosols over Northwest China can be obtained based on an artificially constructed three-dimensional (3D) matrix with a resolution of 1° × 1° × 500 m (longitude × latitude × height),which is the result of synthetically considering spatial resolution and sample counts. The process is shown schematically in Fig. 1. Both daytime and nighttime CALIPSO orbital data are collected. Construct a 3D matrix and pick out the orbital data fall in a certain cell of the 3D matrix (the small black box in Fig. 1a and the cubes in Figs. 1b, c) for every CALIPSO footprint (Adams et al., 2012; Jia et al., 2021). The three-dimensional structure can be constructed by repeating this pattern for each successive cube puzzle of the 3D matrix (Fig. 1c). The 3D matrix of aerosol extinction coefficients is derived by averaging the CALIPSO L2 APro data fall in each cell on the monthly timescale. The frequencies of various aerosols over Northwest China are also converted into the 3D matrix based on the subtypes of aerosols given by the CALIPSO L2 VFM product. It is worth pointing out that the accompanying extinction quality control (QC) flag are used to filter the aerosol extinction coefficient. For reliable scientific analyses, only those extinction coefficients with QC flag values of 0, 1, 2, 16, and 18 (Young et al., 2018) are used in this study. The feature classifications of clouds and aerosols are also filtered by the quality assessment (QA) flag to remove data with none(QA = 0) or low (QA = 1) confidence.
洞庭湖及入湖口表层沉积物OM与TN呈显著正相关(r=0.574,P<0.05)(表3),相关研究表明水体沉积物总氮中的 70%~90%是以有机氮的形式存在的(李辉等,2011),洞庭湖沉积物TN与OM 的相关关系从侧面验证了该研究结果。TN与TP相关性不大(r=0.433,P>0.05),表明 TN与TP可能具有不同的来源。OM 与 TP相关性较小(r=0.073,P>0.05),表明TP可能并非主要由沉积物中OM的富集造成。由此可推测,湖区各种生物残体的分解是洞庭湖表层沉积物OM的一个重要来源,且OM在沉积物中的富集可能是全湖中N的主要来源,而对P影响不大(余辉等,2010)。

Fig. 1. Schematic diagram of the methodology used in this study. (a) The orbit track locations of the CALIPSO satellite (gray for daytime and black for nighttime). (b) A fragment of the CALIPSO profile. (c) The artificially constructed three-dimensional (3D) matrix.
The AOD for a specific type of aerosol (τtype) is retrieved in terms of the aerosol extinction coefficient σaer( ) from the CALIPSO L2 APro product restricted by the aerosol types from the CALIPSO L2 VFM product as shown below:

where σaeris the aerosol extinction coefficient at layerz,and dzis the vertical resolution (the interval between the layer base and top).
If no aerosol and cloud are detected in the designated grid frame, it is defined as “clean atmosphere”; if the occurrence frequency of dust aerosol is greater than 90%, it is defined as “dusty environment.” Similar to the definition of aerosol radiative forcing, the effect of dust aerosol on atmospheric radiation balance and thermodynamic structure can be obtained by calculating the differences of column-integrated radiative heating and atmospheric radiative heating rate between the “dusty environment”and the “clean atmosphere” [Eqs. (2)–(3)].
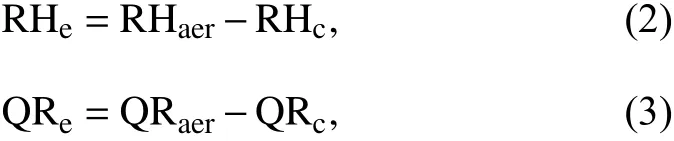
where RH and QR mean the column-integrated radiative heating and profiles of atmospheric radiative heating rate from CloudSat 2B-FLXHR-LIDAR product, respectively. R Heis the effect of dust aerosol RH and Q Reis the effect of dust aerosol on QR. Since the calculation is highly dependent on the observations of CALIPSO and Cloudsat, the defects of polar orbiting satellites, such as the long revisit period and the limited data, will inevitably bring some uncertainties. To minimize the uncertainty of the study results, the statistical bias [Eq. (4)] is used to constrain the RH and QR:

wherenis the sample number of valid measurements within the grid or bin andsis the standard deviation.
This study is based on data collected during the period 2007–2010, since the CloudSat 2B-FLXHR-LIDAR profile data are publicly available only for this period.It should be pointed out that the radiative effect of aerosols in this study refers to the direct radiative effect because aerosol–cloud interactions are not involved throughout the calculation.
3. Results
Figure 2 shows the distinctive geographical distribution of Northwest China. Complicated topography and huge difference in elevation are the most significant geographical features of this region. There are mainly plateaus, mountains, and basins, composed of complex and various landscapes, e.g., glaciers, deserts, oases, etc. As inland hinterland with the furthest distance from the sea,the climate conditions (semiarid to arid in overall) can be described as dry, scarce precipitation, intensive evaporation, and water shortage. Overall, this region exists in a delicate ecological balance and it is vulnerable to the increased environmental pressures caused by climate change.
3.1 The 3D distribution of aerosols
Accurate separation of dust from different types of aerosols is critical for reducing the uncertainty in the research of aerosol radiative effect. The 3D distributions of occurrence frequencies for various aerosols over Northwest China are derived from the CALIPSO L2 VFM product (Fig. 3). The aerosol that occurs most frequently is pure dust and polluted dust, followed by smoke, continental, and polluted continental aerosols. As shown in Fig. 3a, the occurrence frequency of pure dust aerosols over the Tarim Basin is as high as 60%, mainly distributed below 6 km. The occurrence frequencies of pure dust aerosols over the Zhungeer Basin and Loess Plateau are about 40%. Polluted dust is produced by the denaturation of pure dust mixed with other types of aerosols during long-distance transport. Due to the transport, polluted dust becomes more uniformly distributed (about 20%). Clean continental and smoke aerosols rarely appear as the occurrence frequencies are about 15% (Figs.3c, e). Polluted continental aerosols are evenly distributed within 2 km with occurrence frequency of 5%–10%(Fig. 3d).
To better understand the 3D distribution of aerosols over Northwest China, the spatial distribution of optical depths (Fig. 4) and altitude–longitude cross-sections of extinction coefficients (Fig. 5) are analyzed for all the aerosol and the most frequent aerosols (pure dust and polluted dust). The AOD, pure dust optical depth (DOD),and polluted dust optical depth (PDOD) are obtained by integrating the corresponding extinction coefficients [Eq.(1)]. A comparison of the MISR observation (Fig. 4a)and CALIPSO derived AOD (Fig. 4b) prove that the calculation of AOD and extinction coefficient in this study is reasonable. From a horizontal perspective, aerosols are mainly distributed over the Tarim Basin on the northern slope of the Tibetan Plateau, Junggar Basin between the Tianshan Mountains and Altai Mountains, Gobi Desert,and Loess Plateau (Fig. 4). As shown in Fig. 5, the aerosol extinction coefficients near the ground are greater than 0.36 km-1over the Tarim Basin and 0.16 km-1over the Gobi Desert and Loess Plateau. In general, these aerosol extinction coefficients decrease with height. Notably, there are also some aerosols over high terrains such as the Tibetan Plateau and Tianshan Mountains (Fig. 5a),with extinction coefficients of about 0.10 km-1in general and 0.30 km-1in individual. As shown in Figs. 4, 5, pure dust and polluted dust are the most important components of atmospheric aerosols over Northwest China. The distributions of DOD and dust extinction coefficient are almost the same as those of AOD and aerosol extinction coefficient, both distributed over several key deserts. The PDOD and polluted dust extinction coefficient are relatively small and evenly distributed (except for a few areas with frequent human activities).

Fig. 2. Topographical distribution of Northwest China.

Fig. 3. Altitude–longitude cross-sections of annual mean occurrence frequencies of different aerosols.

Fig. 4. Spatial distributions of aerosols over Northwest China: (a) annual mean AOD from MISR observations, (b) annual mean AOD, (c) pure dust optical depth (DOD), and (d) polluted dust optical depth (PDOD) from CALIPSO observations.

Fig. 5. Altitude–longitude cross-sections of annual mean extinction coefficient (km-1) for (a) all the aerosols, (b) pure dust, and (c) polluted dust.
3.2 Direct radiative effects of dust aerosols
Based on the satellite derived 3D distribution of aerosols, the effects of aerosols on the atmospheric radiation balance and thermodynamic structure are explored. Since pure dust and polluted dust are the most frequently occurring (Fig. 3) and most abundant (Figs. 4, 5) atmospheric aerosols over Northwest China, the radiation effects of other aerosols are not analyzed in this study.Considering that the sample counts of polluted dust at each cube puzzle of the 3D matrix are too small in the calculation process, pure dust and polluted dust aerosols are commonly referred to as dust aerosols hereafter.
Figure 6 shows the annual mean column-integrated radiative heating aggregated into grids with 1° × 1° (longitude × latitude) in the “dusty environment” and “clean atmosphere.” The calculation is performed for the daytime and nighttime (distinguish by Day_Night_Flag from CALIPSO) separately. The statistical bias in Fig. 6 shows that most of the RH data are credible. The sample size of “dusty environment” is smaller than that of “clean atmosphere” and the statistical bias of RH is smaller in the “clean atmosphere” (Figs. 6b, d, f, mostly 0–0.03 K day-1). The statistical bias of RH in the “dust environment” is relatively large, especially for SW radiation(Fig. 6a, 0.03–0.1 K day-1). Only grids where the ratio of statistical bias to the corresponding annual mean RH less than 0.1 are used to calculate effects of dust aerosols on column-integrated radiative heating [Eq. (2)]. Similarly,the effect of dust aerosol on QR can be obtained [Eq.(3)]. It is worth pointing out that the white grids in Figs.6, 7, 8 are not 0, but artificially set as default values. This may come from the limited satellite data, the coexistence of multiple types aerosols or hardly any aerosols, which make it difficult to pick out samples of “dusty environment” (occurrence frequency greater than 90%).
The effects of dust aerosols on column-integrated radiative heating over Northwest China are shown in Fig. 7.Dust aerosols can heat the atmosphere (about 0.3–0.7 K day-1) by absorbing SW in the day (Fig. 7a) and cool the atmosphere during both daytime and nighttime by emitting LW radiation (Figs. 7c, d). After the mutual compensation of the SW and LW radiative effects, dust aerosols can heat the column-atmosphere by about 0.3 K day-1during the daytime (Fig. 7e). The heating effect(i.e., SW radiation effect) is consistent with the distribution pattern of dust aerosols (Fig. 4), which is not uniform spatially and presents only in the daytime. The LW radiation effect is relatively long-lasting and overall presents a cooling effect of about -0.4 K day-1. Given the mutual compensation of SW heating effect and LW cooling effect, dust aerosols may have a relatively small impact on the atmospheric radiation balance, but it still cannot be ignored. The radiative effects of dust aerosols will modify the horizontal temperature gradient and increase the diurnal temperature range.
Similarly, the effects of dust aerosol on the atmospheric vertical thermodynamic structure are explored (Figs. 8,9). Figure 8 suggests that dust aerosols can significantly alter the thermodynamic structure of the atmosphere by heating the lower atmosphere and cooling the upper atmosphere. The effect of dust aerosols on the SW heating rate shows a heating effect (1.5–2.5 K day-1) below 5 km that corresponds to the dust layer with the largest aerosol extinction coefficient (Fig. 5) and a weak cooling effect(about -1.0 K day-1) in the upper atmosphere by absorbing and scattering SW radiation. By contrast, the effect of dust aerosols on LW radiation is more evenly distributed,which shows cooling effect in the middle atmosphere and weak heating effect in the upper and near-surface atmosphere by emitting LW radiation, similar to the case study of Huang et al. (2009). The LW cooling rate can partially offset the SW heating effect. Overall, dust aerosols can heat up the lower atmosphere (0.5–1.5 K day-1)and cool down the upper atmosphere (about -1.0 day-1)during the daytime, while they cool down the lower atmosphere (-3 to -1.5 K day-1) and heat up the upper atmosphere (1–1.5 K day-1) at night. As far as the entire Northwest China is concerned, the impact of dust aerosols on QR is relatively small (Fig. 9). Combining the SW and LW radiation, it is observed that dust aerosols heat up (cool down) the atmosphere during the daytime and cool it down (heat it up) at night below 4 km (higher than 6 km). In the range of 4–6 km, dust aerosols have a cooling effect on the atmosphere during both daytime and nighttime.

Fig. 6. The annual mean column-integrated radiative heating (colors; K day-1) and corresponding statistical bias (dot symbols; K day-1) in the“dusty environments” (left) and “clean atmosphere” (right).
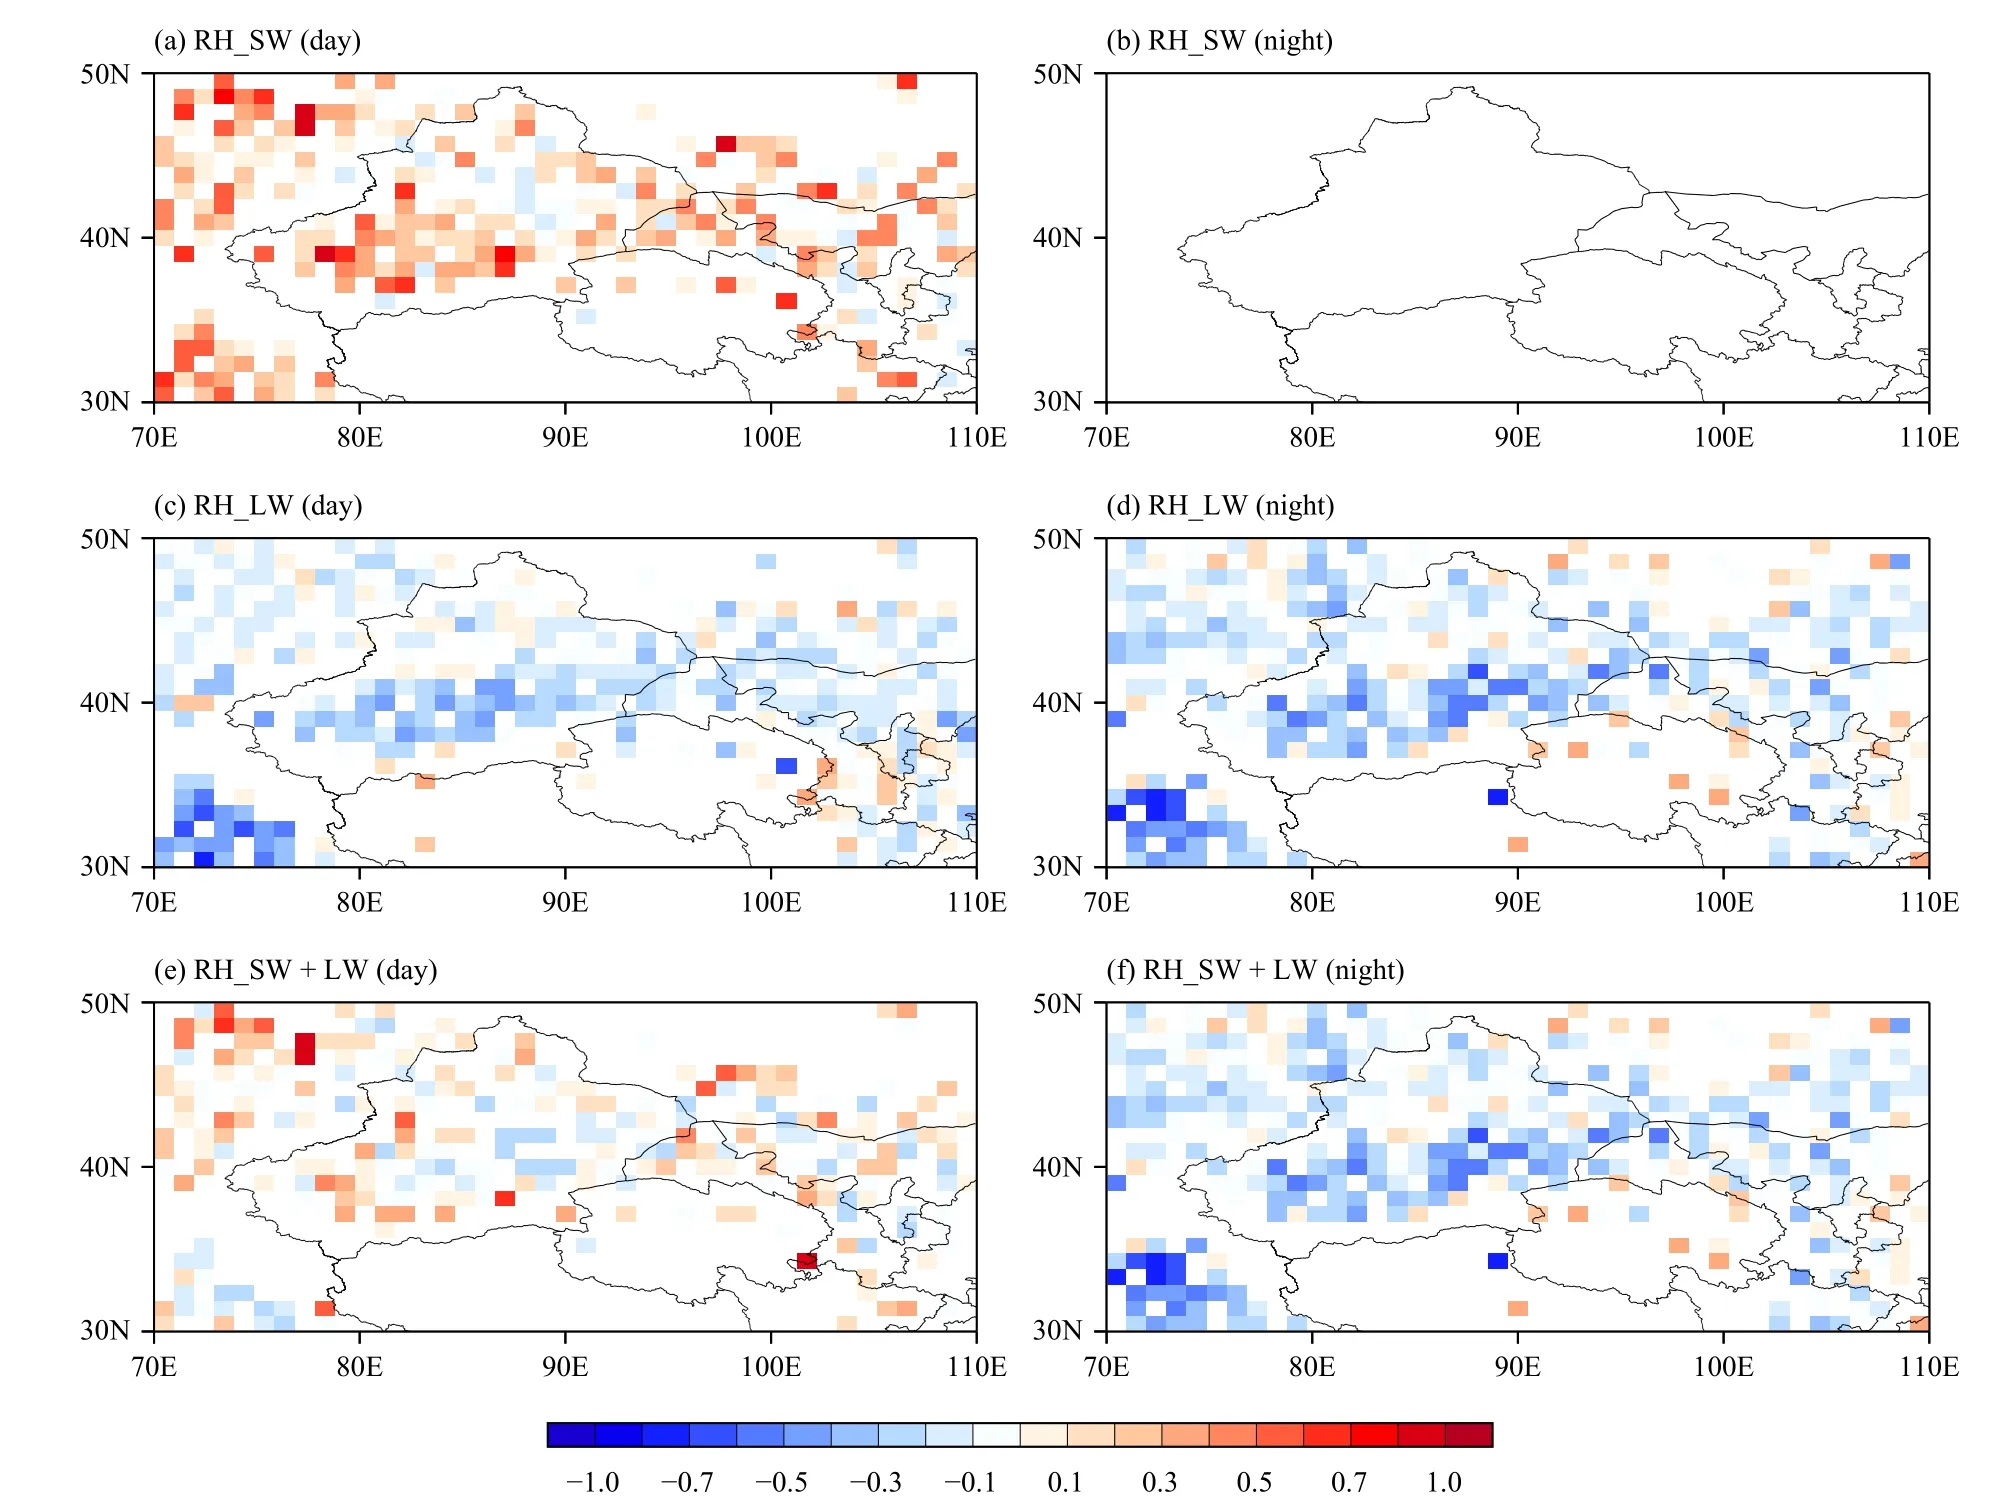
Fig. 7. The effects of dust aerosols on the annual mean column-integrated radiative heating (RH; K day-1) in the day (left; Day_Night_Flag = 0)and night (right; Day_Night_Flag = 1).
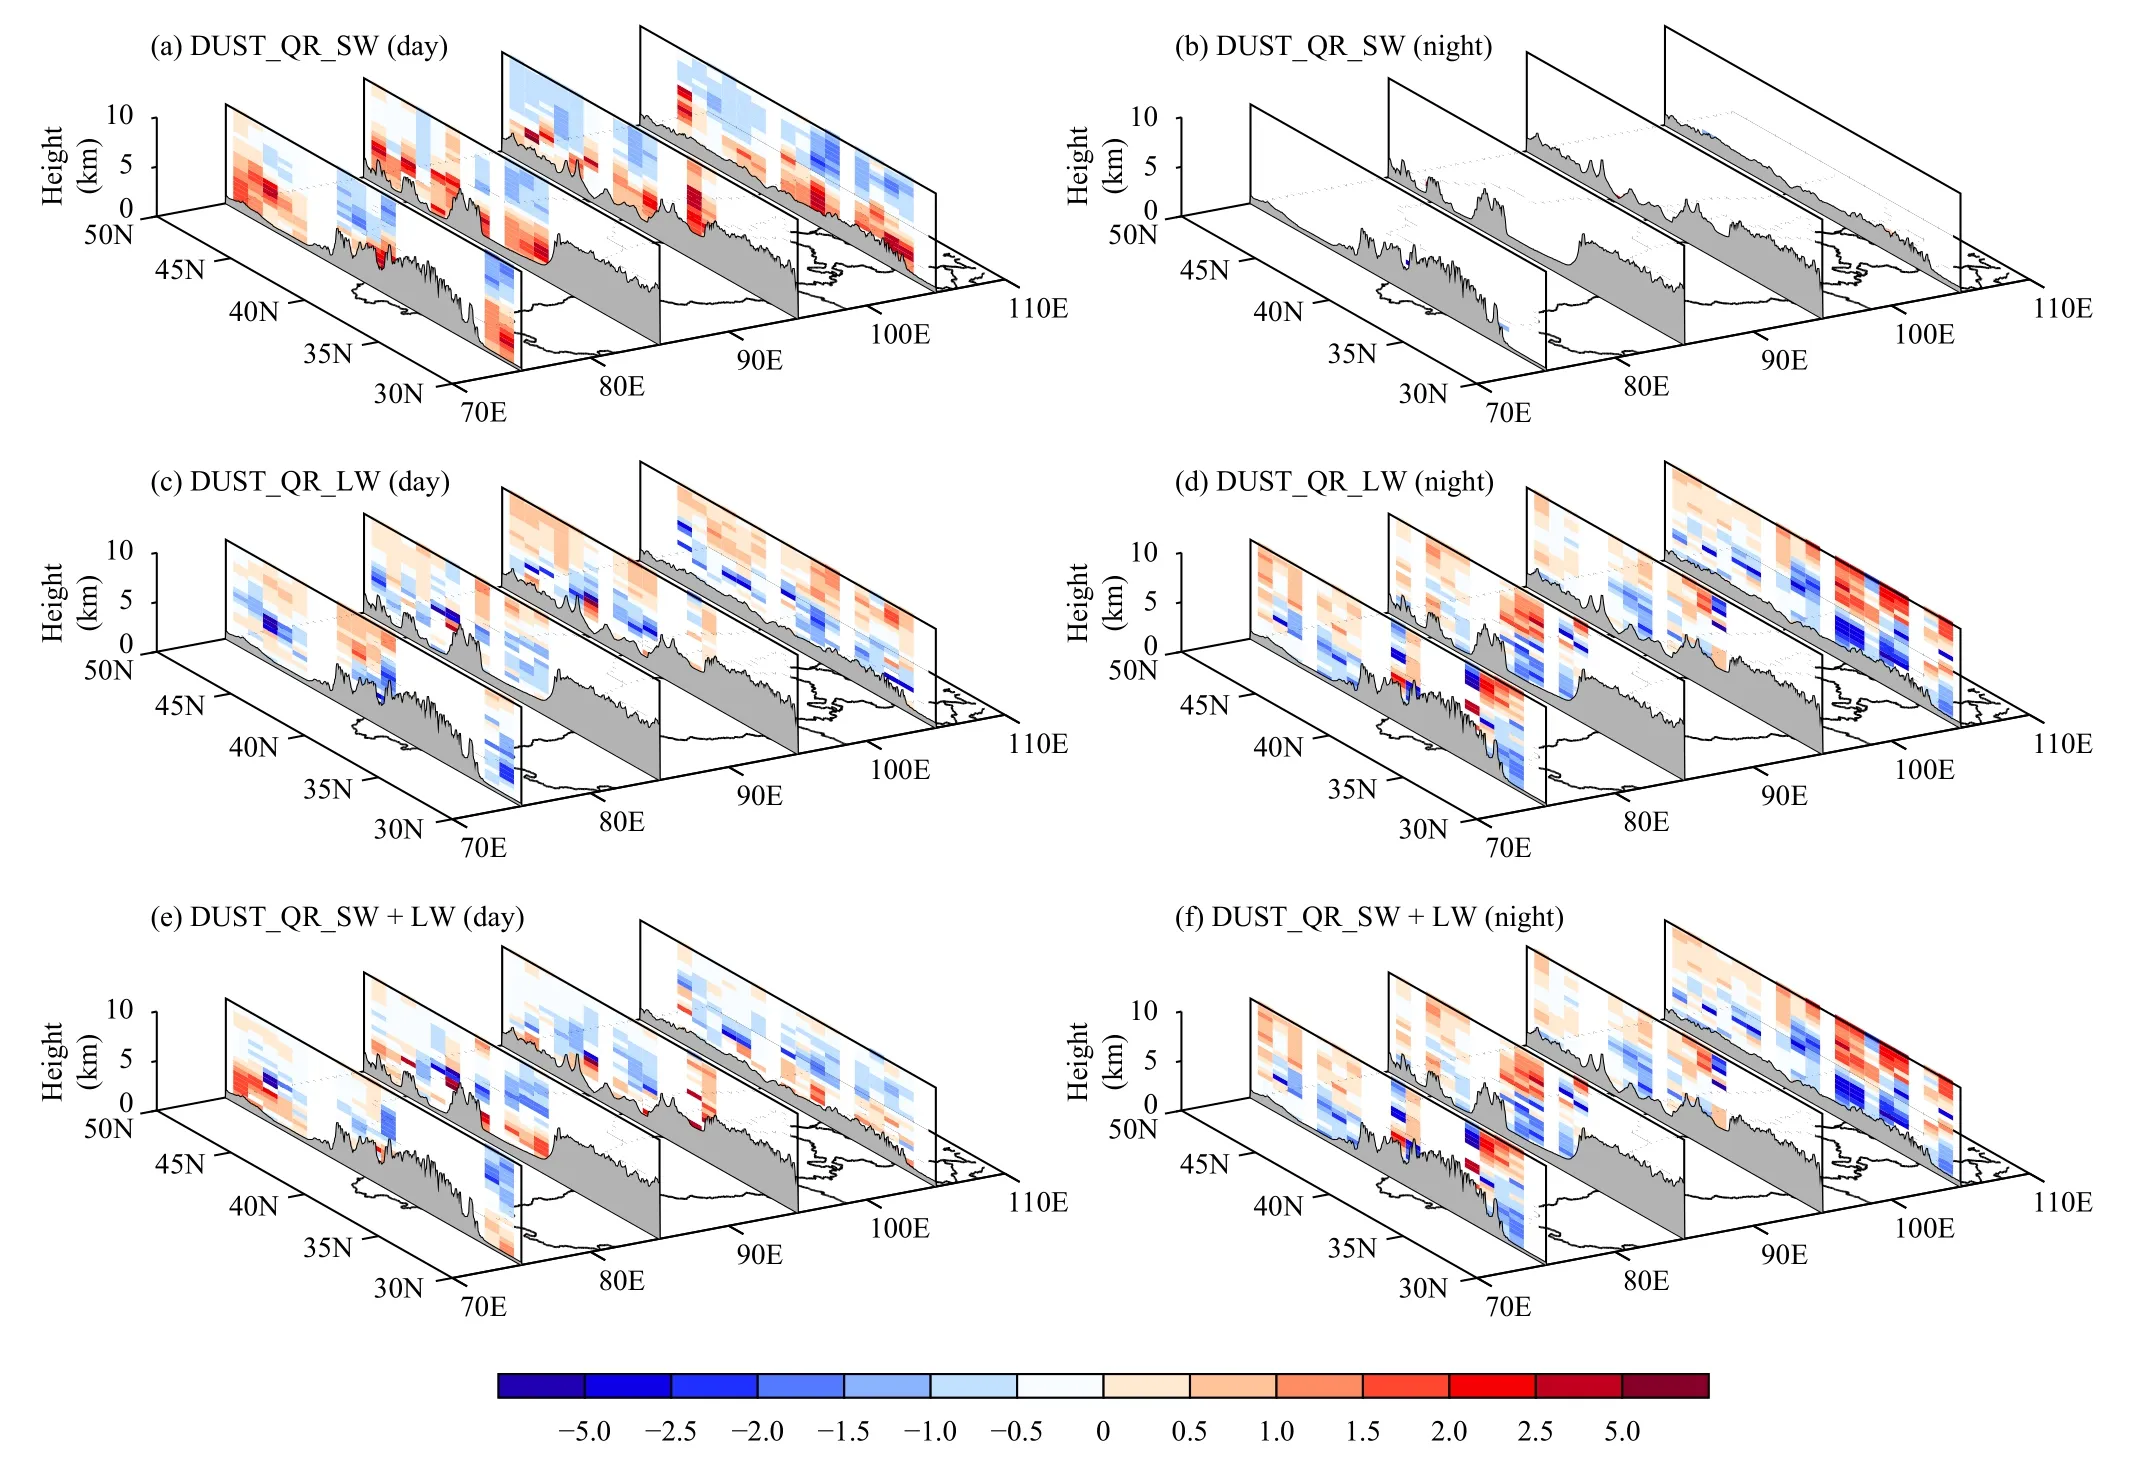
Fig. 8. The effects of dust aerosol on the annual mean atmospheric radiative heating rate (QR; K day-1) over Northwest China in the day (left;Day_Night_Flag = 0) and night (right; Day_Night_Flag = 1).
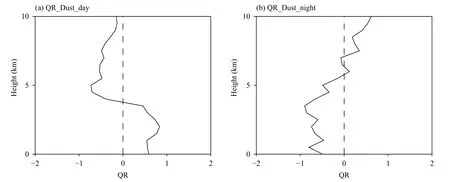
Fig. 9. The mean effects of dust aerosols on the annual mean atmospheric radiative heating rate (QR; K day-1) over Northwest China in the day(left; Day_Night_Flag = 0) and night (right; Day_Night_Flag = 1).
4. Conclusions and discussion
In this study, the effects of dust aerosols on the radiation balance and atmosphere thermodynamic structure over Northwest China were evaluated based on the satellite-derived aerosol 3D distribution.
In general, aerosols over Northwest China are mainly distributed in the Tarim Basin, Junggar Basin, Gobi Desert, and Loess Plateau. Dust and polluted dust are the most important aerosols both in the aerosol extinction coefficient and occurrence frequency. The aerosol extinction coefficients are greater than 0.36 km-1over the Tarim Basin and 0.16 km-1over the Gobi Desert and Loess Plateau, decreasing with height. Aerosols can extend to more than 6 km along the northern slope of the Tibetan Plateau and Tianshan Mountains.
For the column-atmosphere, dust aerosols can heat up the atmosphere by absorbing and scattering SW radiation in the day and cool it during both daytime and nighttime by emitting LW radiation, which are consistent with the distribution pattern of dust aerosols. In general, it shows a heating (about 0.3 K day-1) during the daytime and a cooling effect (about -0.4 K day-1) during the nighttime, which will modify the horizontal temperature gradient and increase the diurnal temperature range.Dust aerosols can also significantly change the vertical thermodynamic structure of the atmosphere. Dust aerosols can heat up the lower atmosphere (0.5–1.5 K day-1)and cool down the upper atmosphere (about -1.0 K day-1) during the daytime, while they cool down the lower atmosphere (-3 to -1.5 K day-1) and heat up the upper atmosphere (1–1.5 K day-1) at night.
As far as the whole Northwest China is concerned, the impact of dust aerosols on the atmospheric radiation balance is relatively small. However, it still cannot be ignored. The radiative effects of dust aerosols on the atmospheric temperature will modify the horizontal temperature gradient and the vertical thermodynamic structure.Due to the spatiotemporal inhomogeneity of dust aerosols, the atmospheric stability, wind field, and diurnal temperature range will also be affected. The incidence of dust events are highly correlated to the meteorological factors, ahead of oceanic oscillations, atmospheric circulation patterns, and land surface conditions (Wu et al.,2021). This heating effect caused by the dust aerosols will in turn, affect the dust emissions, providing one of the strongest feedback pathways for Northwest China. In summary, the overall impact of aerosols on the sensitive climate system and the fragile ecosystem of Northwest China should be a matter of concern.
Although this method has certain research value and prospect in studying radiative effects of aerosols, there are still some uncertainties and caveats due to polar-orbit satellite data (Jiang et al., 2018). A large number of calculations in this study are based on CALIPSO and CloudSat observations, which only provide instantaneous information of aerosols and clouds at fixed time.Both CALIPSO and CloudSat satellites have a long revisit period and the limited data will bring some uncertainty, especially in the regions with multiple types of aerosols. It is hoped that more perfect results will be obtained by combining multi-source observations and model simulation in the follow-up study.
Acknowledgments.We are very grateful to the anonymous reviewers for their helpful comments. The CALIPSO, CloudSat, and MISR data were obtained from the NASA Langley Research Center Atmospheric Sciences Data Center. The authors gratefully acknowledge their efforts in making these data available online.
猜你喜欢
中国肿瘤外科杂志(2023年5期)2023-11-04 05:50:14
土壤学报(2021年4期)2021-09-10 03:45:40
北方音乐(2020年17期)2020-12-06 09:38:53
陶瓷学报(2019年5期)2019-01-12 09:17:38
信息记录材料(2018年12期)2018-12-24 03:26:22
科技创新与品牌(2018年9期)2018-10-24 08:26:56
实用临床医学(2016年2期)2016-06-21 10:05:42
浙江林业(2016年5期)2016-06-14 11:23:23
西藏大学学报(自然科学版)(2015年1期)2015-12-25 11:43:44
棉花科学(2015年2期)2015-04-29 00:44:03
 Journal of Meteorological Research2022年5期
- Journal of Meteorological Research的其它文章
- Assessing 10 Satellite Precipitation Products in Capturing the July 2021 Extreme Heavy Rain in Henan, China
- Refined Evaluation of Satellite Precipitation Products against Rain Gauge Observations along the Sichuan–Tibet Railway
- Assimilation of All-Sky Radiance from the FY-3 MWHS-2 with the Yinhe 4D-Var System
- Stochastically Perturbed Parameterizations for the Process-Level Representation of Model Uncertainties in the CMA Global Ensemble Prediction System
- Interannual Relationship between Summer North Atlantic Oscillation and Subsequent November Precipitation Anomalies over Yunnan in Southwest China
- Intensified Impact of the Equatorial QBO in August–September on the Northern Stratospheric Polar Vortex in December–January since the Late 1990s