
Refined Evaluation of Satellite Precipitation Products against Rain Gauge Observations along the Sichuan–Tibet Railway
2022-11-07 05:33ZhiqiangLINXiupingYAOJunDUandZhenboZHOU
Zhiqiang LIN, Xiuping YAO, Jun DU, and Zhenbo ZHOU
1 Plateau Atmosphere and Environment Key Laboratory of Sichuan Province, School of Atmospheric Sciences,Chengdu University of Information Technology, Chengdu 610225
2 China Meteorological Administration Training Centre, China Meteorological Administration, Beijing 100081
3 Tibet Institute of Plateau Atmospheric and Environmental Science, Lhasa 850000
ABSTRACT Being constructed in southwestern China, the Sichuan–Tibet Railway (STR) travels across the eastern Tibetan Plateau where there is the most complex terrain and changeable weather in the world. Due to sparse ground-based observations over the Tibetan Plateau, precipitation products retrieved by remote sensing are more widely used; however,satellite-based precipitation products (SPPs) have not yet been strictly and systematically evaluated along the STR.This study aims to evaluate the performance of six SPPs by a series of metrics with available ground observations along the STR during 1998–2020. The six SPPs include the datasets derived from the Tropical Rainfall Measuring Mission (TRMM), Climate Prediction Center morphing technique (CMORPH), Global Precipitation Measurement(GPM), Global Satellite Mapping of Precipitation (GSMaP), Precipitation Estimation from Remotely Sensed Information Using Artificial Neural Networks (PERSIANN), and Fengyun-2 satellites precipitation estimate (FY2PRE). The results indicate that most of the SPPs can capture the precipitation characteristics on multiple timescales (monthly,daily, hourly, and diurnal cycle) as shown by the evaluated metrics. The probability density functions of the daily and hourly precipitation are also well represented by the SPPs, and 30 mm day-1 and 16 mm h-1 are identified as the daily and hourly thresholds of extreme precipitation events along the STR. The best SPP varies at different timescales:GPM and GSMaP are suitable for the monthly and daily scale, and FY2PRE and GPM are suited to the hourly scale.In general, GPM is relatively optimum on multiple timescales, and PERSIANN gives the worst performance. In addition, the SPPs perform worse at higher altitudes and for more intense precipitation. Overall, the results from this study are expected to provide essential reference for using the SPPs in meteorological services and disaster prevention in the STR construction and its future operation.
Key words: eastern Tibetan Plateau, Sichuan–Tibet Railway (STR), satellite-based precipitation products, evaluation, multiple timescales
1. Introduction
The Sichuan–Tibet Railway (STR) is designed to start from Chengdu, pass through Ya’an and Kangding, then enter Tibet via Qamdo, and end in Lhasa. The STR will help develop green tourism, promote local industries and poverty alleviation by increasing the income of local people, and instill a greater sense of national identity among ethnic groups (Chen and Haynes, 2017). The total length of STR is about 1800 km, and it travels through the eastern part of the Tibetan Plateau, where the intricate geological conditions make the construction and operation of STR extremely difficult. Therefore, the STR is one of the most challenging railway projects in the world(Lu and Cai, 2019; Xue et al., 2021). In addition to high altitudes and complex terrain, extreme weather, meteorological disasters, and derived geological hazards (Wu et al., 2013; Lin, 2015; Lin et al., 2021; Liu et al., 2021;Zhang et al., 2021) will seriously threaten the construction and operation of STR. Among meteorological disasters, heavy precipitation can aggravate mountain disasters such as ice avalanches, landslides, and debris flows (Li Z. W. et al., 2020). Thus, accurately monitoring and forecasting of heavy precipitation events at multiple timescales is an essential meteorological service for the STR project.
During the railway construction, rainwater can erode building materials, such as steel and cement, and reduce the concrete strength, causing the railroad subsidence(Okada and Sugiyama, 1994; Lu and Cai, 2019; Lundquist et al., 2019). Also, it can lead to flooding in tunnels, specifically for the STR with thousands of tunnels to be constructed. The most serious disaster caused by persistent precipitation and heavy precipitation events is geological hazards, which are particularly prone to occur under complex topographic conditions along the STR(Lu and Cai, 2019). Moreover, the precipitation variability is closely related to the local agriculture and animal husbandry, and affects the water supply for millions of Asians living in the downstream areas since many rivers originate or flow through this region, such as the Yarlung Zangbo River, the Nujiang River, the Jinsha River, and the Lantsang River. Hence, accurately monitoring of precipitation in this region is a principal mission of meteorological services.
Generally, precipitation data can be observed in three ways, i.e., in situ rain gauges, radar networks, and satellite-based precipitation estimations. Due to the complex terrain in the eastern Tibetan Plateau (ETP), there is a great spatial diversity in the precipitation along the STR(Zhang et al., 2018; Zhang et al., 2021). Although the ground-based weather radar can be another choice to monitor precipitation, there are few radars in this area,and the radar detection efficiency and detection range in this complex terrain area are greatly reduced (Delrieu et al., 1999; Zhang et al., 2020). Overall, the sparse groundbased observations cannot meet the requirements of STR construction and operation services. Hence, the satellitebased precipitation products (SPPs) become the most effective choice for monitoring precipitation along the STR.
The SPPs can be used to capture the extreme precipitation events (Zhou et al., 2019; Gupta et al., 2020; Liu et al., 2020; Navarro et al., 2020), even in complex terrain areas such as the Tibetan Plateau (Tong et al., 2014;Broucke et al., 2019; Chen et al., 2020; Guo et al., 2020;Liu et al., 2020). It suggests the potential availability of the SPPs in capturing the catastrophic rainfall which could seriously jeopardize the STR construction and operation. Besides, the SPPs can supply the gridded regional average precipitation as numerical models do, while in situ rain gauges just reflect local information, particularly in mountainous regions. Therefore, the SPPs may provide a better referential benchmark for regional weather forecast models to improve weather forecasts along the STR.
The SPPs have been widely used in various regions by meteorologists and hydrologists (Fu et al., 2017; He et al., 2017; Tan et al., 2019; Wang et al., 2019; Ahmed et al., 2020; Jiang et al., 2020). To utilize the SPPs in a specific region, their accuracy should be firstly validated.For this reason, many researchers had conducted numerous evaluations of various SPPs in different regions(Katiraie-Boroujerdy et al., 2013; Gebere et al., 2015;Beria et al., 2017; Manz et al., 2017; Mishra and Rafiq,2017; Derin et al., 2019; Su et al., 2019; Xu et al., 2019;Nkunzimana et al., 2020; Sharma et al., 2020). Several studies noted that the SPPs also perform well in the complex terrain regions including the Tibetan Plateau (Lu and Yong, 2018; Rahman et al., 2018; Zhang et al., 2018;Bhatta et al., 2019; Liu et al., 2019; Wang et al., 2019;Amjad et al., 2020; Li D. et al., 2020; Li Z. W. et al.,2020; Lu et al., 2020; Yu C. et al., 2020). However, the performance of the SPPs along the STR is yet unclear,especially for the SPPs with multiple timescales. It has been suggested that the performance of the SPPs varies strongly at various timescales (Manz et al., 2017; Sharifi et al., 2018; Zeng et al., 2018; Broucke et al., 2019; Yu C. et al., 2020). Therefore, the evaluation is urgently needed, since it is the basis for the SPPs application along the STR.
Based on the current deficiencies in evaluating the SPPs along the STR, our study aims to answer the following three questions. First, how do the SPPs, including the average precipitation and the heavy precipitation events, perform in the ETP at multiple timescales?Second, which one performs best at various timescales among the SPPs, to determine which one should be selected for a specific timescale in the weather service for STR construction and operation? Third, how does the complex terrain along the STR affect the performance of the SPPs?
The remainder of this paper is organized as follows.Section 2 describes the six widely used SPPs, observations from the in situ rain gauges, and the evaluation metrics. Section 3 gives the evaluation results of the SPPs and displays the relative ranks of the SPPs at various timescales along the STR. Section 4 discusses the influence of elevation and precipitation intensity on the performance of SPPs. Finally, the key findings of our study are summarized in Section 5.
2. Data and methods
2.1 Study area
As shown in Fig. 1, the ETP can be divided into four sub-regions, i.e., the Sichuan basin (SCB), the West Sichuan (WSC), the eastern Tibet (ET), and the central Tibet (CT). The SCB is located on the east side of the Tibetan Plateau, with an average altitude of less than 1000 m, and it is the first stage of the STR construction(from Chengdu to Ya’an), with the most densely populated region in the study area. The WSC is located in the western part of Sichuan Province and is the eastward extension of the Tibetan Plateau, with an average altitude of about 3400 m. The section of the STR in the WSC is from Ya’an to Litang. The ET mainly includes Nyingchi and Qamdo in the eastern part of the Tibet Autonomous Region, with an average altitude of 4025 m. In the ET,the STR travels through the famous Hengduan Mountains, which have the greatest altitude gradient in the study area. The CT, in the central part of the Tibet Autonomous Region and the Tibetan Plateau, is the destination of the STR. The CT mainly includes Lhasa,Shannan, and Nagqu, with an average altitude of 4348 m.

Fig. 1. (a) Distributions of the elevation (shading), automatic weather stations (AWSs; black dots), and national basic stations (red circles) over the eastern TP (red rectangles) along the Sichuan–Tibet Railway (STR; thick blue line). (b) The histogram (%) of the elevation of the rain gauges in the entire region along the STR and each sub-region, and the vertical red line denotes the average elevation of the region.
The elevation of the study area is obtained from the global digital elevation model data, with a resolution of 30 arc s, and is provided by the website of the U.S. Geological Survey (https://lta.cr.usgs.gov/GTOPO30).
2.2 Ground-based sites
Figure 1 shows the basic information about the rain gauges along the STR, including the national basic observation (NBO) and the automatic weather station (AWS)networks. The data periods of the NBO and AWS are from 1998 and 2015 to the present, respectively. The density of AWSs is lower than the spatial resolution of most SPPs, even in the SCB where the observation is the most intensive. Especially, the resolution of the NBO observation networks over the entire ETP with long-term records is much coarser than that of SPPs (Table 1). More unfortunately, since most of the study area is sparsely populated, a large percentage of AWSs are unable to work stably due to the lack of maintenance and repair.Compared with the sparse ground-based observations along the STR, SPPs can provide long-term, continuous,and refined information for meteorological services.

Table 1. Basic information about the ground-based rain gauges in the whole eastern Tibetan Plateau (ETP) along the STR, and its each sub-region. SCB indicates the Sichuan basin, WSC the western part of Sichuan, ET the eastern part of Tibet, CT the central part of Tibet, AWS the automatic weather station, and NBO the national basic observation
The evaluations of the daily and monthly precipitation and daily heavy precipitation events are conducted by using the data from the NBO network during 1998–2020.Since the AWS network has an observation period and cannot detect snowfall, the evaluations of the hourly precipitation and hourly heavy precipitation events are performed by the data from AWSs in the warm seasons(May–September) of 2015–2020. The daily precipitation is defined as the accumulative value from 0000 to 2359 UTC, and the hourly precipitation is cumulative from NN00 to NN59 UTC in the hour NN, and thus the ground-based precipitation and SPPs can be compared within the same period. The rain gauge data are provided by the National Meteorological Information Centre,China Meteorological Administration (CMA), and can be obtained from the China Integrated Meteorological Information Service System.
2.3 Satellite-based precipitation products
(1) TRMM
The Tropical Rainfall Measuring Mission (TRMM)Multisatellite Precipitation Analysis data are used in this research. TRMM was a research satellite that operated during 1997–2015 to help study the distribution and variability of precipitation within the tropics as a part of the water cycle in the climate system. In coordination with other satellites in NASA’s Earth Observing System,TRMM provided important precipitation information by using several spaceborne instruments, facilitating the study of the interactions among water vapor, clouds, and precipitation that are critical factors in regulating climate.The TRMM datasets can be downloaded from the website https://gpm.nasa.gov/missions/trmm.
(2) CMORPH
The NOAA Climate Prediction Center morphing technique (CMORPH) product is a precipitation estimation product. This technique is a flexible method that combines the existing passive microwave-based precipitation estimation from multiple low orbit satellites with the infrared data from multiple geostationary satellites (Joyce et al., 2004). Here, the CMORPH bias-corrected dataset(https://www.cpc.ncep.noaa.gov/products) is used to evaluate its performance along the STR.
(3) GPM
The Integrated Multisatellite Retrievals for Global Precipitation Measurement (GPM) Mission (IMERG)version 06 (https://pmm.nasa.gov/GPM) is the next generation product of TRMM. The IMERG fuses the early precipitation estimations collected by the TRMM satellite (2000–2015) with the more recent precipitation estimations collected by the GPM satellite (2014–present).The version of IMERG Final Run is evaluated in this study at the monthly, daily, and hourly scales (Huffman,2020).
(4) GSMaP
The Global Satellite Mapping of Precipitation(GSMaP) product (http://sharaku.eorc.jaxa.jp/GSMaP) is produced by the Japan Aerospace Exploration Agency(JAXA), which aims to develop an accurate and high-resolution global precipitation product based on the passive microwave and infrared satellites. The data of GSMaPGauge version 6 are evaluated in this study.
(5) PERSIANN
The Precipitation Estimation from Remotely Sensed Information Using Artificial Neural Networks (PERSIANN; http://chrsdata.eng.uci.edu) is developed by the Center for Hydrometeorology and Remote Sensing(CHRS) at the University of California, Irvine (UCI).The PERSIANN is the estimation of rainfall rate computed by the neural network function classification/approximation procedures and based on the infrared brightness temperature image from geostationary satellites.
(6) FY2PRE
The Precipitation Estimation from Fengyun-2(FY2PRE) series geostationary satellites (FY-2C–FY-2H) is produced by the National Satellite Meteorological Centre (NSMC) of CMA and can be obtained from http://satellite.nsmc.org.cn. The FY2PRE covers the period from June 2005 to December 2020. The SPPs derived from the newer satellite will be used in days when multiple satellites overlap. The monthly precipitation data of the FY2PRE are accumulated by the daily precipitation.
The GPM, GSMaP, and FY2PRE products have the resolution of 0.1° × 0.1° (approximately equivalent to the density of 1 per 100 km2), and the resolutions of TRMM,CMORPH, and PERSIANN products are 0.25° × 0.25°(approximately equivalent to the spatial density of 0.16 per 100 km2). The information about the SPPs is presented in Table 2.
2.4 Verification metrics
To quantify the performance of various products, we adopted several statistical metrics in this research(Table 3). The first four metrics, including the Pearson correlation coefficient (CORR), the relative bias (BIAS),the root-mean-square error (RMSE), and the standard deviation ratio (SDR), are calculated as follows [Eqs.(1)–(4)].

Table 2. Satellite-based precipitation products. The full names of the institutes and datasets are detailed in Section 2.3
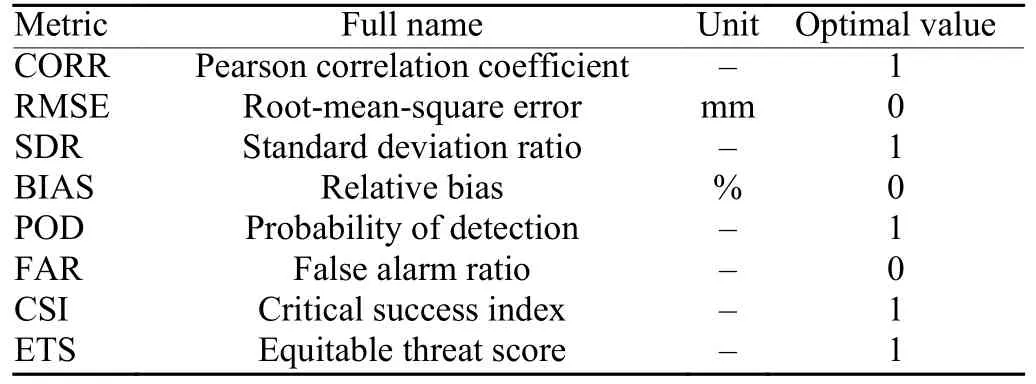
Table 3. Verification metrics
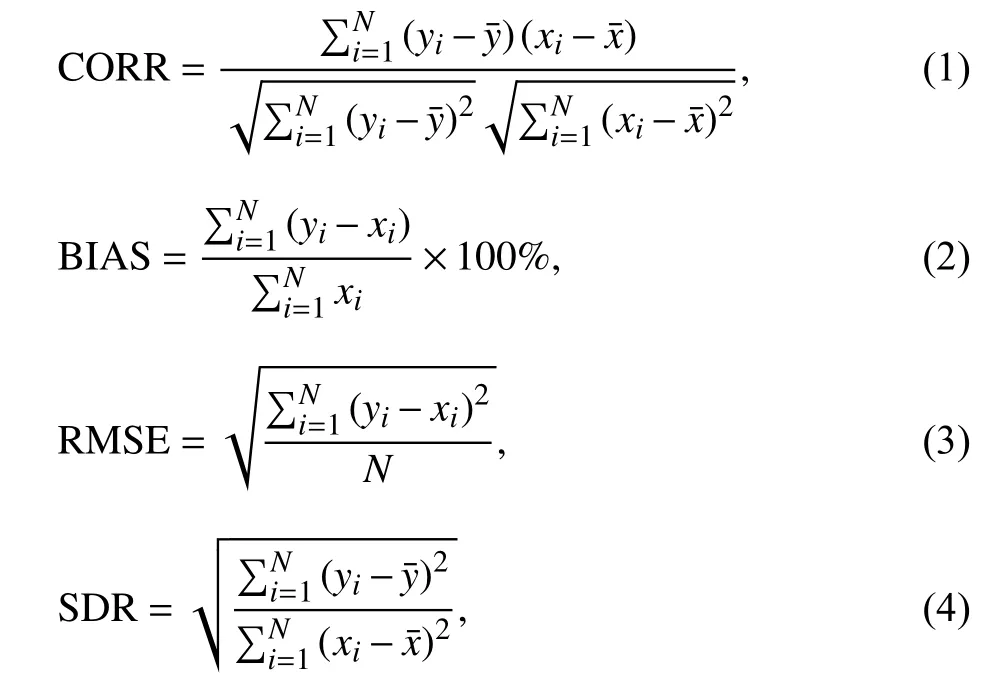
whereNis the total number of samples, andxandydenote the observed samples and the estimated samples,respectively.
The last four metrics, namely, the probability of detection (POD), the false alarm ratio (FAR), the critical success index (CSI), and the equitable threat score (ETS),are used to evaluate the performance of SPPs for the daily and hourly precipitation events. The calculation equations are as follows [Eqs. (5)–(8)].

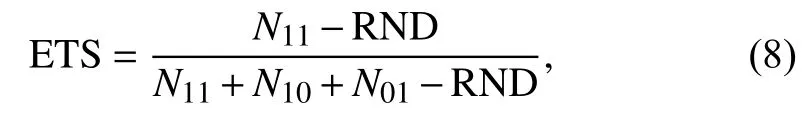
whereNis the number of samples,N11the precipitation from gauges and satellites,N10the precipitation only from satellites,N01the precipitation only from gauges,andN00the precipitation not observed by both gauges and satellites. POD is used to measure the precipitation events correctly detected by satellites, while FAR is applied to measure the precipitation events incorrectly detected. CSI and ETS are used to measure the correspondence between SPPs and in situ gauges, and ETS is modified by an adjustment coefficient of RND [Eq. (9)].

Due to the sparse observations and the uneven precipitation distribution caused by the complex terrain along the STR, the SPP data are interpolated into stations through the bilinear interpolation so as to obtain the verification metrics. In addition, we have tested the method of the nearest grid cell to the stations, and find that there is no significant difference to the bilinear method. An evaluation method proposed by Zhao and Yatagai (2014)has also been tested, and it also presents similar results for the performance of SPPs.
2.5 Comprehensive ranking
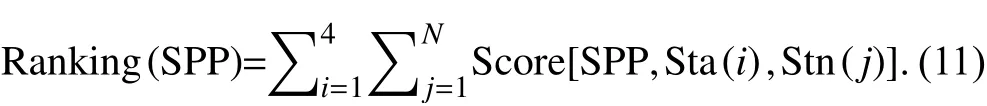
The objective ranking system proposed by Decker et al. (2012) is employed to rank the comprehensive performance of each SPP at a specific timescale, and the calculation method is as Eq. (10).

where Stn(j) represents thejth station (j= 1, ...,N), and Sta(i) denotes the score of theith statistical metric (i=1, ..., 4). The rankings of the yearly, monthly, daily, and diurnal-cycle assessments are performed by CORR,RMSE, SDR, and BIAS, and the rankings of the heavy precipitation events are conducted by POD, FAR, CSI,and ETS. Here,MBestandMWorstrespectively indicate the SPPs with the best and worst performance at thejth station measured by theith metric;MSPPis the metric of each SPP. Thus, the SPP with the best (worst) perform-ance receives a score of 100 (0), and the other SPPs receive a score of 0–100.
The ranking of an SPP is based on the comprehensive score against the gauges.
3. Verification results
3.1 Monthly and yearly timescales
Figure 2 displays the spatial distributions of mean yearly precipitation from rain gauges (Fig. 2a) and SPPs(Figs. 2b–g) along the STR. Most of the SPPs can well characterize the major spatial distribution of precipitation in the study area, except the PERSIANN. The precipitation distribution along the STR shows a decrease from southeast to northwest, with a local minimum over the central STR. In the study area, the microwave-based SPPs (TRMM, GPM, and GSMaP) better capture the spatial pattern of precipitation than the others. The CMORPH overestimates the rain-shadow effect of the Himalayas and Hengduan Mountains, and also has significant precipitation overestimations in the central Tibetan Plateau. The two SPPs (PERSIANN and FY2PRE) based on infrared data have a significant underestimation on the southeast side of the Tibetan Plateau and the SCB. Note that the PERSIANN shows a spurious heavy precipitation center over the northeastern Tibet Autonomous Region and southern Qinghai Province.

Fig. 2. Spatial variability of annual accumulated precipitation along the STR from (a) in situ rain gauges (the legend is the same as the color bar), (b) TRMM, (c) CMORPH, (d) GPM, (e) GSMaP, (f) PERSIANN, and (g) FY2PRE. The red thick line in each figure denotes the STR.

Fig. 3. Scatterplots of monthly precipitation from the gauge observation along the STR versus satellite-based precipitation products (SPPs) including (a) TRMM, (b) CMORPH, (c) GPM, (d) GSMaP, (e) PERSIANN, and (f) FY2PRE. The dash and solid lines denote best fitted performance (y = x) and linear fitting of the SPPs to observations, respectively.
Figure 3 shows the scatterplots of monthly SPPs versus the observations along the STR. The microwavebased SPPs (GPM, TRMM, and GSMaP) have almost the optimal correlation coefficients (more than 0.95) with monthly observations, while the infrared-based SPPs(PERSIANN and FY2PRE) have relatively low correlation coefficients (only about 0.6) with monthly observations. The CMORPH, GSMaP, and FY2PRE slightly underestimate the monthly precipitation (about -2% of the bias), while the GPM and TRMM show a slight overestimation. Moreover, the PERSIANN greatly overestimates the monthly precipitation compared with others.
Figure 4 presents the Taylor diagrams of the correlation coefficient (i.e., CORR), the centered RMSE, and the SDR between SPPs and rain gauge observations at the yearly and seasonal scales (Taylor, 2001). The CORR, RMSE, and SDR metrics are calculated by yearly and seasonal precipitation from rain gauges and SPPs.The centered RMSE has the same statistical significance as the RMSE, and its value ranges from 0 to 1. Therefore, it is more convenient to use this measurement in a Taylor diagram. In Fig. 4, the closer the distance between the centered value and the observation point (red point),the better the SPP performance is. The GPM, GSMaP,and TRMM have relatively good performance, and the CMORPH exhibits medium performance, but the FY2PRE and PERSIANN perform relatively poorly.There is no obvious pattern in the seasonal differences,with some SPPs performing better in the warm season and some in the cold season. In terms of the overall SPP accuracy at yearly and seasonal scales, the best performance is achieved in the SCB, followed by the WSC, and the worst is in the ET and CT. The performance of SPPs is closely related to the regional altitude. This will be discussed in Section 4, and it can be found that the above characteristics are more pronounced in summer.
3.2 Daily timescale
The density-color scatterplots and the quantitative comparison between SPPs and gauge observations for the daily precipitation along the STR (Fig. 5) show that all SPPs tend to overestimate daily precipitation in light precipitation days and underestimate that in heavy precipitation days. On average, all SPPs perform pretty well with daily CORR values of more than 0.6, except for the PERSIANN. The TRMM, GPM, and FY2PRE manifest slightly positive BIAS values of less than 10%, the CMORPH and GSMaP get small negative BIAS values of less than -5%, and the PERSIANN largely underestimates the precipitation (BIAS close to -50%). The GSMaP gets the smallest RMSE of less than 4 mm among all SPPs, while the RMSEs of the other five SPPs are about 5 mm. The RMSE is mainly derived from noprecipitation days, i.e., SPPs assign the observed no-precipitation day to a significant rainfall day, and conversely, treat the precipitation days as the no-precipitation days.
The probability distribution function (PDF) and cumulative distribution probability (CDF) of precipitation days and total precipitation amount can present useful information about the frequency histogram of a dataset. The PDF and CDF of the precipitation from rain gauges and SPPs along the STR are shown in Fig. 6. All of the SPPs and rain gauge data show that the highest percentage occurs at the rainfall intensity between 0 and 1 mm day-1,accounting for about 40% of the precipitation days. Compared with rain gauge observations, SPPs tend to underestimate the frequency of trace rain days (0.1 mm day-1)and overestimate the frequency of slight rain days (0.2–5 mm day-1). The GSMaP and PERSIANN remarkably overestimate the contribution of light rain (0.1–8 mm day-1) and underestimate the contribution of heavy rain,while the other four SPPs somewhat present the PDF and CDF of the precipitation amount.

Fig. 4. Taylor diagrams for correlation coefficients (CORR), standard deviation ratios (SDR), and normalized root-mean-square errors (RMSE)on the (a) entire ETP along the STR and (b) SCB, (c) WSC, (d) ET, and (e) CT.

Fig. 5. The two-dimensional distribution density of daily precipitation from the in situ rain gauges along the STR versus the SPPs of (a) TRMM,(b) CMORPH, (c) GPM, (d) GSMaP, (e) PERSIANN, and (f) FY2PRE.

Fig. 6. (a, c) Probability distribution function (PDF) and (b, d) cumulative distribution probability (CDF) of (a, b) daily precipitation days (PDs)and (c, d) total precipitation amount (TPA) with varying intensities over the entire ETP along the STR. The dashed lines denote the dominate precipitation intensities for the TPA (4 mm day-1) and the daily extreme precipitation (30 mm day-1).
The values of two crucial daily precipitation intensities, i.e., 4 and 30 mm day-1(Table 4), are detected in Fig. 6, where 4 mm day-1is the threshold contributing to the dominant precipitation amount. The precipitation days with the intensity of ≥ 4 mm day-1account for about 20%–30% of the total precipitation days and contribute more than 80% to the total precipitation amount.

Fig. 7. Spatial distributions of statistical metrics for the SPP daily precipitation of ≥ 4 mm day-1 along the STR: (a) POD, (b) FAR, (c) CSI, and(d) ETS. The panels from top to bottom show the results of the TRMM, CMORPH, GPM, GSMaP, PERSIANN, and FY2PRE, respectively.
Figure 7 presents the performance of SPPs for the precipitation days with the intensity of more than 4 mm day-1. Compared with other SPPs, the GSMaP performs better with higher POD, CSI, and ETS, as well as lower FAR. Conversely, the PERSIANN shows the worst performance. The POD, CSI, and ETS of the GPM are similar to those of the TRMM and CMORPH, but the FAR is lower. The POD of the FY2PRE is higher in the CT than that of the TRMM, CMORPH, and GPM. In general,SPPs perform better along the eastern STR (SCB and WSC) than along the western part (CT and ET), which may be due to the altitude difference.
The days with a precipitation intensity of more than 30 mm day-1are about 1% of the total precipitation days,and they are considered as the daily extreme precipitation events along the STR. These extreme precipitation events contribute about 15% of the total precipitation amount, except the GSMaP and PERSIANN that prominently underestimate the CDF of precipitation days and total precipitation amount with the precipitation intensity of more than 30 mm day-1. Table 5 shows the performance of SPPs for the daily extreme precipitation events.The performance of GSMaP and PERSIANN is the bestand worst among the SPPs, respectively. The performance of TRMM is slightly worse than that of CMORPH.The performance ranking of SPPs is significantly affected by the daily precipitation intensity.

Table 4. Cumulative distribution probability (CDF; %) of PDs and TPA for the key thresholds of daily precipitation intensity derived from multiple SPPs. OBS indicates the observations from rain gauges

Table 5. The evaluations of daily extreme precipitation events (≥ 30 mm day-1) of SPPs along the STR

Table 6. The CDF (%) of PHs and TPA for the key thresholds of hourly precipitation intensity derived from multiple SPPs
3.3 Hourly timescale
The density-color scatterplots of SPPs versus the gauge observations along the STR for the hourly precipitation (Fig. 8) show that all SPPs tend to overestimatethe hourly precipitation in light rain events and underestimate it in heavy rain events. The CMORPH and GPM show substantial overestimation (BIAS of more than 100%), particularly in the smaller precipitation ranges.The GSMaP slightly overestimates the hourly precipitation (BIAS of about 10%), while the PERSIANN and FY2PRE have a slight underestimation. The FY2PRE and PERSIANN generally underestimate the hourly precipitation intensity in all the precipitation ranges, while the others tend to overestimate the hourly precipitation in the smaller precipitation ranges and underestimate it in the larger precipitation ranges. The significant overestimation makes the large RMSEs of CMORPH and GPM,more than 2 mm h-1, while the RMSEs of others are less than 1.5 mm h-1. The CORR of the GSMaP is the largest,more than 0.4, followed by the GPM. The FY2PRE has the smallest RMSE and relatively small CORR.

Fig. 8. The two-dimensional distribution density of hourly precipitation from in situ rain gauges along the STR versus SPPs: (a) CMORPH, (b)GPM, (c) GSMaP, (d) PERSIANN, and (e) FY2PRE.
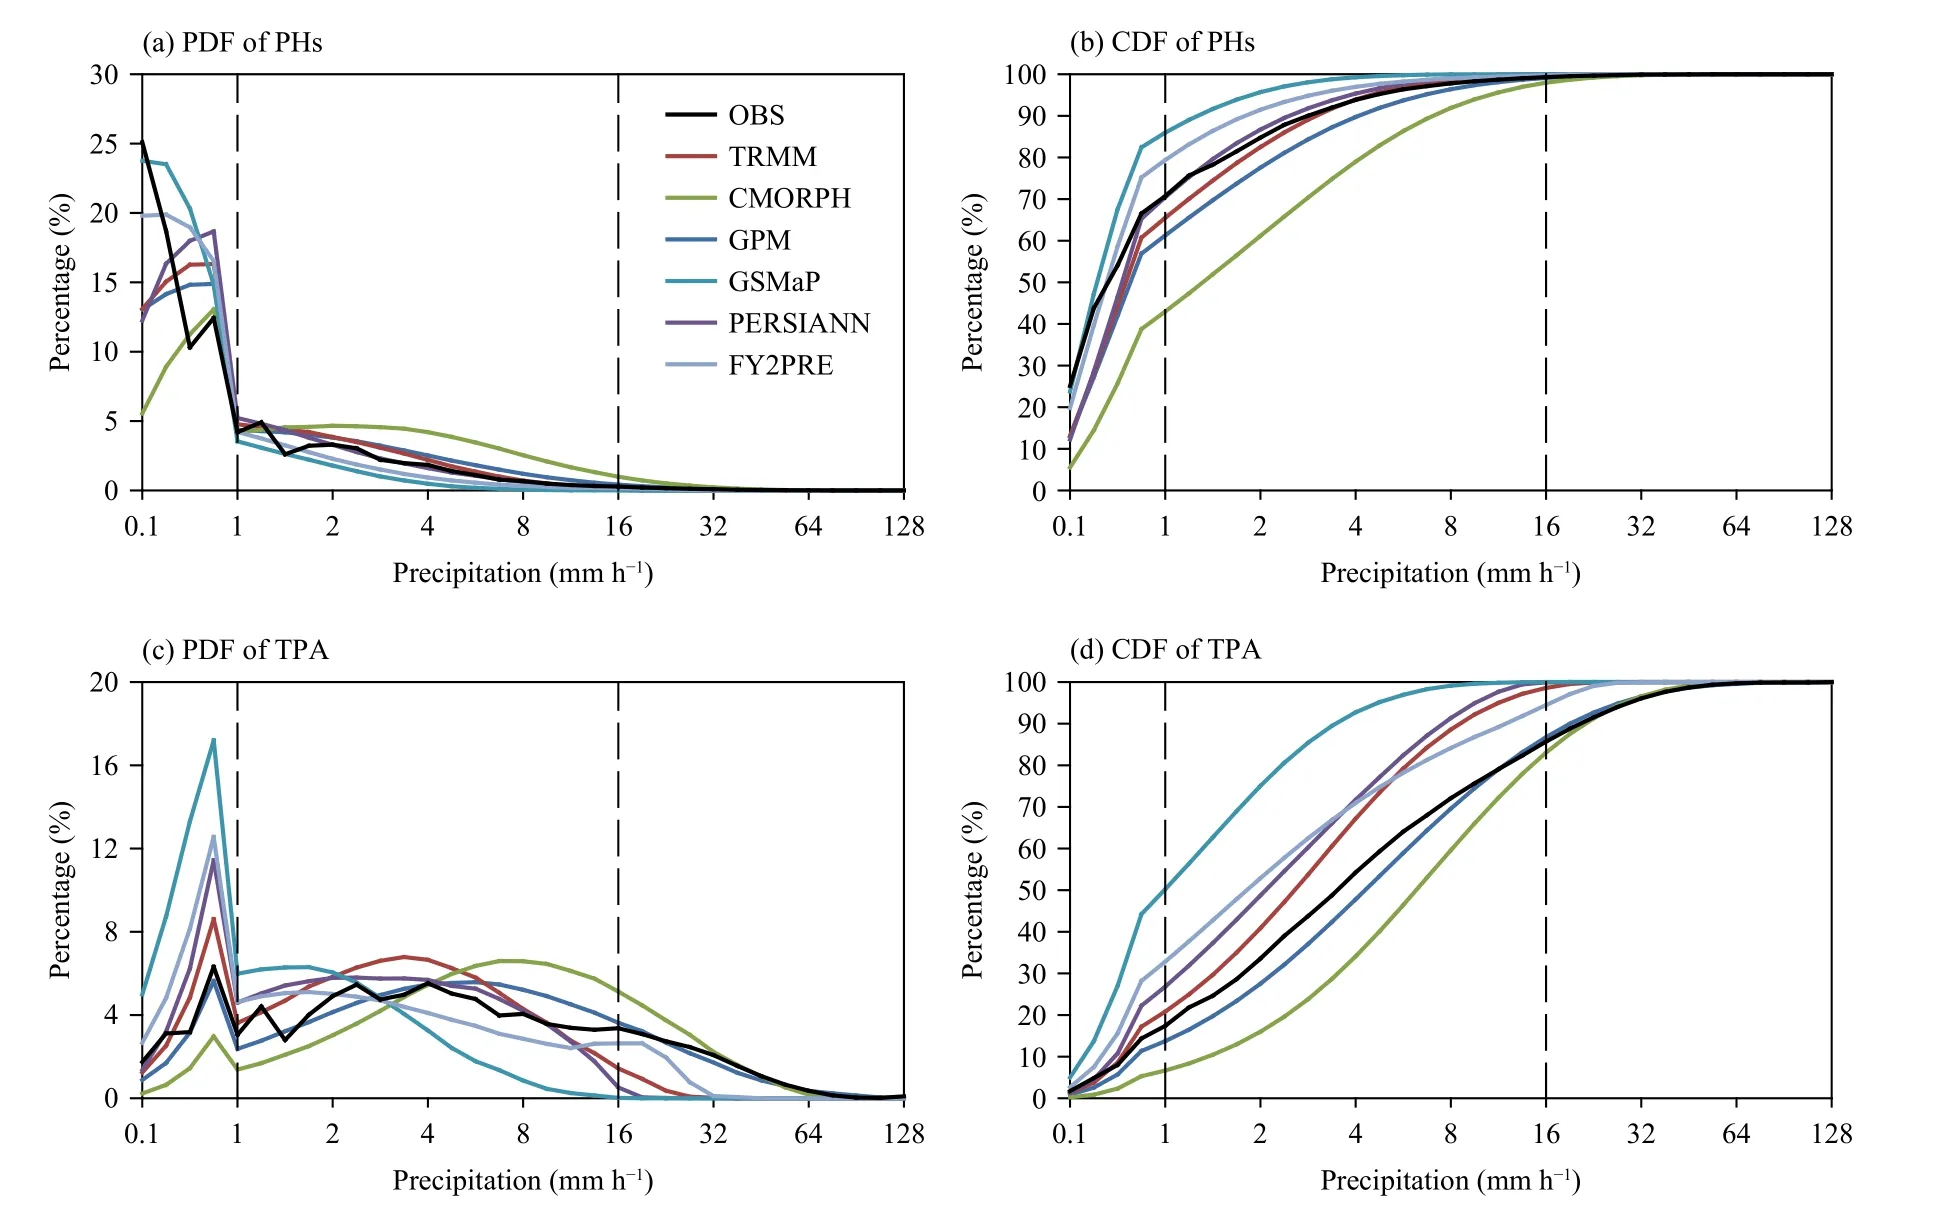
Fig. 9. As in Fig. 6, but for the hourly precipitation (PHs: precipitation hours). The dash lines denote the precipitation intensities of 1 and 16 mm h-1.
Figure 9 shows the PDF and CDF of precipitation hours and the total precipitation amount derived from SPPs and rain gauges. The consistency between SPPs and gauge observations is significantly lower than that of the daily precipitation. SPPs and gauge data show that the highest percentage occurs at the rainfall intensity of less than 1 mm h-1, accounting for about 60%–85% of the total precipitation hours, except for the CMORPH(about 40%). The GSMaP greatly overestimates the frequency of light rain (< 1 mm h-1), which accounts for 85% and 50% of the total precipitation hours and total precipitation amount, respectively, compared with only 65% and 15% for the observations. Conversely, the CMORPH greatly underestimates the frequency of light and moderate rain.
Table 6 shows the intensity of the dominant precipitation that contributes most of the total precipitation amount (1 mm h-1) and the threshold (16 mm h-1) of hourly extreme precipitation events identified from Fig. 9. The results suggest that in terms of gauge observation, the number of hours with a precipitation intensity of 1 mm h-1accounts for about 30% of the total precipitation hours, and its precipitation contributes more than 80% of total precipitation amount. The GSMaP remarkably underestimates the percentage of precipitation hours(14%) and the precipitation amount (less than 50%), and the CMORPH highly overestimates them (about 57% for precipitation hours and more than 93% for the precipitation amount). The other three SPPs (GPM, PERSIANN,and FY2PRE) have similar CDF values for the hourly precipitation of more than 1 mm h-1. These three SPPs occupy 20%–39% of the precipitation hours and contribute 73%–86% to the total precipitation.

Fig. 10. The spatial distributions of statistical metrics for the SPP hourly precipitation of ≥ 1 mm h-1 along the STR: (a) POD, (b) FAR, (c) CSI,and (d) ETS. The panels from top to bottom show the results of CMORPH, GPM, GSMaP, PERSIANN, and FY2PRE, respectively.

Fig. 11. The diurnal cycle of precipitation from the AWS network and SPPs in the warm season (May–September) along the STR and in the sub-regions: (a) SCB, (b) WSC, (c) ET, and (d) CT. The gray shaded area denotes the hours in the nighttime.
Figure 10 presents the performance of SPPs for the hourly precipitation intensity of more than 1 mm h-1along the STR. It can be found that the CMORPH and the GPM have higher FAR than other SPPs. The POD values of FY2PRE and GSMaP are the highest and the second-highest compared with other SPPs, respectively.The FAR of FY2PRE is larger than that of GSMaP, particularly in the western part of the STR. Overall, the FY2PRE has the best performance for the CSI and ETS metrics, followed by the GSMaP. Same as the daily timescale, SPPs perform better along the eastern STR than the western part (CT and ET).
The hours of observed precipitation with the intensity of more than 16 mm h-1occupy about 1% of the total precipitation hours, and thus the precipitation with such intensity is referred to as hourly extreme precipitation events along the STR (as shown in Table 6). These extreme precipitation events contribute about 16%–20% of precipitation for gauge observations and SPPs, except for the GSMaP and PERSIANN that account for less than 1% of the hourly extreme precipitation events. Table 7 shows the performance of SPPs for the hourly extreme precipitation events, and the performance is different for various verification metrics. Although the GSMaP has the highest POD and the lowest FAR, it performs the worst for the CSI and ETS metrics due to the significant underestimation for the PDF of hourly extreme precipitation events. The FY2PRE performs well for POD and FAR, but has relatively worse CSI and ETS metrics than the GPM. The CSI and ETS of the GPM are the highest,but it performs the worst for POD and FAR.
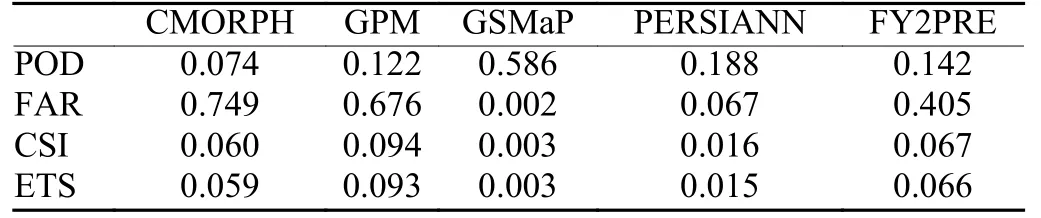
Table 7. Evaluations of SPPs for the hourly extreme precipitation (16 mm h-1) along the STR
3.4 Diurnal cycle
As the diurnal variation is the basic characteristic of precipitation, the performance of SPPs on the diurnal cycle is an important factor in measuring their capabilities (Guo et al., 2014; Yu et al., 2014; Tan et al., 2019; de Sousa Afonso et al., 2020; Song and Zhang, 2020).Figure 11 shows the relative ratios derived from SPPs and gauge observations in the sub-regions along the STR at the local solar time (LST). In the SCB, which is a flat plain, SPPs can well reflect the diurnal cycle of precipitation, including the peak in the evening (at about 1900 LST) and the valley at about 0900 LST, and the precipitation occurring at nighttime (1900–0700 LST) contributes about 73% of the total precipitation both for SPPs and gauge observations. In the WSC, the precipitation ratio is the highest at night, more than 80%. SPPs can well capture this feature, with the precipitation ratio of 72%–81% at night, although SPPs exhibit one hour ahead of the peak and valley time compared with the observations.In the ET and CT, the peak time of SPPs is advanced earlier to around 2000 LST compared with the peak time of about 0000 LST for the observations from rain gauges.In addition, SPPs identify one hour ahead of the valley time compared with gauge observations. SPPs overestimate the precipitation contribution in the early morning and underestimate that in the late nighttime in the ET and CT, thus well characterizing the relative ratios of the precipitation in the nighttime in these two regions.
Although the various SPPs perform quite differently at the hourly timescale, they exhibit highly similar features in the diurnal cycle. Except for the GSMaP, it appears a particular valley at the late nighttime (about 0400–0600 LST), which is different with other SPPs. Overall, as demonstrated by SPPs and gauge observations, the precipitation along the STR is concentrated at night (more than 70% of total precipitation) in all sub-regions. Compared with the situations at the eastern side of the Tibetan Plateau (SCB and WSC), the performance of SPPs is worse in characterizing the diurnal cycle of precipitation on the Tibetan Plateau (ET and CT), indicating that the complex terrain affects not only the precipitation intensity but also the diurnal cycle reproduced by SPPs (Song and Zhang, 2020).
3.5 Ranking summary
The relative ranking of SPPs at various timescales is presented in Table 8. The GPM performs the best at monthly timescale and the second-best at daily and hourly timescales. The GSMaP has perfect performance at daily timescale. The FY2PRE has the best performance at hourly timescale and for the hourly precipitation events but performs worse in the other evaluations. The previous evaluations on SPPs in the other regions (Xu et al., 2019; Lu et al., 2020) also suggested that the FY2PRE performs better than the GPM at hourly times-cale and has worse performance at daily and monthly timescales, indicating that the varying performance of FY2PRE is not a regional feature but an overall one. As a subsequent product of TRMM, the GPM performs better than TRMM and CMORPH among all evaluations. Due to the observational limitations to build a model in the study area, the performance of PERSIANN is worse than other SPPs. Although SPPs perform differently at multiple timescales, the GPM is generally the relative optimal choice since it performs well in all evaluations. Although the daily evaluation metrics show that the GSMaP performs better than GPM, the GSMaP highly underestimates the heavy precipitation days, and thus its performance is worse than the GPM. In addition, the best performance of FY2PRE may be affected by more in situ observations, which is more integrated than the other SPPs.
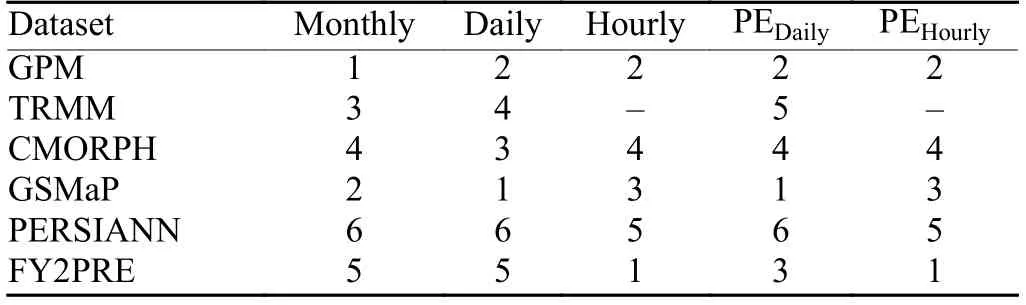
Table 8. Relative ranking of SPPs at various timescales. PEDaily represents the daily precipitation events and PEHourly indicates the hourly precipitation events
4. Discussion: factors relating to SPP performance
4.1 Influence of elevation on SPP performance
Terrain effect may be a crucial factor that influences SPP performance, especially on the Tibetan Plateau(Zambrano-Bigiarini et al., 2017; Zhang et al., 2018;Soomro et al., 2019; Yu L. F. et al., 2020), and the variations in the evaluation metrics at daily and hourly timescales with increasing elevation are investigated in this research. For the daily precipitation evaluation (not shown), the CORR of SPPs decreases with increasing elevation, except for the GSMaP. The PERSIANN highly underestimates the daily precipitation, with a large BIAS,while the GSMaP is nearly to be perfect (BIAS close to 0.0) and varies slightly in pace with the elevation. The BIAS values of the other four SPPs show that they underestimate precipitation at lower altitudes and overestimate at higher altitudes. The RMSE of GSMaP is the lowest among all the SPPs and slightly decreases with increasing elevation, while the RMSE values of the other five SPPs are more significant at higher altitudes. The RMSE of FY2PRE increases the fastest among all SPPs with increasing elevation. The SDR shows that in the regions with higher altitudes, all SPPs overestimate the standard deviation of daily precipitation compared with the regions with lower altitudes.
The same features are identified from the verified metrics for the major precipitation events (≥ 4.0 mm day-1and 1 mm h-1; Fig. 12 shows the result of daily precipitation ≥ 4.0 mm day-1). The POD, CSI, and ETS decrease with increasing elevation, and the FAR enlarges in pace with increasing elevation. In contrast, the POD, CSI, and ETS of all SPPs for the hourly precipitation events decrease with the increase of elevation. This result reveals the possibility of improving the accuracy of satellite rainfall retrieval in regions with complex terrain. Overall,since the capabilities of SPPs to detect precipitation events decrease with increasing elevation, and there is a lack of observations, SPPs are more demanding in the higher terrain regions. Therefore, it is more imperative to improve the quality of SPPs in the mountainous regions.

Fig. 12. The elevation against the evaluation metrics of the daily precipitation: (a) POD, (b) FAR, (c) CSI, and (d) ETS. The dash and solid lines indicate the linear regression of the metric to the elevation, and the dash (solid) line denotes that the metric decreases (increases) with increasing elevation.
4.2 Influence of precipitation intensity on SPP performance
The SPP performance is strongly affected by the precipitation intensity. The correlation of daily metrics with the precipitation intensity is presented in Fig. 13. The POD, CSI, and ETS of GSMaP are the largest, while those of PERSIANN are the least. Generally, the POD,CSI, and ETS of SPPs decrease with increasing precipitation intensity, and remain constant after the intensity reaching about 25 mm day-1. The FAR of GSMaP is the lowest among all SPPs and changes insignificantly with increasing precipitation intensity. The FAR of TRMM,CMORPH, GPM, and FY2PRE increases with increasing precipitation intensity and remains constant after the intensity reaching 25 mm day-1, while the FAR of PERSIANN decreases with the increase of precipitation intensity.
The relationship between the hourly precipitation intensity and the evaluation metrics demonstrates the similar feature as the daily precipitation (not shown). The POD, CSI, and ETS of SPPs decrease with the increase of hourly precipitation intensity. The FAR of PERSIANN and GSMaP increases with the increasing hourly precipitation intensity, and that of the other three SPPs exhibits the opposite curve. It is caused by the significant underestimation of the hourly heavy precipitation in the PERSIANN and GSMaP. The relationships between verification metrics and the hourly precipitation intensity suggest that the ability of SPPs to detect heavy precipitation decreases.
5. Conclusions
To determine the SPP performance along the STR, we select six widely used products, i.e., TRMM, CMORPH,GPM, GSMaP, PERSIANN, and FY2PRE, to conduct comparisons with the rain gauge observations at multiple timescales (monthly, daily, and hourly). In addition,the two factors (elevation and precipitation intensity) relating to SPP performance are examined in this study.The main conclusions are as follows.
SPPs can well capture the spatiotemporal characteristics of precipitation along the STR at multiple timescales,i.e., hourly, daily, monthly, and seasonal scales. Overall,SPPs can well reproduce the diurnal cycle of precipitation along the eastern STR, but the performance is not satisfactory in the western STR. Based on the evaluations, SPPs can be utilized to monitor the long-term(monthly and yearly scales) and short-term (daily and hourly scales) precipitation, as well as the extreme precipitation events in the meteorological and hydrological services for the STR construction and operation.
The SPP with the best performance is different at various timescales, indicating that selecting SPP should refer to the SPP performance at particular timescales and in specific regions. Based on the evaluations of SPPs along the STR, we suggest that the GPM, TRMM, and GSMaP are suitable for the monthly timescale, and the GSMaP,GPM, and CMORPH are appropriate for the daily timescale. In addition, the FY2PRE, GPM, and GSMaP perform fairly well at hourly timescale. If there is only one choice for multiple timescales, we recommend the GPM,which has the best or second-best performance in most scenarios. Moreover, the record length and the spatiotemporal resolution of GPM are adequate for most meteorological and hydrological service needs.
The SPP performance is strongly affected by the elevation and the precipitation intensity. In general, SPPs perform the worst at higher terrain and in the case of stronger precipitation.
As the successor of TRMM, GPM has been remarkably improved in quality compared with TRMM and CMORPH. The performance of GSMaP is comparable to that of GPM. However, GSMaP performs substantially worse than GPM in characterizing light rain, whether for the daily timescale or the hourly timescale. The poor performance of PERSIANN compared with FY2PRE that also uses the infrared cloud image for retrieval indicates that the precipitation estimation from satellite observations through statistical methods (e.g., artificial neural networks) needs to be closely combined with the in situ ground-based observations, so as to obtain better results.
The performance of various SPPs at multiple timescales is evaluated in the present study, despite within the specific region along the STR. It has the potential to provide some valuable feedback to algorithm developers,particularly for regions with complex terrain. It would be a useful step to further investigate the capability of SPPs in detecting and characterizing individual daily extreme precipitation events and hourly extreme precipitation events, and to examine the utilization of the SPPs as the calibration to improve the numerical weather prediction models along the STR and other complex mountainous regions.
 Journal of Meteorological Research2022年5期
- Journal of Meteorological Research的其它文章
- Progress and Prospects of Research on Subseasonal to Seasonal Variability and Prediction of the East Asian Monsoon
- An Empirical Model of Tropical Cyclone Intensity Forecast in the Western North Pacific
- Intensified Impact of the Equatorial QBO in August–September on the Northern Stratospheric Polar Vortex in December–January since the Late 1990s
- Interannual Relationship between Summer North Atlantic Oscillation and Subsequent November Precipitation Anomalies over Yunnan in Southwest China
- Stochastically Perturbed Parameterizations for the Process-Level Representation of Model Uncertainties in the CMA Global Ensemble Prediction System
- Assimilation of All-Sky Radiance from the FY-3 MWHS-2 with the Yinhe 4D-Var System