Evaluation of the Effect of Multiparticle on Lithium-Ion Battery Performance Using an Electrochemical Model
Yizhao Gao,, Jingzhe Zhu, and Xi Zhang
Dear editor,
This letter focuses on modeling the electrode heterogeneity by extending the pseudo-two-dimensional model (P2D) with actual particle-size distributions (PSD). The effects of different particle characterization techniques, including the area-weighted, volume-weighted,and number-based methods on cell dynamics are compared. The model with number-based PSD achieves better rate capability (maximum 2.0% improvement in capacity, maximum 2.6% increase in energy). Besides, the effectiveness of the multiparticle (MP) model is evaluated against the single-particle model (SPME) and P2D model under fast charging conditions. Results show that the PSD generates greater heterogeneities of cell internal states at higher C-rates current.
Related work: Understanding the microstructural properties of batteries is of considerable significance to cell design in order to optimize the performance of lithium-ion batteries [1]-[3]. Both positive and negative electrodes have complex porous structures composed of electroactive particles of various sizes. This yields a highly heterogeneous system. The multiparticle electrodes have an impact on the cell rate capability [4], mechanical stress [5], and resistive heating [6].Electrochemical models are effective tools to predict the electrochemical performances of lithium-ion batteries [7]. Incorporating microstructure into battery models can provide design criteria for enhanced battery performance. The PSD can quantify the many-particle effects. In this work, a two-dimensional microstructural model is presented to analyze the impact of PSD on performance.
The Doyle-Fuller-Newman (DFN) model is a classic multi-scale electrode particle to a single cell [8]. The cell-scale electrochemical states, including the potentials and electrolyte lithium concentrations,are coupled across the electrodes to the particle-scale for surface concentration predictions. However, the heterogeneous electrode features consisting of various-sized particles is usually neglected. The PSD of an electrode can be characterized experimentally in different ways concerning the weighting of individual particles. The weighting mechanism depends on the measuring principle being used [9]. A frequency or cumulative distribution curve is commonly used to represent the distribution. Generally, there are three different weighted methods: number-weighted distributions, volume-weighted distributions, and area-weighted distributions [10]. The number weighted distribution is a counting technique where each particle is given equal weighting irrespective of its size. The contribution of each particle in the area and volume-weighted distribution is related to the area and volume of each particle, respectively. Although it is well known that the smaller particles could provide better performances,the influences of the different PSD characterization methods are not investigated.
The PSD of the active material is a fundamental property in Li-ion batteries. However, the impact of different PSD quantification methods on cell performance is scarcely addressed in current research.Hence, in this letter, we aim to use a multiparticle model that considers the PSD of the active material to analyze the performance of cell electrodes. In detail, the negative and positive electrodes are described with distributed particle sizes of the active material. The PSD is characterized by three methods: number-weighted, volumeweighted, and area-weighted distributions. The effects of the size of these distributions on the electrode performance were investigated. In addition, the multiparticle model is compared with the single-particle model and P2D model under fast charging protocols to evaluate the advantages of the PSD. Furthermore, the effects of PSD on the surface concentration and current density are explored. This work makes the following contributions:
1) A two-dimensional MP model is presented considering the PSD at two electrodes. The effect of the spread of PSD on the cell rate capability and the electrode dynamics is investigated.
2) The numerical solutions of the MP model for different PSDs,including the number-based, volume-weighted, and area-based methods are presented.
3) A comparative study is carried out between the MP model, single particle model, and P2D model. The model performances under fast charging are examined.
Problem statement: Usually, the P2D model assumes that the electrodes are macro-homogeneous. The non-uniform distribution of particles leads to an inhomogeneous microstructure within the electrodes. The particle heterogeneity appears on μm length scale. The PSD has different approximation functions. The choice of PSD expressions dramatically impacts the results of local current density distribution. Including the microscale structures would increase the computational cost of the model inevitably. Therefore, selecting the appropriate PSD functions and accounting for the contribution of microstructural heterogeneity in battery macro-homogeneous models is challenging.
Model implementation and computation time: The MP model is implemented by discretizing the spatial dimensions using the finite volume method to convert the system of partial-differential-equations (PDEs) into a system of differential-algebraic equations(DAEs). The separator, negative electrode, positive electrode, and particle radius are discretized withNpoints. This turns the variables in the model into a state vector, and replaces spatial operators with matrix-vector multiplications, ready to be passed to a time-stepping algorithm. Finally, a solver is used to solve the problem. The model is simulated using Python on a workstation with Intel(R) Xeon(R)Silver 4214R CPU @ 2.40GHz and 16GB RAM. Increasing the number of points in the mesh could obtain more accurate solutions but need longer computational time. For real-time automation applications, it is desirable to solve with an acceptable degree of accuracy but in a shorter computational time. A pure C++ implementation of the models would increase the speed of model simulations. In Table 1,we compare the solutions of the MP model with 5, 10, 20, 30, 40,and 50 points in each domain (negative electrode, separator, positive electrode, negative particle, and positive particle) across the 1C discharge test. The RMS voltage error is calculated with respect to the MP model solution with 100 points in each domain. The key observation from Table 1 is that for a relatively small increase in RMS voltage error, a pronounced decrease in computation time is achieved. Further, it is noted that the 30 mesh points increase the MP model’s accuracy by an order of magnitude while maintaining a similar computation time compared with 20 mesh points. Therefore,achieving an accurate and fast solution of the MP model for real-time automation applications is feasible by carefully choosing an appropriate partial discretization method and the number of mesh points.
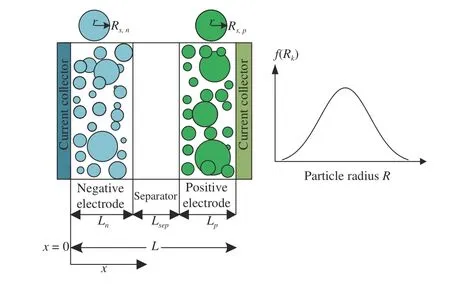
Fig. 1. The structure of multiparticle model (left) and particle radius distribution (right).
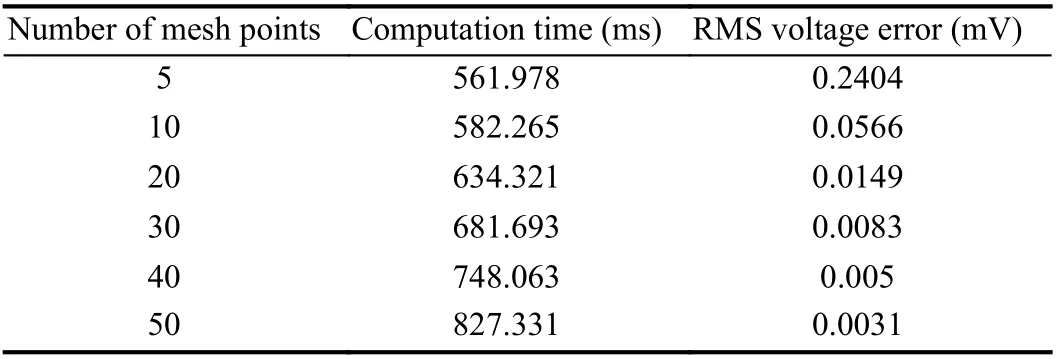
Table 1.RMS Voltage Error Relative to the MP Model With 100 x-Grid Points in Each of the Domains: Negative Electrode, Separator, and Positive Electrode; as well as 100 r-Grid Points in the Particles
Effects of PSD methods on rate capability: Different means and variances can be defined depending on how the PSD is collected and analyzed. The three most commonly used methods for particle sizing,including the area-weighted, volume-weighted, and number-based are described below. Each particle is given equal weighting for number weighted distributions, irrespective of size. Volume weighted distributions is related to the volume of that particle. Area weighted distribution means that each particle is counted according to its surface area. The particles are assumed to be spherical. The experimental measurements of the PSDs of positive and negative electrode particles are summarized. The lognormal PSDs with the area-weighted,number-based, and volume-based are calculated. Table 2 summarizes the mean and variance of the particle radius with these methods.It can be observed that the volume-based method produces the largest mean particle radius compared with area-weighted and number-based methods. The number-based mean radius is the smallest. The results may differ from the specific electrode design. The effects of different PSD quantification methods on cell rate capability and output energy are studied in Fig. 2. The cell is discharged from 100% SOC to a terminal voltage of 3.1V. As it can be seen in Fig. 2(a), the number-based radius generates the most discharge capacity since the number-based mean particle is smaller. In Fig. 2(b), the numberbased mean particle could achieve the best output energy. To evaluate the local current densities across the electrodes for different PSDs, the interfacial current density in the positive electrodejpand negative electrodejnfor a 1C discharge process are depicted in Fig. 3. The large PSDs current density is almost constant across the positive electrode. However, the current density can be considerably smaller than for larger ones for smaller number-based PSD. This implies that small-scale PSDs show lower internal resistance and provide a higher electrode capacity and energy. The MP model provides insights into the porous structure and PSD, benefiting the design and optimization of micro-structure for electrodes. Therefore, the electrode structures with better cell rate capability could be selected with the help of the MP model, which could improve the dynamic performances of electric vehicles.
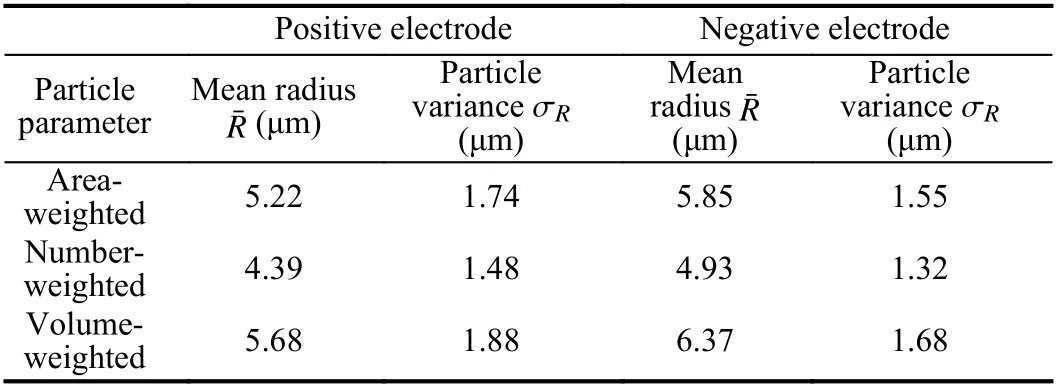
Table 2.PSD Lognormal Parameters
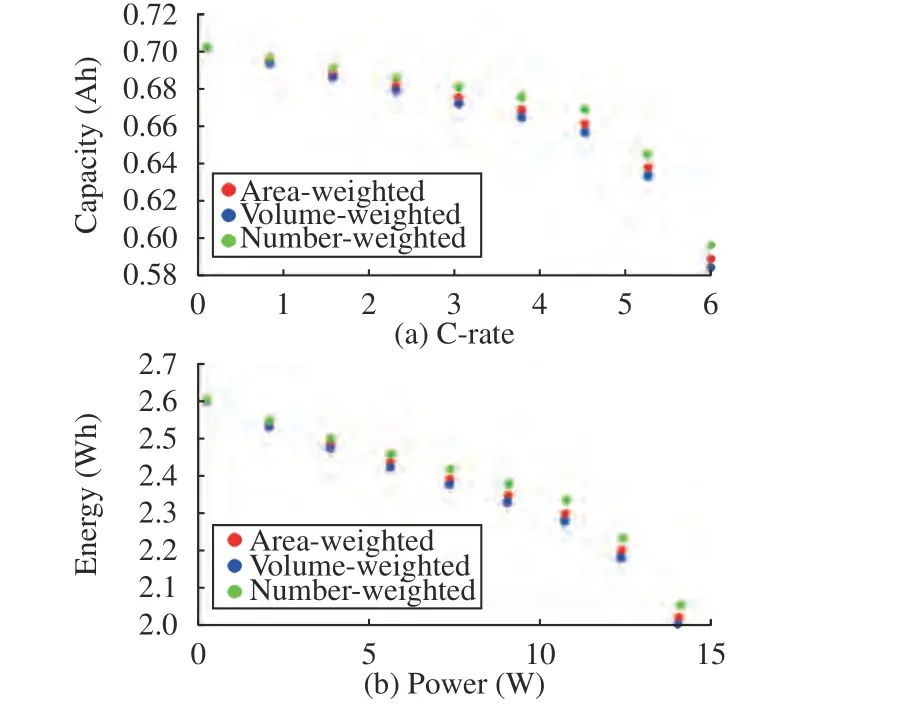
Fig. 2. Cell discharge capacity versus current C-rates with area-weighted, volume-weighted, and number-weighted PSD quantification methods (a). The output energy versus power with area-weighted, volume-weighted, and number-weighted PSD quantification methods (b).
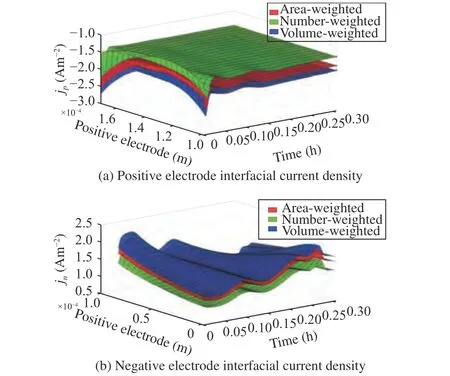
Fig. 3. Interfacial current density across electrodes throughout a 1C discharge test with area-weighted, number-based, and volume-weighted PSD quantification methods. (a) Positive electrode; (b) Negative electrode.
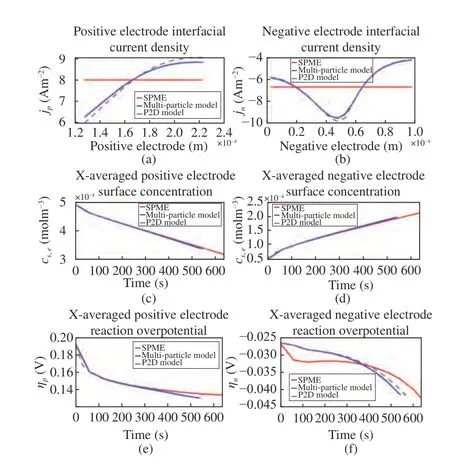
Fig. 4. Solid-phase electrochemical states across 5C CCCV charge test with single particle model with electrolyte (SPME), multiparticle model, and P2D model. (a) Positive electrode interfacial current density at the end of charge;(b) Negative electrode interfacial current density at the end of charge; (c) Xaveraged positive electrode surface concentration; (d) X-averaged negative electrode surface concentration; (e) X-averaged positive electrode reaction overpotential; (f) X-averaged negative electrode reaction overpotential.
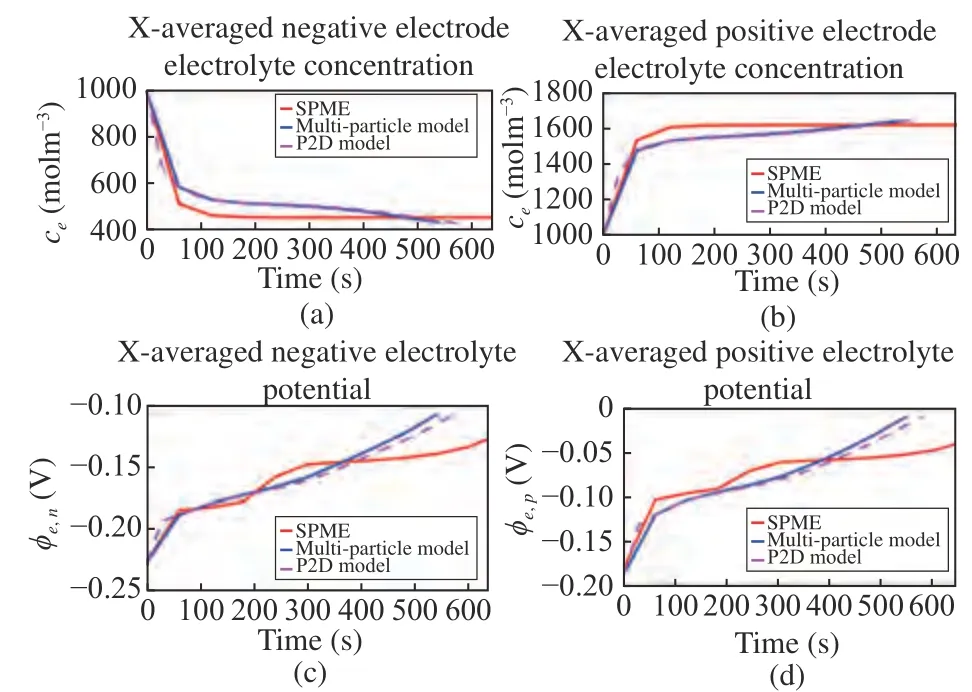
Fig. 5. Electrolyte-phase electrochemical states across 5C CCCV charge test with single particle model with electrolyte (SPME), multiparticle model, and P2D model. (a) Electrolyte current density; (b) X-averaged separator electrolyte concentration; (c) X-averaged negative electrode electrolyte concentration; (d) X-averaged positive electrode electrolyte concentration.
 IEEE/CAA Journal of Automatica Sinica2022年10期
- IEEE/CAA Journal of Automatica Sinica的其它文章
- Distributed Cooperative Learning for Discrete-Time Strict-Feedback Multi Agent Systems Over Directed Graphs
- An Adaptive Padding Correlation Filter With Group Feature Fusion for Robust Visual Tracking
- Interaction-Aware Cut-In Trajectory Prediction and Risk Assessment in Mixed Traffic
- Designing Discrete Predictor-Based Controllers for Networked Control Systems with Time-varying Delays: Application to A Visual Servo Inverted Pendulum System
- A New Noise-Tolerant Dual-Neural-Network Scheme for Robust Kinematic Control of Robotic Arms With Unknown Models
- A Fully Distributed Hybrid Control Framework For Non-Differentiable Multi-Agent Optimization
