Chinese Sunspot Drawings and Their Digitization—(VII) Sunspot Penumbra to Umbra Area Ratio Using the Hand-Drawing Records from Yunnan Observatories
Jia-Wei Hou, Shu-Guang Zeng, Sheng Zheng, Xiao-Yu Luo, Lin-Hua Deng, Yang-Yang Li, Yan-Qing Chen,Gang-Hua Lin, Yong-Li Feng, and Jin-Ping Tao
1 Center for Astronomy and Space Sciences, China Three Gorges University, Yichang 443002, China; zengshuguang19@163.com
2 College of Science, China Three Gorges University, Yichang 443002, China
3 Yunnan Observatories, Chinese Academy of Sciences, Kunming 650216, China
4 National Astronomical Observatories, Chinese Academy of Sciences, Beijing 100101, China
Abstract The ratio of penumbral to umbra area of sunspots plays a crucial role in the solar physics fields, especially for understanding the origin and evolution of the solar activity cycle. By analyzing the recently digitized sunspot drawings observed from Yunnan Observatories (1957–2021), we investigate the long-term variation of the penumbral to umbra area ratio of sunspots.An automatic extraction method,based on the maximum between-class variance and the morphological discrimination,is used to accurately extract penumbra and umbra and to calculate the ratio over six solar cycles(cycle 19–24).The expected value of the ratio of penumbra to umbra area is found to be 6.63±0.98, and it does not exhibit any systematic variation with sunspot latitudes and phases. The average ratio fluctuates from 5 to 7.5 per year and the overall trend has decreased after 1999 compared to the previous one.The ratio of sunspot penumbra to umbra area satisfies the log-normal distribution, implying that its variation is related to the evolution of the photospheric magnetic field. Our results are consistent with previous works.
Key words: (Sun:) sunspots – Sun: photosphere – Sun: activity – techniques: image processing
1. Introduction
Sunspots are the most significant observational features on the photosphere,which act as an excellent proxy for the elevenyear solar cycle and the magnetic activities. The only direct record of solar activity is represented by the time series of sunspot number (SN) (Clette et al. 2014). Sunspots are the regions with lower temperatures and stronger magnetic fields than the rest of solar surface (Hale et al. 1919). A typical sunspot seen in the white-light images has a two-part structure:a light penumbra and a darker umbra (Jha et al. 2018). When the number or area of sunspots increases, other activity phenomena such as flares and prominences in the higher atmospheric layers increase (Solanki 2003). As pointed out by Jin et al. (2006), the geometrical properties of solar sunspots including the sunspot area, umbral area and penumbra-umbra radius ratio are influenced by the magnetic fields. Therefore,knowledge of the long-term variations in the umbra and penumbra area will help us better understand the solar activity variabilities.
By analyzing the magnetic field intensity as a function of the areas of the umbrae, Nicholson (1933) used the data sets from the Royal Greenwich Observatory (RGO) during the period between 1917 and 1920, and found that the average ratio of penumbra to umbra is around 4.7. Based on the sunspot observations from the RGO, Jensen et al. (1955), by studying 650 regular sunspots with an area greater than 50 μhem(millionths of solar hemisphere) during the period 1878–1945,noted that the ratio of penumbra to umbra area decreases as the size of the sunspot increases,but this variation is much weaker than the result given by Waldmeier (1939) who used a much smaller sample (only contains 53 sunspots). Furthermore, they found that the ratio of penumbra to umbra area in the maximum phase of a cycle is smaller than that in the minimum phase of a cycle.Afterwards,by extending the observational data to 1954,Jensen et al. (1956) extracted 845 single regular sunspots, and verified their previous conclusions again.Vaquero et al.(2005)studied the sunspot data observed by de La Rue et al.(1869, 1870) from 1862 to 1866, and found that the ratio of penumbra to umbra area is around 3.9. Hathaway (2013)analyzed the ratio between the penumbra and umbra area of a sunspot group by using the observations as recorded in RGO data for the period 1874–1976. This work pointed out the possible existence of a secular variation in the penumbra-umbra ratio. In order to confirm the result proposed by Hathaway(2013),Carrasco et al.(2018a)employed data from the sunspot catalog published by the Coimbra Astronomical Observatory for the period 1929–1941 to compare with those of RGO. But these results do not confirm the secular variation suggested by Hathaway (2013). Carrasco et al. (2018b) studied the ratio of sunspot penumbra to penumbra during the Maunder minimum and found that the ratio is not different from other periods.Jha et al.(2019)analyzed the long-term behavior of the ratio of the sunspot penumbra to umbra area by digitized Kodaikanal white-light data,and it indicated that the ratio of the penumbra to umbra area increases when the sunspot area increases.
Based on the maximum between-class variance and the mathematical morphology,our work automatically extracts the sunspot umbra and penumbra from the sunspot drawings of Yunnan Observatories (YNAO), Chinese Academy of Sciences. Then we analyze the ratio of sunspot penumbra to umbra area,including the variation at different phases of a solar cycle and at different cycles.The rest of this paper is structured as follows. In Section 2, the observation data and processing methods used in this work are introduced. The processed data are analyzed from several aspects in Section 3. Finally, in Section 4 our conclusions are summarized.
2. Data and Method
2.1. Data
The statistical analysis of sunspots is of great significance,which can help us understand not only the origin of the solar cycle but also the impacts of solar activities on the Earth.Chinese observatories commenced to observe and record sunspots a long time ago. The observational data used in this paper are the digitized sunspot drawings recorded by YNAO during the period from 1957 January to 2021 May,with a total of 15,753 images.The left panel of Figure 1 shows an example of the sunspot hand-drawing record on 2011 November 11 from YNAO, while two sunspots selected from this example are displayed in the right panels of Figure 1.
Several works have used the sunspot observations made in the YNAO.Lin et al.(2019)introduced the digitized processes of the sunspot hand-drawing records,recorded information,etc.made in YNAO and Purple Mountain Astronomical Observatory(PMO),etc.In order to verify the observed accuracy of the sunspot hand-drawing records by YNAO, Peng et al. (2020)analyzed the accuracy of the sunspot hand-drawing records based on the solar satellite data. Luo et al. (2021) used the sunspot hand-drawing records to study the solar rotation profile.
2.2. Method
In general, sunspots recognitions from massive solar data need too much time and too many efforts for traditional manmachine interactive methods, thus an automatic boundary detection algorithm is adopted in this work. We recognize the sunspots from sunspot drawings of YNAO by three steps.Figure 2(a) is an example of the original hand-drawing image in our extraction process.First of all,we separate the Sun circle from the entire image by color image RGB channel(Figure 2(b)). The second step is that we extract sunspots from the full-disk solar image. Figure 2(c) is obtained from Figure 2(b) in the process of first graying then binarizating.Here the maximum between-class variance algorithm (OTSU),proposed by Otsu (1979), is used for binarization. Finally, the sunspots are automatically identified with mathematical morphology and selected from Figure 2(c). In this way, the eccentricity,the connected domain area and duty cycle are used as filter conditions to set thresholds to determine whether it is a sunspot.Duty cycle is used to eliminate large boundary curves,and eccentricity eliminates straight lines or curves with large eccentricity, and the area of connected domains are used to process noise points. According to the position coordinates in turn, we take a partial picture in the form of the smallest inscribed rectangle. The penumbra and umbra area of a single sunspot are separated, and the result is shown in Figure 2(d).Source code for the algorithm is available at https://github.com/qqq280/Hand-Drawings.git.
The expression to calculate the area of a sunspot is:

Here, AMis sunspot area in millionths of the Sun’s visible hemisphere, Asis measured sunspot area (the area of the connected domain), R is the radius of solar drawing, Bpis heliographic latitude of sunspot,Lpis heliographic longitude of sunspot and, L0is heliographic longitude of the center of the disk.The formulas about those parameters are derived by Peng et al. (2020).
3. Results
To study the long-term variation of the ratio of the sunspot penumbra to umbra area, we select the sunspot hand-drawing records observed by YNAO during the period from 1957 January to 2021 May.
Based on the sunspot hand-drawing records, we identify a total of 16,400 sunspots from 50 to 1600 μhem. Then, we calculate the ratio of the sunspot penumbra to umbra area by the formula q=Ap/Au,where Apand Auare sunspot penumbra area and sunspot umbra area, respectively. In Figure 3, we divide the area of sunspots into bins of 20 μhem,and calculate the mean value of the umbra-penumbra ratio of all sunspots included in each bin. The ratio of the sunspot penumbra to umbra area is slightly higher than 6.8 when the total area of sunspots is about 100 μhem, which confirms the result found by Waldmeier (1939) when the sunspot area is around 100 μhem. However, when the sunspot area starts to increase from 80 to 800 μhem, the ratio of the sunspot penumbra to umbra area begins to decrease and slowly approaches the value of 6 proposed by Jha et al. (2018), then fluctuates around the value.
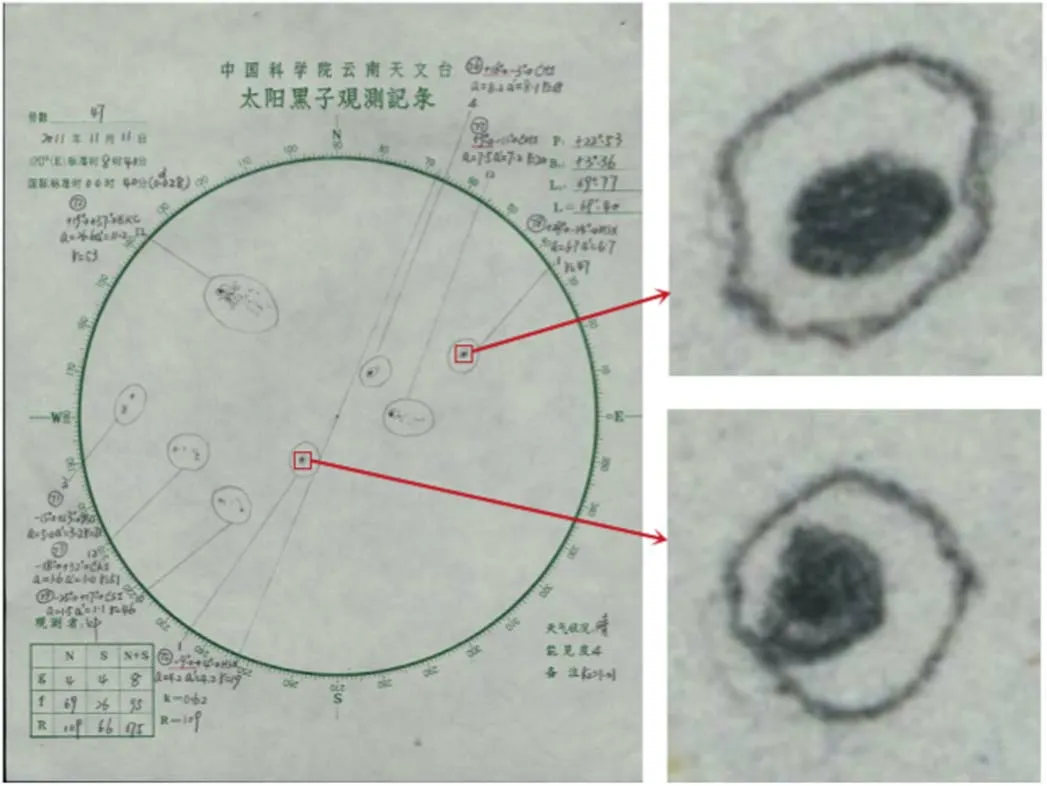
Figure 1. The left panel is a sample of sunspot drawing from YNAO, and the right panels include two partial single sunspot images.
Yearly averages of the ratio of the sunspot penumbra to umbra area as a function of time with areas are shown in Figure 4 with 3σ error bars. All values are distributed in the range of 5–7.5. As can be seen from Figure 4, the ratio varies around 7 for the period 1957–1998 and around 5.5 from 1999.
The ratio of the sunspot penumbra to umbra area is shown in Figure 5(a)using the form of a histogram,and the peak value is around 6,which is close to the expected ratio(see more details below). Solanki & Unruh (2004) performed a curve fitting on the area of sunspots,which shows a log-normal distribution.In this paper,the bar plots of the ratio of the sunspot penumbra to umbra area show a heavy tail on large scales, indicating a lognormal distribution. The equation is as follows:

where q is the ratio of the sunspot penumbra to umbra area, its value is a positive number, thus there is no range less than or equal to zero. The value of μ=1.839±0.003, and the value of σ=0.325±0.002. The expected value is 6.63±0.98. The exhaustive origin and properties of the log-normal distribution function are introduced by Limpert et al. (2001). The cumulative distribution function of the ratio of sunspot umbra to penumbra area is shown in Figure 5(b).When the ratio increases from 2 to 4,the probability starts to increase slowly because there are a small number of sunspots when the ratio is less than 4. It can be seen from the curve that the upward trend of the curve in the range of 4 to 9 is obvious, which indicates that a large number of sunspots are distributed among this stage.After 9,the upward trend of the curve begins to slow down,and becomes more and more parallel,indicating that the number of sunspots at this stage decreases as the ratio increases.
We divide all sunspots into four regions:0°–10°,10°–20°,20°–30°, and >30°according to the absolute value of their latitude,and study the sunspots in these four regions separately. In Figure 6(a),these curves in four latitude ranges are consistent with each other. We calculated the average value of the ratio of the sunspot penumbra to umbra area for each latitude range, and obtained the values of 6.65±0.98 (0°–10°), 6.56±0.96 (10°–20°), 6.61±0.99 (20°–30°), 6.62±0.97 (>30°), respectively.Such similar results show that the ratio does not depend on the latitude.
After that,as shown in Figure 6(b),the sunspots are divided into four phases:the minimum phase(the date of the minimum minus one year and that plus one year), the rising phase (the date between minimum phase to maximum phase), the maximum phase (the date of the maximum minus one year and that plus one year) and the declining phase (the date between maximum phase to minimum phase). The minimum and maximum times of cycles are provided by the sunspot Index and Long-term Solar Observations(SILSO).The average values of the ratio of the sunspot penumbra to umbra area are 6.54±0.91 for the minimum phase, 6.42±0.96 for the rising phase,6.64±0.99 for the the maximum phase,6.74±0.96 for the declining phase respectively. From our analysis, we can easily find that there is no change for a given spot range in different phases of cycles.
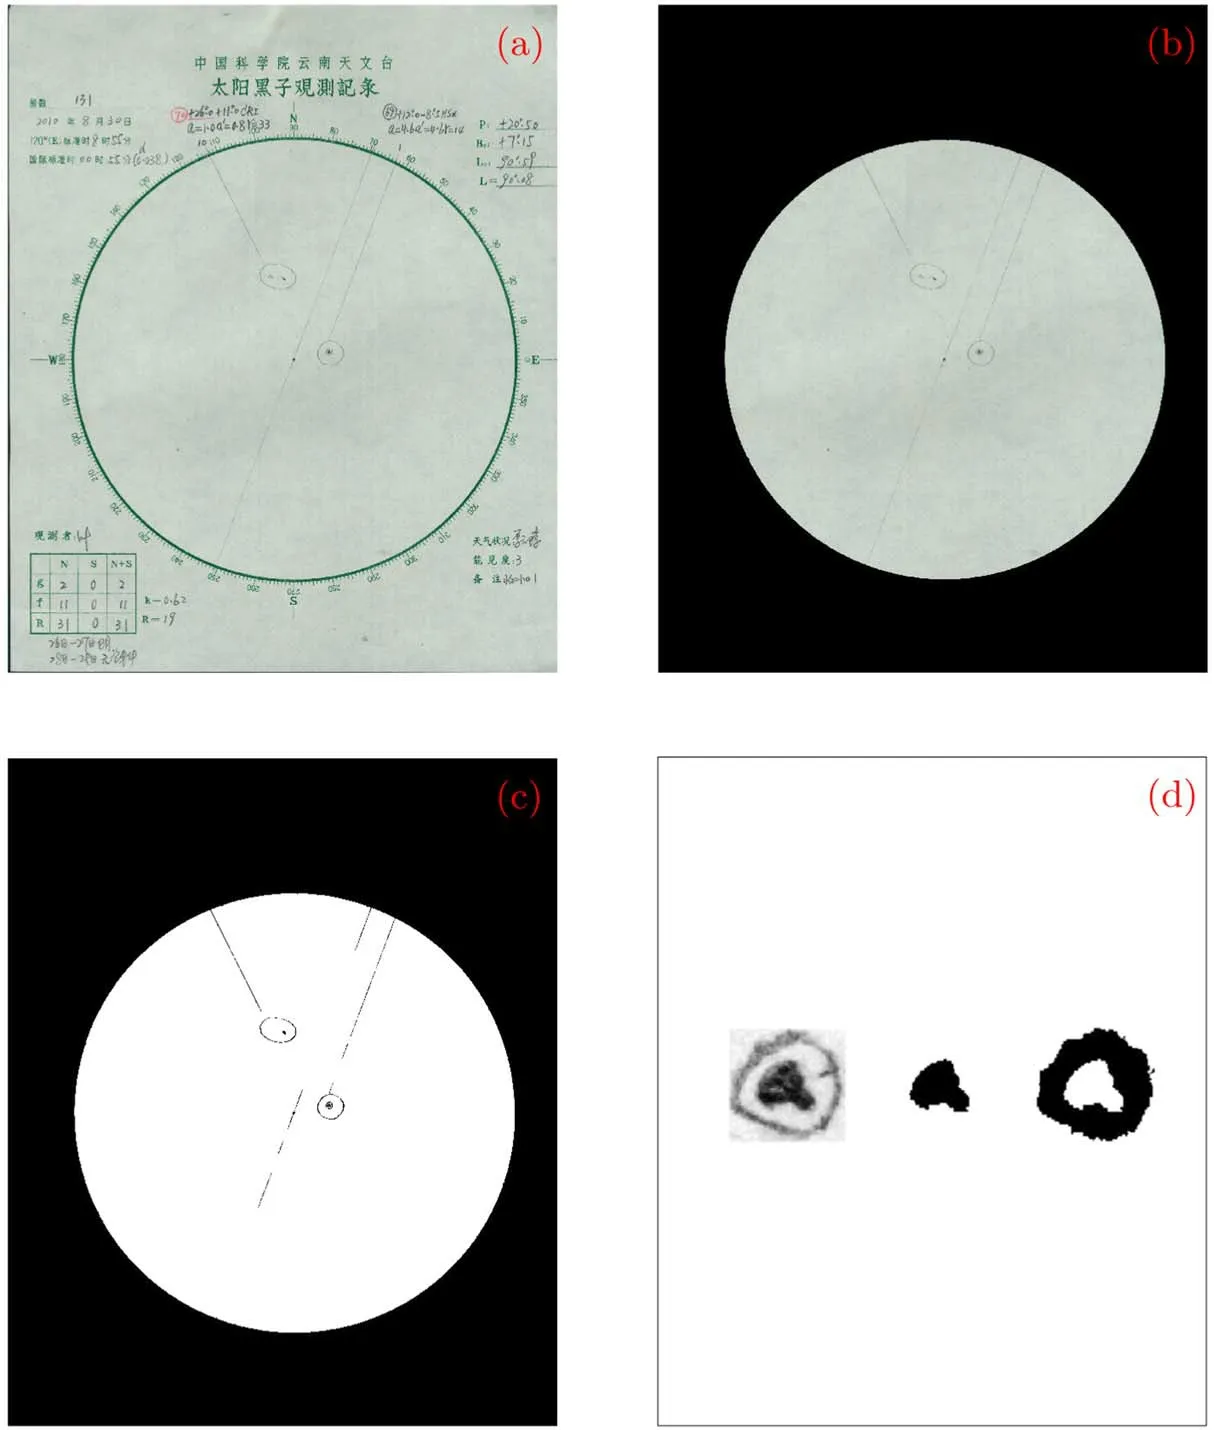
Figure 2.(a)The sunspot drawing observed by YNAO.(b)Take out the image of the whole-disk sunspot.(c)Binarize the image of the whole-disk sunspot.(d)From left to right are the single sunspot in (a), the umbra region of the sunspot, and the penumbra region of the sunspot, respectively.
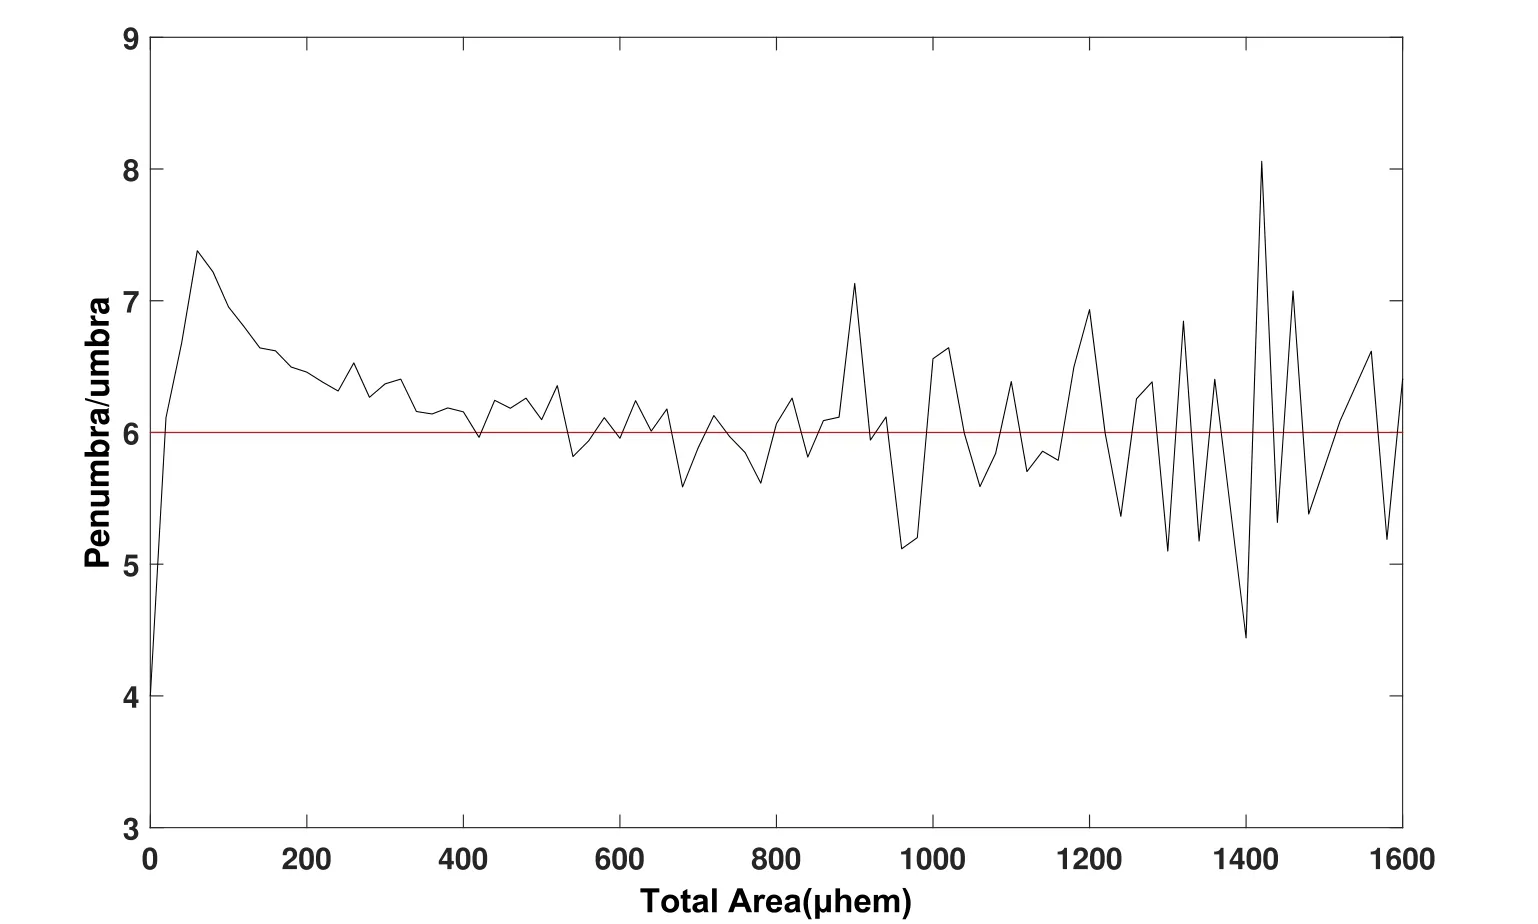
Figure 3. The ratio of the sunspot penumbra to umbra area as a function of sunspot area binned over 20 μhem. The red line plotted only for reference.
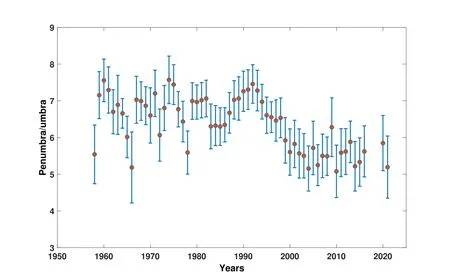
Figure 4. The ratio of the sunspot penumbra to umbra area temporal evolution of the annual with 3σ error bars.
Based on the smoothed sunspot number data of SILSO, we divide the sunspots into 19 to 24 solar cycles.Figure 7 shows the variation curves of the ratio of the sunspot penumbra to umbra with the area of sunspots in individual solar cycles from 19 to 24.The values of 6.54±1.15 (cycle 19), 6.87±1.02 (cycle 20),6.63±0.83(cycle 21),7.18±0.82(cycle 22),5.81±0.96(cycle 23), 5.80±0.83 (cycle 24) are calculated for each cycle.
4. Conclusions and Discussion
In this study, we use OTSU and mathematical morphology to automatically detect sunspots from the sunspot drawings during the period from 1957 January to 2021 May obtained by YNAO. After that, the sunspot penumbra and umbra were separated to study the long-term evolution of the area ratio of the sunspot penumbra and umbra.By analyzing the ratio of the sunspot penumbra to umbra area,the following conclusions are obtained:
(1).In this paper,a total of 16,400 sunspots are extracted by the automatic detection algorithm.This method can effectively extract sunspots with an obvious difference between umbra and penumbra.
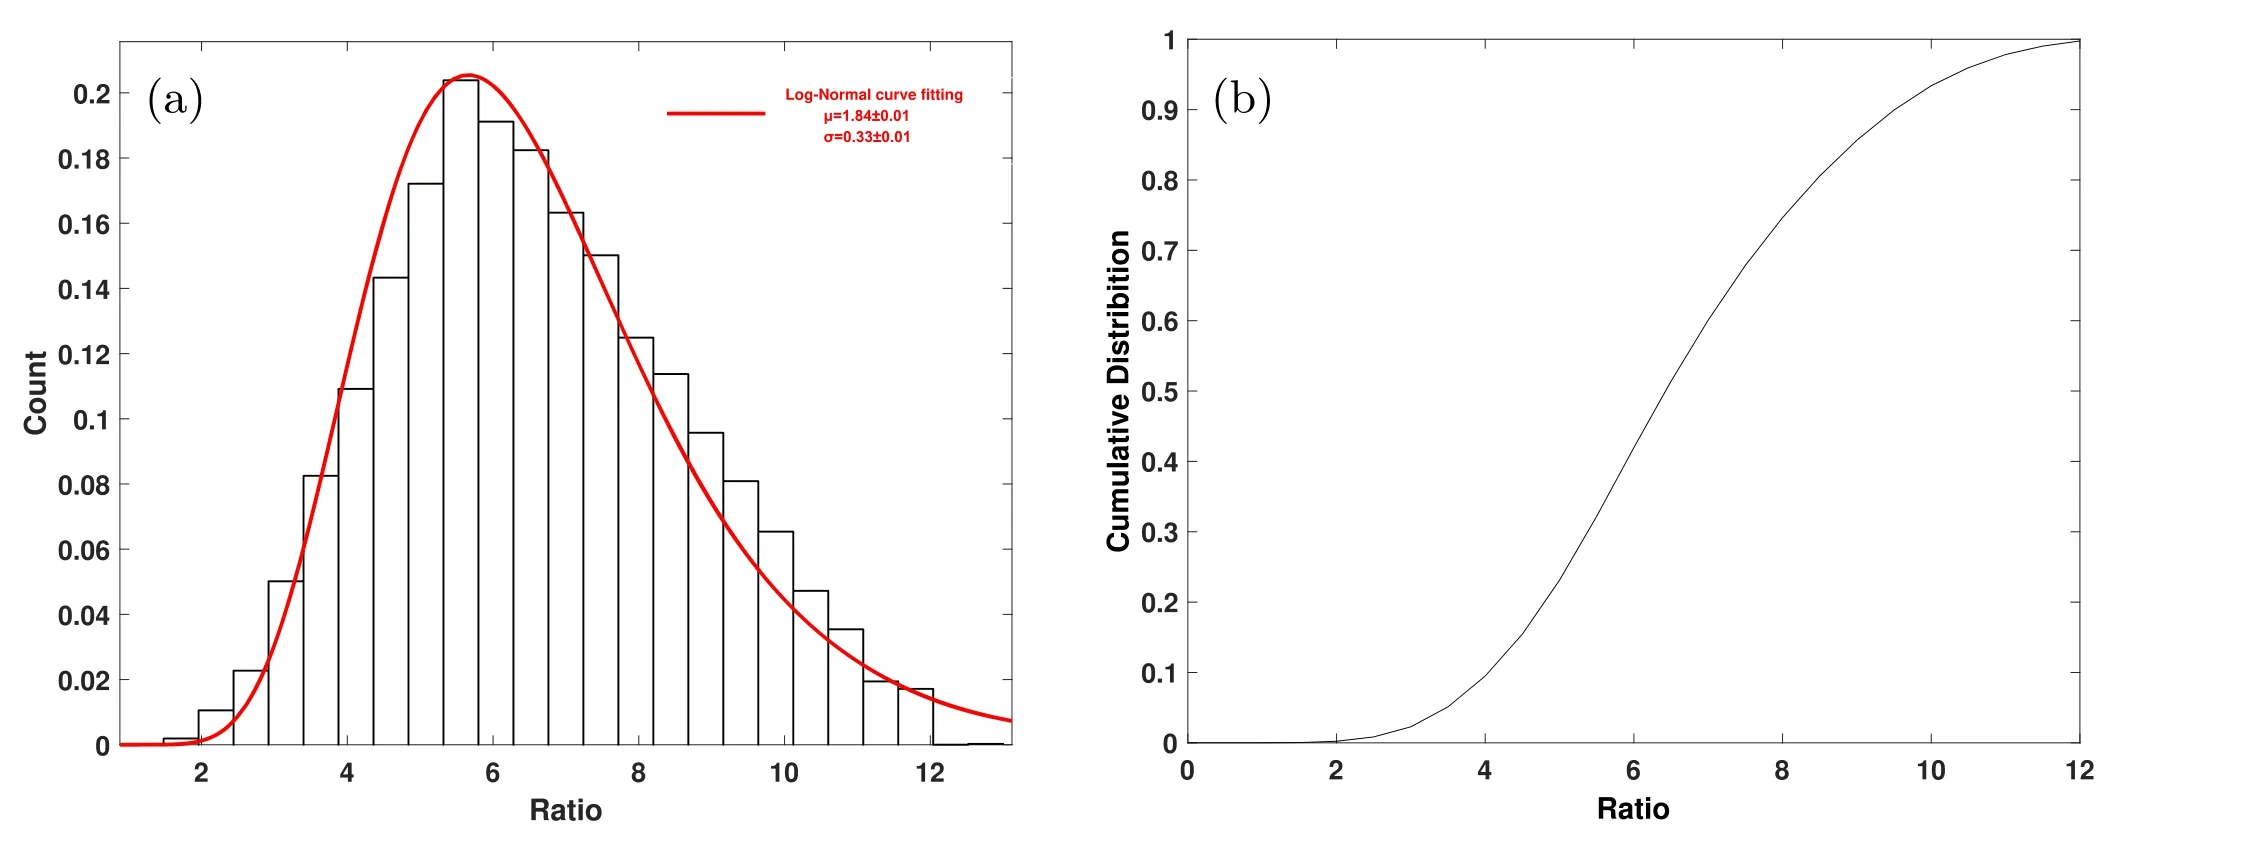
Figure 5. (a) A histogram showing the distribution of the ratio of the sunspot penumbra to umbra. (b) The cumulative probability distribution of the ratio of the sunspot penumbra to umbra.

Figure 6. (a) Variation of ratio of the sunspot penumbra to umbra area with total area in four different latitude bands. (b) Same as (a) but divided for four different activity phases of cycles.
(2). The expectation of ratio of the sunspot penumbra to umbra area is about 6.63±0.98,and its distribution probability curve conforms to the log-normal distribution.This means that most of the ratios are distributed around 6.
(3). The ratio of the sunspot penumbra to umbra area does not depend on the latitudes and phases of cycles. The ratio is distributed between 5 and 7.5 per year. Starting from 1999,there is a significant decrease behavior of the ratio compared to the previous one. Unfortunately, we do not find relevant information about changes in the methodology or instruments used in the observatory to observe sunspots to explain that change in the ratio from 1999.
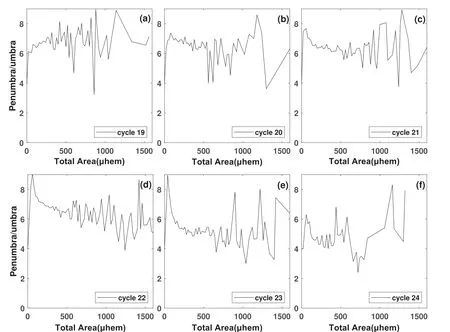
Figure 7. Variations in the ratio of the sunspot penumbra to umbra for each solar cycle (cycles 19–24).
The process of solar dynamo is reflected by the evolution of the long-period spatial distribution of sunspots. The expectation of ratio of the sunspot penumbra to umbra area is 6.63±0.98, which is comparatively consistent with the result by Jha et al. (2019). We find that the ratio of the sunspot penumbra to umbra area satisfies the log-normal distribution. In addition, Solanki & Unruh (2004) proposed that the sunspot area also conformed to the log-normal distribution, while magnetic bright points also conformed to the log-normal distribution Crockett et al.(2010).Therefore,we believe that most of the phenomena on the solar photosphere accord with the log-normal distribution, which is closely related to the evolution of the photosphere’s magnetic field. The annual average ratio was calculated to a range between 5 and 7.5, and this value is similar to the range obtained by Carrasco et al.(2018b)in the period of the Maunder Minimum. We consider that there is no certain correlation between the ratio and time because the ratio does not change significantly over time.We also find that the ratio of the sunspot penumbra to umbra area has no relationship with sunspot latitude, which is consistent with the conclusions put forward by Antalová(1971)and Hathaway(2013).In order to verify the conclusion that the ratio of the sunspot penumbra to umbra area has no variation in the phase of the cycle, the ratio is classified according to the four phases of solar activity. We prove the conclusion proposed by Hathaway (2013) once again.
The history of sunspot hand-drawing records is much longer than that of satellite data. The method of studying the ratio of the sunspot penumbra to umbra area based on sunspot drawings proposed in this paper can be extended to the sunspot drawings data from other stations. Therefore, it is possible to study the ratio of the sunspot penumbra to umbra area in a longer time range,which is more beneficial to understand the mechanism of solar dynamo.
Acknowledgments
The authors thank the staff of the Yunnan Observatories,Chinese Academy of Sciences that provided the sunspot drawings. This work is supported by the National Natural Science Foundation of China (Grant Nos. U2031202 and U1731124), the special foundation work of the Ministry of Science and Technology of China(Grant No.2014FY120300),the 13th Five-year Informatization Plan of Chinese Academy of Sciences (Grant No. XXH13505-04).
 Research in Astronomy and Astrophysics2022年9期
- Research in Astronomy and Astrophysics的其它文章
- A Wideband Microwave Holography Methodology for Reflector Surface Measurement of Large Radio Telescopes
- YFPOL: A Linear Polarimeter of Lijiang 2.4m Telescope
- Pre-explosion Helium Shell Flash in Type Ia Supernovae
- A Region Selection Method for Real-time Local Correlation Tracking of Solar Full-disk Magnetographs
- Research on the On-orbit Background of the Hard X-Ray Imager Onboard ASO-S
- Supergranular Fractal Dimension and Solar Rotation
