A Region Selection Method for Real-time Local Correlation Tracking of Solar Full-disk Magnetographs
Yang Bai , Jia-Ben Lin, Xian-Yong Bai, Xiao Yang, Dong-Guang Wang, Yuan-Yong Deng, Xiao-Ming Zhu,Xing Hu, Wei Huang, and Li-Yue Tong
1 Key Laboratory of Solar Activity, National Astronomical Observatories, Chinese Academy of Sciences, Beijing 100101, China; jiabenlin@bao.ac.cn
2 University of Chinese Academy of Sciences, Beijing 100049, China
Abstract Hundreds of images with the same polarization state are first registered to compensate for the jitters during an observation and then integrated to realize the needed spatial resolution and sensitivity for solar magnetic field measurement. Due to the feature dependent properties of the correlation tracker technique,an effective method to select the feature region is critical for low-resolution full-disk solar filtergrams, especially those with less significant features when the Sun is quiet.In this paper,we propose a region extraction method based on a Hessian matrix and information entropy constraints for local correlation tracking (CT) to get linear displacement between different images. The method is composed of three steps: (1) extract feature points with the Hessian matrix, (2)select good feature points with scale spaces and thresholds, and (3) locate the feature region with the twodimensional information entropy constraints.Both the simulated and observational experiments demonstrated that our region selection method can efficiently detect the linear displacement and improve the quality of a groundbased full-disk solar magnetogram. The local CT with the selected regions can obtain displacement detection results as good as the global CT and at the same time significantly reduce the average calculation time.
Key words: Sun: photosphere – Sun: magnetic fields – techniques: image processing
1. Introduction
High resolution (spatial and temporal) and sensitivity are eternal goals in astronomical observations(Lin et al.2006b).In order to obtain high-quality solar magnetic fields, hundreds of image frames should be integrated in one measurement to increase the signal-to-noise ratio. However, due to the atmospheric turbulence and the accuracy of a telescope’s tracking system, each image frame may have a linear displacement,which leads to a loss of spatial resolution in the final multiframe integration results. Therefore, correcting the image displacement before deep-integration will contribute a lot to the data quality in routine magnetic field observations.
In recent decades,the limb sensor(Emilio et al.2010;Schou et al.2012;Zheng et al.2020)and correlation tracker(Edwards et al. 1987; von der Luehe et al. 1989; Ballesteros et al. 1996;Shand & Scharmer 1998; Deng & Zhang 1999; Shand et al.1999; Didkovsky et al. 2003; Li & Jin 2006; Lin et al. 2006a;Shimizu et al. 2008; Shen et al. 2013) have been generally employed to detect the jitters between different frames and then a tip-tilt mirror is adopted to correct them. The correlation tracker has been studied for many years and been applied in many solar telescopes. The first system successfully implementing a correlation tracker was the ground-based solar telescope developed at the Palo Alto Research Laboratory managed by Lockheed (Edwards et al. 1987). Until now, the correlation tracker has been integrated into ground-based solar telescopes such as the Vacuum Tower Solar Telescope of the National Solar Observatory at Sacramento Peak (NSO/KIS)(von der Luehe et al. 1989), the Solar Correlation Tracker prototype built by the Instituto de Astrofisica de Canarias(IAC)(Ballesteros et al.1996),the 65 cm vacuum telescope of the Big Bear Solar Observatory (BBSO) (Didkovsky et al. 2003) and the Swedish Vacuum Solar Telescope (SVST) (Shand &Scharmer 1998; Shand et al. 1999). The correlation tracker is also used in space-based solar missions, e.g., the Solar Optical Telescope (SOT) onboard Hinode (Shimizu et al. 2008), the prototype of the Space Solar Telescope (SST) (Li & Jin 2006)and the Balloon-Borne Solar Telescope-Sunrise (Barthol et al.2011). To reduce the calculation time, the systems based on correlation tracking (CT) generally choose a limited local region in the correlation calculation,and successive frames are compared with a previous reference image frame through the correlation of the chosen region to determine their relative displacements in real time. For solar magnetic field measurement with an image stabilization system consisting of a correlation tracker (or limb sensor) and tip-tilt mirror, the polarized images taken with the detector are integrated directly.For the telescopes not equipped with the hardware of a tiltingmirror in the original design, such as the Solar Magnetic Field Telescope (SMFT) of the Huairou Solar Observing Station(HSOS),an alternative way is to employ a CT algorithm during the image acquisition before writing to a data file. Once the image shifts are obtained, a series of images is first registered and then integrated.In routine observations by SMFT,a region of 800×800 pixels is selected manually for the operation of local CT(Shen et al.2013),thus the effectivity of displacement detection results is quite arbitrary.
The accuracy of local CT is feature dependent.The sunspots in the target region can be used to effectively detect image jitters.But for the quiet Sun regions,it is very difficult to detect the correct values due to the lack of significant features,especially for ground-based full disk solar images having poor spatial resolution and those that are severally affected by atmospheric turbulence. For example, for the data obtained by the full-disk video vector magnetograph of the Solar Magnetism and Activity Telescope (SMAT) (Zhang et al. 2007) at HSOS, different displacement results are obtained from calculating local CT for different regions. Some regions can assist local CT to mostly identify displacement, some regions can only identify partial displacement and some regions can hardly identify displacement. In this case, an effective method of region selection for the following local CT calculation can help to increase the accuracy of image registration.
In general, the image feature extraction methods are based on points or lines in the image,including a point feature-based processing method such as Harris (Papageorgiou & Poggio 2000; Viola et al. 2005) and edge feature-based processing method such as the Laplacian of a Gaussian operator, Robert operator, Sobel operator (Ziou & Tabbone 1998), etc. At present, the most utilized image feature extraction algorithms are Scale-Invariant Feature Transform (SIFT) (Lowe 2004),Speeded Up Robust Features (SURF) (Bay et al. 2008),Oriented fast and Rotated Brief (ORB) (Rublee et al. 2011),etc. SIFT and SURF are based on gray gradient, and ORB is based on gray values. Compared with SIFT, SURF is more helpful in dealing with those image features with smooth edges.In recent years,some studies have introduced SIFT into feature extraction and registration of solar images.The studies in Yang et al. (2018) indicated that the SIFT algorithm can locate and match features in solar magnetograms automatically and accurately. In addition, the application of SIFT in Yue et al.(2015) and Ji et al. (2019) also showed good results in the scenario of high resolution solar images. However, when we use SIFT in filtergrams from ground-based full disk solar images having poor spatial resolution, such as SMAT, quite limited feature points are obtained, especially in solar quiet regions.
In this paper, we propose a region extraction method based on the Hessian matrix and information entropy constraints for the local CT to get an accurate linear displacement detection.The contents of this paper are listed below. Section 2 gives an overview of the region selection method based on the Hessian matrix and information entropy. The experiments are introduced in Section 3, including the feature point extraction and linear displacement detection. Section 4 provides conclusions and discussions of the experiments.

Figure 1. Flow chart of the region selection method.
2. Methods
Figure 1 illustrates a flow chart of our method. At first,feature points are extracted from a reference solar full-disk image with the Hessian matrix, which is the key algorithm of SURF. Then, we screen the feature points based on scale spaces and a threshold.At last,we obtain the feature region by calculating the two-dimensional (2D) information entropy of the feature points.
2.1. Feature Points Selection
SURF is a fast and performance scale and rotation invariant interest point detector and descriptor, which is described by Bay et al. (2008). The advantage of this method is the use of integral images, the high repeatability and the speed of the detector. In this way, features can be detected faster and more accurately. Based on SURF, we propose a method named SURF-2E,depending on the Hessian-matrix approximation and non-maximum suppression to obtain the feature points from the full-disk solar photospheric filtergrams.
2.1.1. Hessian Matrix
At first, a box filter is applied to the image for each pixel to obtain the Hessian matrix. We rely on the determinant of the Hessian for scale selection, as done by Bay et al. (2008). The detector on the Hessian matrix has good performance in accuracy to detect blob-like structures. Given a point X in an image I with the coordinate of (x, y), the Hessian matrix H(X,σ) in X at scale σ is defined as
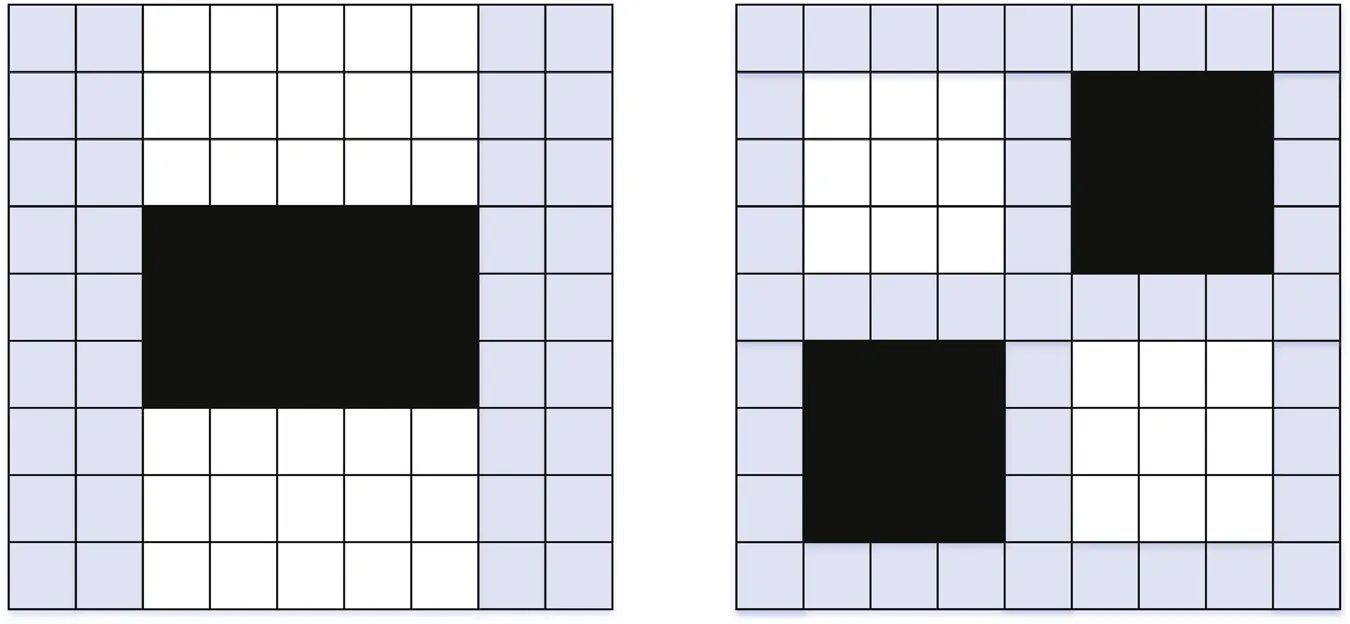
Figure 2.The second order Gaussian partial derivative used by SURF in different directions.The gray regions are equal to zero.The left and right columns show the y-direction and the xy-direction respectively. (Replotted from the right part of Figure 2 in Bay et al. 2008.)

where Dxx(X, σ) is the convolution of the Gaussian second order derivative in the x direction with the image at point X,and similarly for Dxy(X, σ) and Dyy(X, σ) (Bay et al. 2008).
As reported in Bay et al. (2008), Gaussians are optimal for scale-space analysis but need to be discretized and cropped.They implement the approximation for a Hessian matrix with box filters as depicted in Figure 2,which are approximations of a Gaussian with σ=1.2 and are the lowest scale to obtain the blob response maps.The weight w is introduced to balance the expression for the Hessian’s determinant and the discriminant is shown as

2.1.2. Interest Point Localization
In order to localize the feature points in the solar photospheric filtergrams, a non-maximum suppression is applied. We use the fast variant introduced by Neubeck &Gool (2006) and the method proposed by Brown & Lowe(2002) to interpolate the maxima of the determinant of the Hessian matrix in scale and image spaces. In addition, due to the noise in the edge area of the polarization image,we discard the computed feature points near the solar limb for their poor ability in doing local CT, and introduce a threshold to further select the feature points. In this way, we can filter out some weaker points which can only identify partial or even hardly identify displacement,and speed up the selection of the feature region.
2.2. Feature Region Selection
Image information entropy is a statistical form of image features,which reflects the average amount of information and the complexity of pixel distribution in the image. We calculate the 2D information entropy in the neighborhood of the feature points and select the one with the maximum information entropy as the feature region. For a 2D image, the calculation for information entropy is shown as

where ekstands for the 2D information entropy of region k, L corresponds to the image gray level, Mkand Nksignify the region sizes,i represents the gray value of the pixel, j signifies the average gray value of the field, (i, j) stands for a feature two-tuple composed of pixel grayscale and neighborhood grayscale average, and fk(i, j) corresponds to the occurrence frequency of (i, j).
In the experiment, the average calculation time for the 2D information entropy of 256×256 pixel is 2.1458 s. In the process of feature region extraction, the feature region is defined according to the extracted feature points. The first 50 feature points are selected from the whole image according to the threshold when the number of integral points is more than 50. Therefore, in our experiment, the average time consumption of the feature region extraction is 107.5 s.
3. Experiments and Results
The experimental data were obtained by the full-disk video vector magnetograph of the SMAT on 2021 March 20.The full disk video vector magnetograph was made by a telescope with a telecentric optical system of 10 cm aperture and 77.086 cm effective focal length. The birefringent filter for the measurement of vector magnetic field was centered at 5324.19 Å and its bandpass was 0.1 Å. The CCD camera used in this magnetograph was IMPERX 1M48, with a size of 1000×1000 pixels and a bit depth of 12 bits. The maximum frame rate of SMAT is 48 fps for 1000×1000 images.The practical frame rate depends on the exposure time of the camera; it is about 30 fps when the exposure time is set to 10 ms,taking into account some other time consumption of the hardware such as signal communications. The frame number for the integration is set to 256 in routine observations,so a complete observation for all three Stokes components takes less than 1 minute. In general, the observation interval is about 15 minutes,since some preparations,post-processing and check lists will be completed during the observation intervals.The image scale is about 2″×2″.Each data file contains two images with different polarization states, which are further calibrated to the magnetic field according to the polarized radiative transfer theory in the solar atmosphere.
The CPU of the experiment platform is an Intel(R) Core(TM) I7-7700 CPU @ 3.60 GHz; the experiment is completed under the Windows operating system and the software platform is Python 3.6.
3.1. Feature Point Extraction
In this section, we compare the feature point extraction ability of the algorithm adopted in this paper with the SIFT and ORB algorithms on the solar photospheric filtergrams. We collected 20 solar photospheric filtergrams obtained by SMAT at different time periods to carry out the experiment. As an experiment, we preprocessed the solar disk image, removing some of its low-frequency components through a 75×75 filter so that the high-frequency components are highlighted. After this kind of preprocessing, all the three algorithms can extract enough and even plenty of feature points to do the subsequent tasks.But,the time consumption of the above preprocessing for a 256×256 image is about 1 s.It is worth noting that once we perform the preprocessing on the reference frame, every frame during a complete observation must undergo the same preprocessing to obtain a perfect CT result; 256 frames will take an additional processing time of about 250 s, which is unacceptable for routine observations. Therefore, in practical implementations, we follow a principle of using original raw data without any preprocessing,and the following experiments are based on algorithmic comparison; the feature point recognition results of different methods are shown in Table 1. Compared with the ORB and SIFT algorithms, our method can extract richer feature points, which are more conducive to the selection of feature regions from the extracted feature points. In addition, the distribution of feature points is depicted in Figure 3, and our method based on the Hessian Matrix can extract many more feature points compared to SIFT and ORB. This is because the feature extraction of SIFT andORB is sometimes useless for image features with smooth edges, especially for ground-based full disk solar images having poor spatial resolution.Benefitting from the rich feature points extracted, we can deal well with those images with indistinctive features of low signal-to-noise ratio,such as quiet regions with no sunspots. Although a preprocessed image can get more feature points by SIFT, it will increase the computational burden of the system. In this paper, in order to realize real-time image stabilization observation, we directly process the original image without preprocessing.

Table 1 The Number of Characteristic Points Recognized from the Solar Photospheric Filtergram
3.2. Local Correlation Tracking
We conducted both simulated and observational experiments to compare the ability of CT results from different regions.The data used in the experiments are observed on the SMAT,whose solar features would not evolve much during each data integration, containing left circular polarized images and right circular polarized images.Magnetograms can be obtained from the pairs of images with two different polarization states, and the accuracy of the image stabilization algorithm can be evaluated through these magnetograms.
3.2.1. Simulated Experiment
In the simulated experiment, 100 solar photospheric filtergrams obtained by the SMAT were all moved with 0.1 pixels steps within±3 pixels in both vertical and horizontal directions. In this way, we obtained 3721 shifted images from each data frame, and 372,100 images in total.
We set the target region to a 256×256 pixel square for the comparison. Figure 4 shows three typical selected regions:region (a) covers some of the solar limb; (b) is a randomly selected region with an intermediate 2D information entropy(the entropy value in this example is 17.80); and (c) is the region with the highest 2D information entropy of 21.15.Each of the 100 observational images before being shifted was regarded as the reference image, and the displacements between its shifted images and the reference image were calculated by the local CT algorithm and compared with the ground truths. Table 2 shows the mean displacement errors in both x and y directions for different selected regions and the time consumption as well, and Table 3 displays the displacement calculation errors in x and y directions with the non-integer displacement.

Figure 3. The feature point distribution in the solar full-disk photospheric filtergram calculated by different methods. The left column displays the result of our method, the middle column shows the result of ORB and the right column features the result of SIFT.
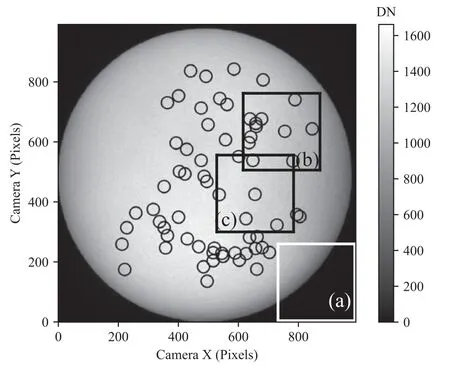
Figure 4. The regions selected for local CT. We select three regions for local CT: (a) edge region; (b) region with low 2D information entropy; (c) region with highest 2D information entropy.
In the experiment, if the displacement is not detected, the detection value is 0 and the error is the maximum error.In this way, the errors for the region (a) x-direction, y-direction, and region (b) y-direction are all very high. Region (c) performs better than regions (a) and (b) in local CT calculations. The relatively larger errors of region (a) may be due to its lack of feature points. Region (c), which is almost without errors, has the highest 2D information entropy and the most feature points.In addition, the correction results through region (c) are the same with those by the global image but the average calculation time is saved by about 96.23%. On the other hand,the accuracy of the algorithm with sub-pixel detection is better,but the time consumption is longer. The result shows that the time consumption of pixel and sub-pixel detection of local CT is 8 ms and 8.25 ms respectively,and the time consumption of integer shift and sub-pixel frequency shift is 1.6 ms and 125.4 ms respectively. The time consumption of the sub-pixel frequency shift is too long, which affects the frame rate of the observation. At present, the pixel detection and correction are still used for real-time processing of actual observation data.
3.2.2. Observational Experiment
In the observational experiment, we acquired 20 groups of observations, each of which contains 128 left and 128 right circular polarized images. During the observations, the exposure time of the camera was 10 ms and the frame rate was about 30 fps. We collected the data in three time periods,10 groups in the morning,5 groups at noon and 5 groups in the afternoon, and in each period, the acquisition intervals are less than 3 minutes. The magnetic flux density for line-of-sight magnetic field can be roughly calculated by
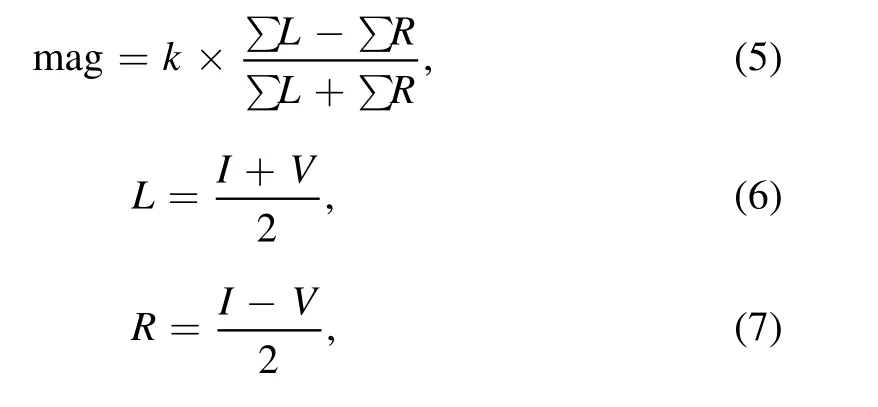
where ∑L stands for the accumulation of left circular polarized images, ∑R for the right circular polarized images, k corresponds to the calibration coefficient of line-of-sight magnetic fields, I signifies the intensity and V stands for the circular polarization.
Figure 5 shows the left circular polarized image with 128 deep-integrations, the right circular polarized image with 128 deep-integrations and the corresponding magnetogram. Moreover, Figure 6 gives the shifts (in units of pixel) in X and Ydirections, calculated by our method for each frame relative to the two beginning reference frames.

Table 2 The Mean Detected Subpixel Displacement Error in x and y Directions

Table 3 The Detected Subpixel Displacement Error in x and y Directions of Some Typical Points

Figure 5.The magnetic field image calculated by local CT based on the feature region.The left column shows the left circular polarization,the middle column features the right circular polarization and the right column displays the magnetic field image.
To evaluate the results of the alignment, image energy,equivalent width and gray level profiles are used in the sunspot region of the magnetogram,as depicted in Figure 7.The gray level profiles of the lines in Figure 7 are shown in Figure 8. We have selected a feature point in each magnetogram,and the width of the feature point approximately indicates the spatial resolution of the magnetogram. We compare the equivalent width at the same magnetic field characteristic region in the right three panels of Figure 7, marked with three small white boxes. Here, the equivalent width, EW, of the characteristic region is defined as where pi(m,n)stands for the magnetic field energy normalized to 1,and M and N signify the image sizes.We calculate the EW of the direct deep-integration(EWD),the EW of the global CT(EWCT) and the EW of the local CT (EWLCT). Then we calculate the ratio of the equivalent width of global CT and local CT relative to the direct accumulations, EWCT/EWDand EWLCT/EWD, and the result is plotted in Figure 9.

The image energy is defined as the mean square of all the pixel signals in the image, which is applied to describe the changes of image texture details

where ∑L2stands for the squared value of the image I, and M and N correspond to the image sizes. Greater energy means more details in the image (Zheng et al. 2020).

Figure 6. The linear displacement calculated by local CT based on the feature region. The left and right panels display the linear displacement of X and the linear displacement of Y respectively.

Figure 7. An example of line-of-sight magnetograms before and after frame alignment. The first one is the full-disk image calculated by local CT based on feature region; the second one is a directly accumulated image; the third one is the feature local CT; the fourth one is the global CT.
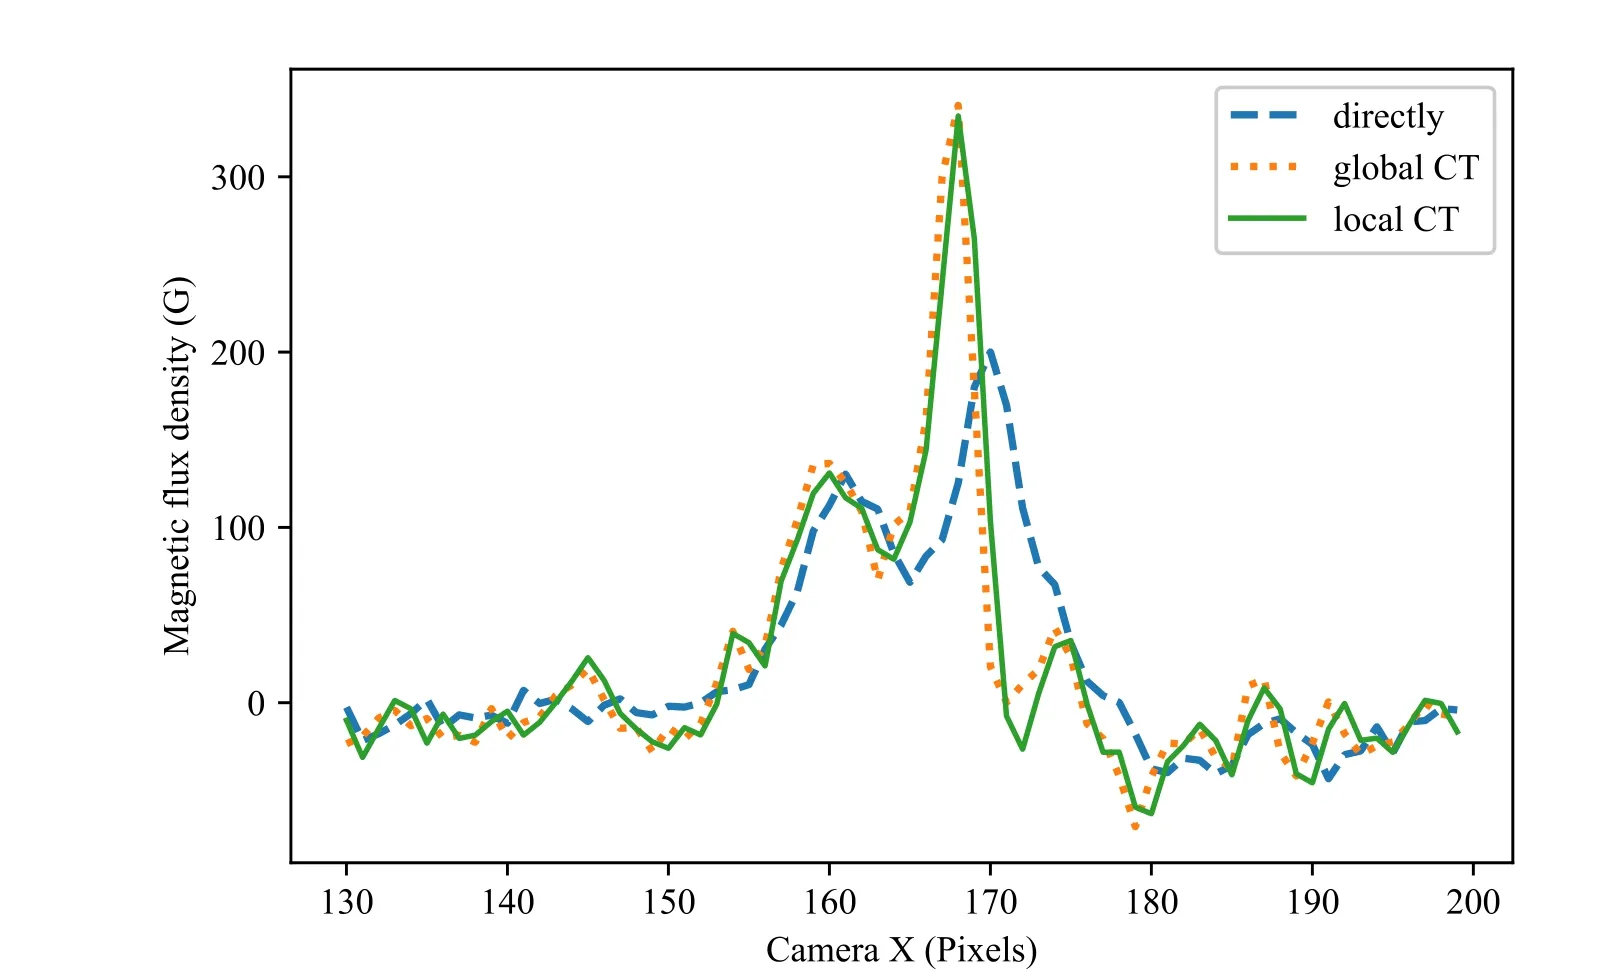
Figure 8. The gray level profiles of a directly accumulated image, the global CT and the feature local CT.
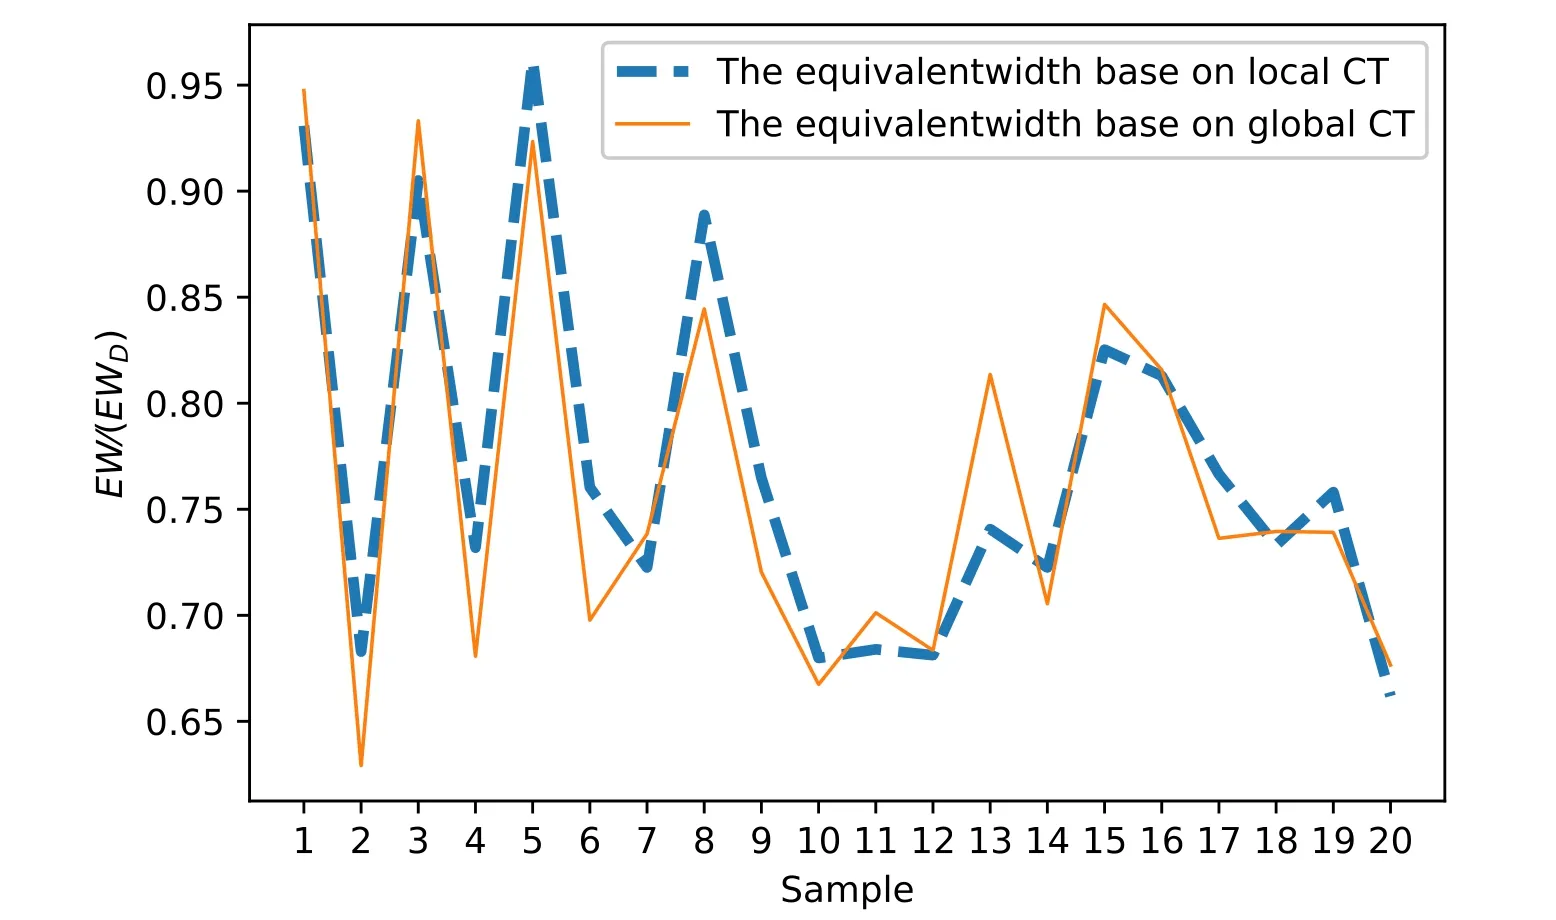
Figure 9. The ratio of the equivalent width of global CT and local CT relative to the direct accumulations.
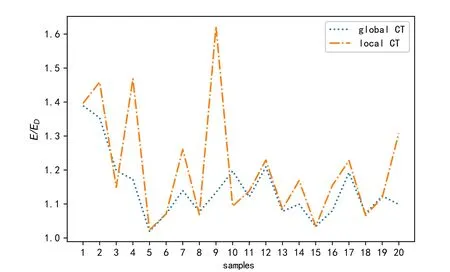
Figure 10. The increase of image energy values for global CT and local CT relative to the direct accumulations.
We compare the image energy values of different methods,such as the direct deep-integration (ED), the global CT (ECT)and the local CT (ELCT). We also calculate the image energy values of global CT and local CT relative to the direct accumulation, ECT/EDand ELCT/EDrespectively, and the results are displayed in Figure 10.
It can be seen from Figures 7 and 8 that after alignment processing with the offsets from either global image or feature region, the features look sharper than the one without any treatment.In Figure 9,with the comparison of the feature areas’scale, the local CT through feature region obtains similar results as the global CT, and the two methods can both obtain an effective linear displacement detection. In Figure 10, with the comparison of the image energy values increased relative to the direct accumulation,the local CT processed images seem to have more details than those processed by global CT.
In summary, our method can effectively extract a feature region for local CT to get the linear displacement in real-time solar magnetic field observations.First,our method can extract much more feature points compared with other feature extraction algorithms. The time consumption of the feature point extraction algorithm is about 0.05 s, and the average calculation time for the 2D information entropy of every point is 2.1458 s.We will extract the first 50 points when the number of points is more than 50 to save calculation time.In this way,the total time consumption of SURF-2E is less than 107.5 s.Second, the feature region with the highest 2D information entropy has a promising effect in the local CT calculation to get the displacement between frames, in terms of both time spent and accuracy.The local CT with the selected regions can obtain displacement detection results as good as the global CT in 8 ms, while the average time consumption of the global CT is 212.5 ms.
4. Conclusions and Discussions
We proposed a feature region extraction method named SURF-2E which can detect a better feature region for the following local CT and image registration in the low resolution solar full-disk quiet Sun images with less significant features.The feature point selection method is based on SURF,containing the Hessian matrix and information entropy constraints. Several experiments are carried out to verify the performance of the method in full-disk solar magnetic field observation.Both the simulated and observational experiments show that our method can effectively extract rich enough feature points to do subsequent operations than some of the general feature extraction algorithms,i.e.,SIFT and ORB.With the rich feature points extracted, we can deal well with those images with indistinctive features of low signal-to-noise ratio,such as quiet regions with no sunspots.In addition,the feature region obtained by our method has a better effect including both time spent and accuracy in detecting the linear displacement through local CT.
During each time interval, the solar features would not evolve much during each data integration period,so the current strategy is to do the feature region extraction every certain time,and the selected region can be used to complete the local CT operation well. Therefore, we extract the feature points from the whole image and select the feature region for local CT before observing; the total time consumption of the SURF-2E is less than 107.5 s. In the observing period, we realized the image stabilized observation of the solar magnetic field,and the time consumption of the local CT by feature area is 8 ms. In routine operations of SMAT, observations are taken every 15 minutes. Adding our local CT into the observation process,it will only take about 10 more seconds so that the frame rate will be about 25 fps.Also,taking into account the feature area extraction of our SURF-2E,the total time consumption will be around 3 minutes, which is acceptable for the observation requirement and suitable to the observation interval. In the simulated experiment, the CT with global image and feature region selected by our method obtains better results, the error of manual displacement can be basically corrected and the image stabilization error can be realized within 0.1 pixels. In addition, the average calculation time by local CT is saved by about 96.23% compared with the global CT. In the observational experiment, the local CT through feature region obtains a similar effective linear displacement detection as the global CT with the comparison of the feature areas’ scale; the local CT processed images have more details than those processed by global CT with the comparison of the image energy values increased relative to the direct accumulation. In conclusion, our feature region selection method can help to realize a real-time local CT for solar full-disk magnetographs to get the linear displacement, to improve the quality of a ground-based fulldisk solar magnetogram.
The feature region selecting method introduced in this paper has the capability of partially compensating the hardware design in some telescopes, and is well aligned with the requirement of deep-integration or multi-frame superposition observations. However, because of the bottleneck of the timeconsuming feature region extraction (in our experiments the maximum time consumption is 107.5 s), the current strategy is to do the feature region extraction every certain time. During each time interval, the feature regions on the solar surface are regarded as stable or fixed enough, so the selected region can be used to complete the local CT operation well. In order to better adapt to the real-time changes on the solar surface, we need to optimize the system by some methods to further reduce the selection time, such as using more effective algorithms to acquire and delete the feature points and the feature region, so that the selection can be completed before each observation.
Acknowledgments
We are very grateful to the referee for suggestions that greatly improved the manuscript. We are also grateful for the HSOS’s teachers and students for their help during the data acquisition and algorithm testing. This work is supported by the National Natural Science Foundation of China (NSFC, Grant Nos. 11427901, 11873062, 12003051, 11973056, 12073040 and 12173049), the National Key R&D Program of China(2021YFA1600500) and the Strategic Priority Research Program of the Chinese Academy of Sciences (Grant Nos.XDA15320102 and XDA15320302).
ORCIDiDs
Yang Bai https://orcid.org/0000-0003-4830-6415
 Research in Astronomy and Astrophysics2022年9期
- Research in Astronomy and Astrophysics的其它文章
- The Quasar Candidate Catalogs of DESI Legacy Imaging Survey Data Release 9
- A Photometric Study of Two Contact Binaries:CRTS J025408.1+265957 and CRTS J012111.1+272933
- Investigating the UV-excess in Star Clusters with N-body Simulations:Predictions for Future CSST Observations*
- A Catalog of Molecular Clumps and Cores with Infall Signatures
- Detection of 16 Small Glitches in Nine Pulsars
- Investigations of Thermal Deformation Based on the Monitoring System of Tianma 13.2m VGOS Telescope
