Searching for Multiple Populations in Star Clusters Using the China Space Station Telescope
Chengyuan Li (李程远), Zhenya Zheng (郑振亚), Xiaodong Li (李霄栋), Xiaoying Pang (庞晓莹), Baitian Tang(汤柏添), Antonino P. Milone, Yue Wang (王悦), Haifeng Wang (王海峰), and Dengkai Jiang (姜登凯)
1 School of Physics and Astronomy, Sun Yat-sen University, Daxue Road, Zhuhai, Guangdong 519082, China; lichengy5@mail.sysu.edu.cn
2 CSST Science Center for the Guangdong-Hong Kong-Macau Greater Bay Area, Zhuhai 519082, China
3 CAS Key Laboratory for Research in Galaxies and Cosmology, Shanghai Astronomical Observatory, Shanghai 200030, China
4 Division of Optical Astronomical Technologies, Shanghai Astronomical Observatory, Shanghai 200030, China
5 Department of Physics, Xi’an Jiaotong-Liverpool University, Suzhou 215123, China
6 Shanghai Key Laboratory for Astrophysics, Shanghai Normal University, 100 Guilin Road, Shanghai 200234, China
7 Dipartimento di Fisica e Astronomia “Galileo Galilei”, Università di Padova, Vicolo dell’Osservatorio 3, I-35122, Padua, Italy
8 Istituto Nazionale di Astrofisica—Osservatorio Astronomico di Padova, Vicolo dell’Osservatorio 5, IT-35122, Padua, Italy
9 Key Laboratory of Optical Astronomy, National Astronomical Observatories, Chinese Academy of Sciences, Beijing 100101, China
10 GEPI, Observatoire de Paris, Université PSL, CNRS, Place Jules Janssen F-92195, Meudon, France
11 Yunnan Observatories, Chinese Academy of Sciences, 396 Yangfangwang, Guandu District, Kunming 650216, China
12 Key Laboratory for the Structure and Evolution of Celestial Objects, Chinese Academy of Sciences, Kunming 650216, China
13 Center for Astronomical Mega-Science, Chinese Academy of Sciences, Beijing 100101, China
Abstract Multiple stellar populations (MPs) in most star clusters older than 2 Gyr, as seen by lots of spectroscopic and photometric studies,have led to a significant challenge to the traditional view of star formation.In this field,spacebased instruments, in particular the Hubble Space Telescope (HST), have made a breakthrough as they significantly improved the efficiency of detecting MPs in crowded stellar fields by images. The China Space Station Telescope(CSST)and the HST are sensitive to a similar wavelength interval,but the CSST covers a field of view which is about 5–8 times wider than that of HST.One of its instruments,the Multi-Channel Imager(MCI),will have multiple filters covering a wide wavelength range from NUV to NIR, making the CSST a potentially powerful tool for studying MPs in clusters. In this work, we evaluate the efficiency of the designed filters for the MCI/CSST in revealing MPs in different color–magnitude diagrams (CMDs). We find that CMDs made with MCI/CSST photometry in appropriate UV filters are powerful tools to disentangle stellar populations with different abundances of He, C, N, O and Mg. On the contrary, the traditional CMDs are blind to multiple populations in globular clusters(GCs).We show that CSST has the potential of being the spearhead instrument for investigating MPs in GCs in the next decades.
Key words: (Galaxy:) globular clusters: general – stars: abundances – techniques: photometric
1. Introduction
Several decades ago,star clusters were thought of as simplestellar populations (SSPs), i.e., a sample of stars with different masses that are identical in age and metallicity. The traditional star formation picture concludes that all stars formed in clustered environments should inherit the same chemical composition of their parental molecular cloud, and thus are chemically homogeneous, and are coeval because the strong initial stellar feedback makes the star formation mode a burst(e.g.,Calura et al.2015).This view has been discarded because of the detection of star-to-star chemical variations in almost all globular clusters(GCs)(see the review of Gratton et al.2019),known as multiple stellar populations (MPs) .
Significant chemical variations in star clusters can be detected among many light elements. Some of the most common elements include He,C,N,O,Na,Mg and Al.Extensive studies have shown that GCs contain more than one stellar population at different evolutionary stages:main sequence(MS,Piotto et al.2007;Milone et al. 2019), red-giant branch (RGB, Carretta et al. 2003;Mucciarelli et al. 2015; Milone et al. 2017; Latour et al. 2019;Milone et al. 2020a), horizontal branch (HB, Gratton et al. 2011)and asymptotic giant branch(AGB,Wang et al.2016;Marino et al.2017).The MP phenomenon is likely a global feature for stars at different stages, starting from the MS to evolved giants (e.g., 47 Tuc, NGC 1851, Milone et al. 2012; Cummings et al. 2014;Gruyters et al. 2017; Yong et al. 2015). In this article, we do not discuss iron-complex clusters (Type II GCs, e.g., Marino et al.2015,2019,2021).These clusters comprise the most massive GCs in the Galaxy (e.g., ω Cen, Johnson & Pilachowski 2010). Their origins may differ from most mono-metallic GCs,such as a tidally disrupted dwarf galaxy.
The elemental abundance variations are correlated with each other. Observations show that for clusters with MPs, the total abundance of C, N and O usually remains unchanged, δ[(C+N+O)/Fe]~0 (Cohen & Meléndez 2005; Marino et al.2016). Since most GCs have constant overall CNO abundance,an increase in nitrogen corresponds to depletion in carbon and oxygen. Moreover, in many metal-poor GCs with MPs,sodium anti-correlates with oxygen (e.g., Carretta et al. 2006, 2009a,2009b). The abundances of magnesium and aluminum are anticorrelated as well,but this pattern disappears in metal-rich GCs(or is very weak, Pancino et al. 2017).
The MP phenomenon is very common in old GCs, and it exhibits links to global parameters. A lot of comprehensive analyses have shown that the cluster’s total mass is a key parameter which controls some properties of MPs (e.g., the fraction of second generation stars and the internal helium and nitrogen variations, Milone et al. 2017, 2018). Indeed, many scenarios proposed to account for the origin of MPs strongly indicate the importance of cluster total masses. In these scenarios, the polluters include intermediate-age AGB stars(D’Ercole et al. 2010), fast-rotating massive dwarfs (Decressin et al. 2007), massive interacting binaries (de Mink et al. 2009)and single supermassive MS stars (Denissenkov & Hartwick 2014).Studies of clusters in the Magellanic clouds indicate that some clusters older than ~2 Gyr have a hint of MPs, while their younger counterparts do not (Martocchia et al. 2018;Milone et al. 2020a). This has led to a hypothesis that cluster age determines the occurrence of MPs, perhaps linked to some non-standard stellar evolutionary processes (Bastian &Lardo 2018,however,see Li et al.2020;Li 2021).However,so far only a few young massive clusters (YMCs) (younger than~6 Gyr) have been scrutinized in terms of their stellar populations (Gratton et al. 2019, their Figure 7). It remains unclear if the phenomenon of MPs is a common pattern for YMCs, which may represent the infant stage of GCs we see today.
Both spectroscopic and photometric studies provide complementary information for understanding the MPs. Spectroscopic studies have provided many details about the chemical properties of stellar populations. Mostly, this method is sensitive to the brightest stars. Ultraviolet (UV)-optical-based photometry is a high efficiency method that overcomes the effect of crowding of clusters, allowing us to examine millions of stars at different evolutionary stages and positions,even in the densest regions of clusters.This is important because to fully understand the origin of MPs, a large sample of clusters covering an extensive parameter space is required.An example of photometric studies of MPs is the breakthrough made by the Hubble Space Telescope(HST).The high spatial resolution of the HST allows deep observations into clusters’ core region, resulting in clean color–magnitude diagrams (CMDs) with subtle features. Actually, the effect of the He variation in GCs is detected through photometry rather than spectroscopy (see Piotto et al. 2007;Bellini et al. 2010 for early helium determination in ω Cen and NGC 2808 respectively)because the helium line associated with photospheric transitions can be detected only in stars hotter than 8,500 K. Moreover, the abundances inferred from HB stars hotter than ~11,500 K are not representative of the stellar helium content. As a consequence, helium abundance can be only estimated in HB stars that span a small temperature interval14The He II 10 830 Å absorption line can be used for He abundance determination, but it requires expensive high-resolution spectra in the infrared passband.(e.g., Marino et al. 2014).
Because He enrichment will reduce the stellar atmospheric opacity and increase the interior mean molecular weight,stars with different He abundances will have different surface temperatures and nuclear burning rates in each stage, thus complicating the CMD(e.g.,Piotto et al.2007;Milone 2015).For other light elements, such as C, N and O, their variations can be seen in filters encompassing wavelengths shorter than~4000 Å in late-type stars. Late-type stars with the same global parameters(Teff,logg,[Fe/H]),but which are different in CNO abundances, will have their spectral energy distribution (SED) almost identical in optical passband but different in the UV (e.g., Milone et al. 2015a, 2015b). Because most CNO-related features are distributed in the wavelength range of UV to blue:for example,most O-absorptions dominate the range of λ ≤3000 Å, the NH-, CN- and CH-absorptions are centered at λ=3370 Å, 3883 Å and 4300 Å, respectively. In addition,the Mg II doublet centered at 2795/2805 Å is one of the most important UV-absorption features, which can be detected by corresponding UV-passbands (e.g., Milone et al.2020b). We recommend Milone (2020) as a nice summary.Indeed, as affirmed by the HST UV Legacy Survey of Galactic Globular Clusters, almost all Galactic GCs contain MPs (Piotto et al. 2015; Milone et al. 2017), undoubtedly indicating that UV-optical telescopes are powerful tools for studying MPs.
The China Space Station Telescope (CSST) is a two-meter UV-optical space telescope, co-orbiting with the China Manned Space Station, which will be launched around~2024. The Multi-Channel Imager (MCI), a three-channel simultaneous imaging covering a wavelength range of 0.255–1 μm,is one of the five instruments on board the CSST.The MCI has a spatial resolution similar to the HST(0 18 at 633 nm).Its field of view (FoV) is 7 5×7 5, about 500% of the ACS/WFC@HST (202″×202″) and 770% of the UVIS/WFC3@HST (162″×162″), which thus covers larger fields of star clusters than the HST.It will be equipped with a 9k×9k CCD,and 30 filters with different bandwidths (10 per channel).Overall, CSST is an HST-like next generation space telescope with similar wavelength coverage and spatial resolution and a larger FoV.For details about the CSST,we refer to the review of Zhan (2021).

Table 1 MCI/CSST Filter Parameters (Ranked by Increasing Mean Wavelength)
It is, therefore, essential to study the effect of MPs in the MCI/CSST photometric system. This work aims to find the most suitable filters which can maximize the color separation between MPs in CMDs. The article is organized as follows: in Section 2,we introduce the details of our method.We show our main results in Section 3. A brief discussion of our results is presented in Section 4.
2. Bolometric Corrections for Multiple Stellar Populations
The current designation of the MCI/CSST photometric system includes 15 wide passbands (full width at half maximum (FWHM)/λc>15%, where λcis the mean wavelength of the passband), 3 medium passbands (5%<FWHM/λc<10%) and 12 narrow passbands (FWHM/λc<3%, except for the CSST-f343n filter, which follows the definition of the HST/WFC3-F343N). There are two dichroic filters in the light path of MCI, which divide the wavelength range of MCI into three channels at 255 nm–430 nm,430 nm–700 nm, and 700 nm–1000 nm. These dichroic filters prevent the use of filters such as g and i bands. In Table 1 we summarize some basic information on the adopted filters,including (1) their mean wavelengths, λc; (2) the FWHM; (3)the corresponding wavelengths of 50% of the maximum transmission curve(left:λL50,right:λR50);(4)the steepness of the transmission curve, described by Tanx=Δλx/λx, where x is L50/R50 and Δλxis the wavelength difference between 0%and 100% maximum transmission, and (5) the average transmission efficiency within FWHM, T50. The transmission curves for MCI/CSST filters are presented in Figure 1 (wide passbands) and Figure 2 (narrow and medium passbands). We do not show the transmission curve for the CSST-WU passband because it is being redesigned.
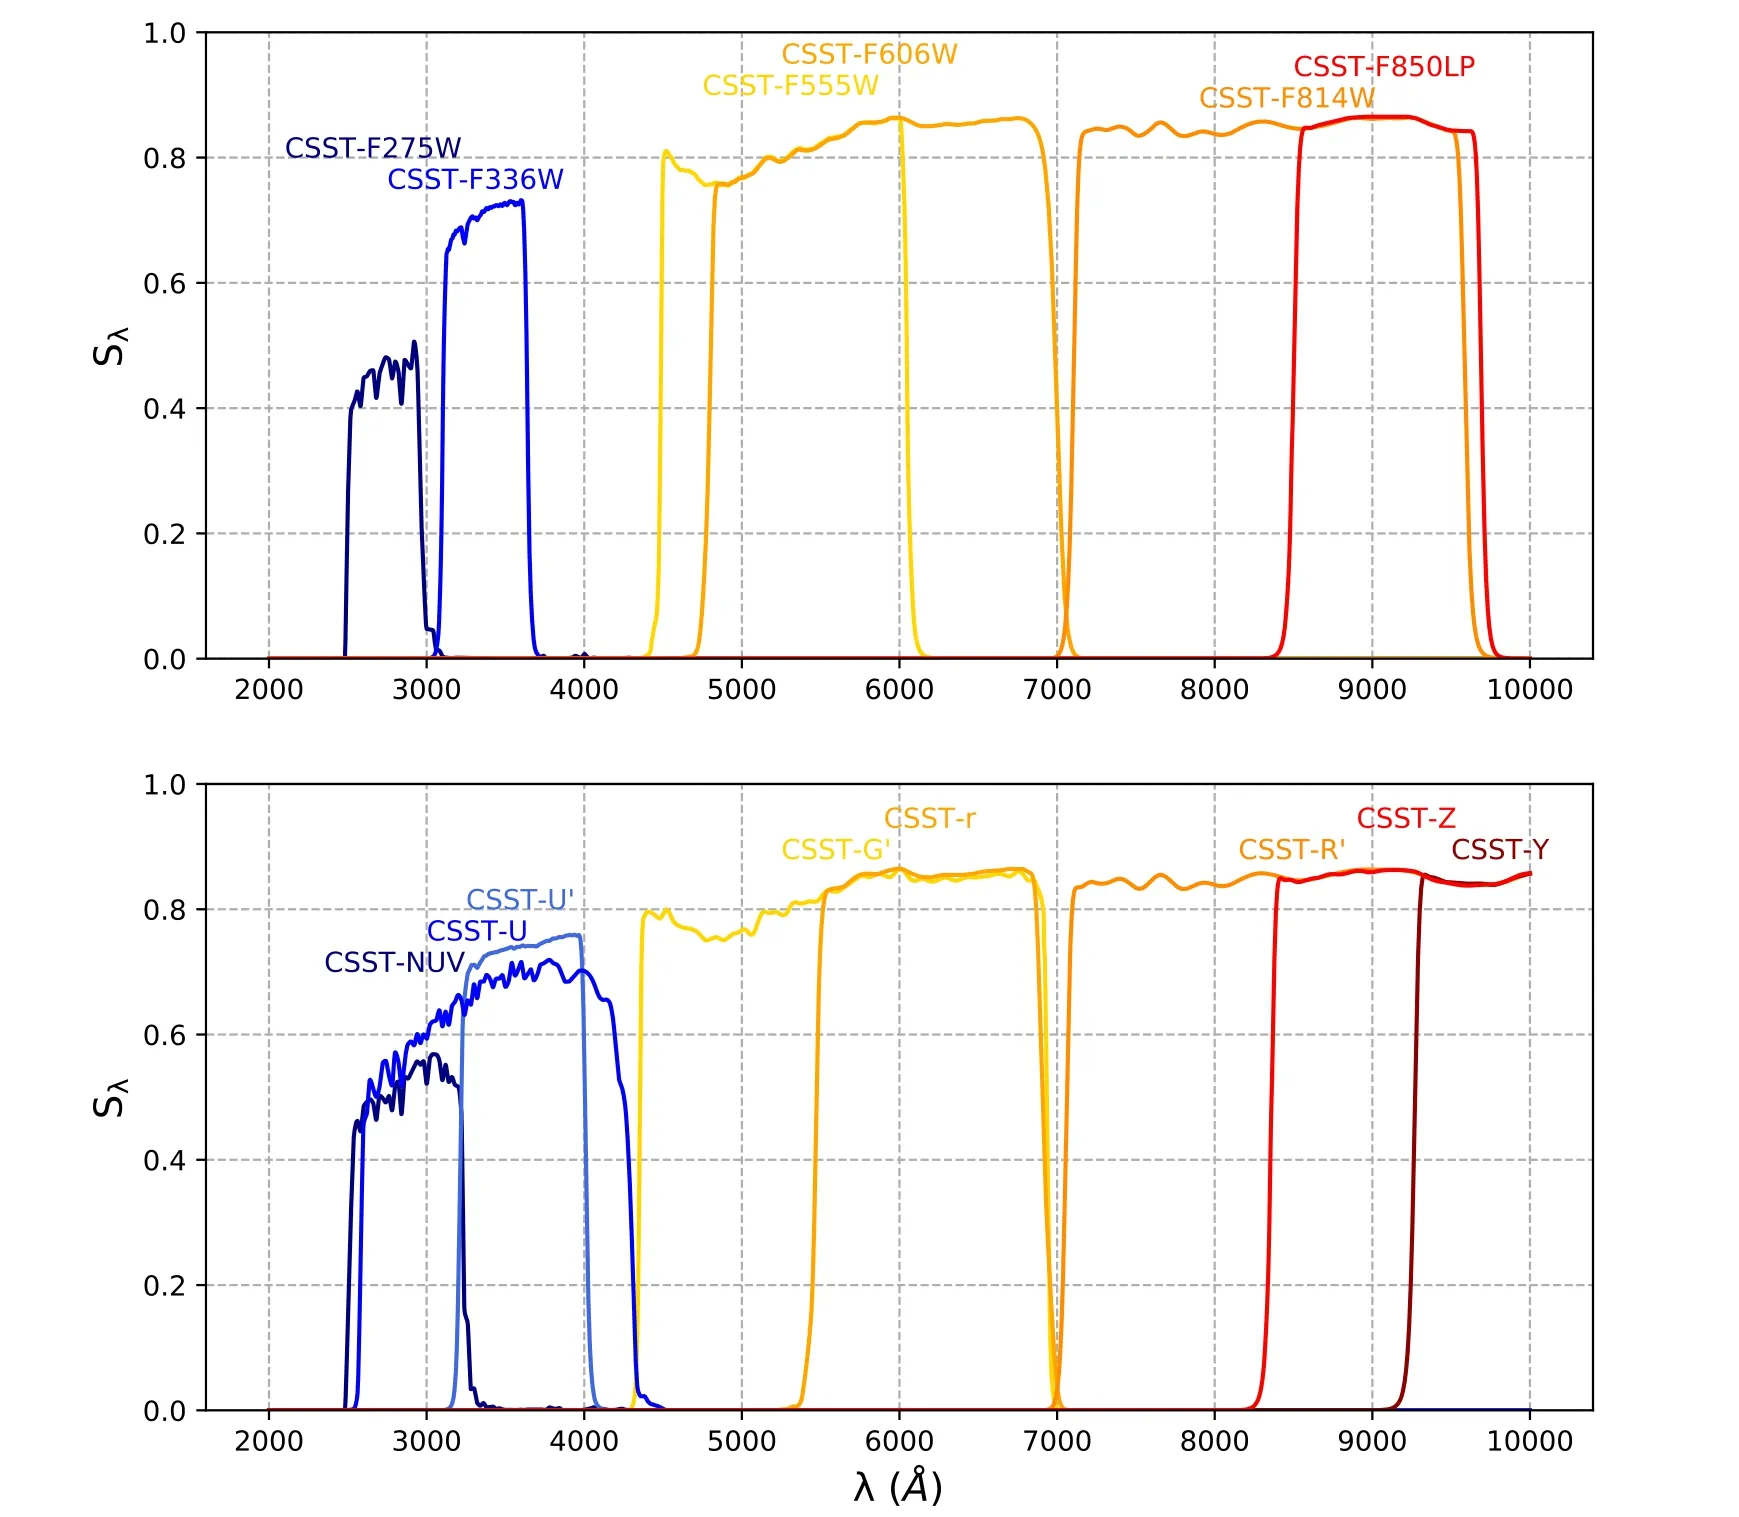
Figure 1. The total transmission curves for MCI/CSST wide filter bands, with detector quantum efficiency being considered.
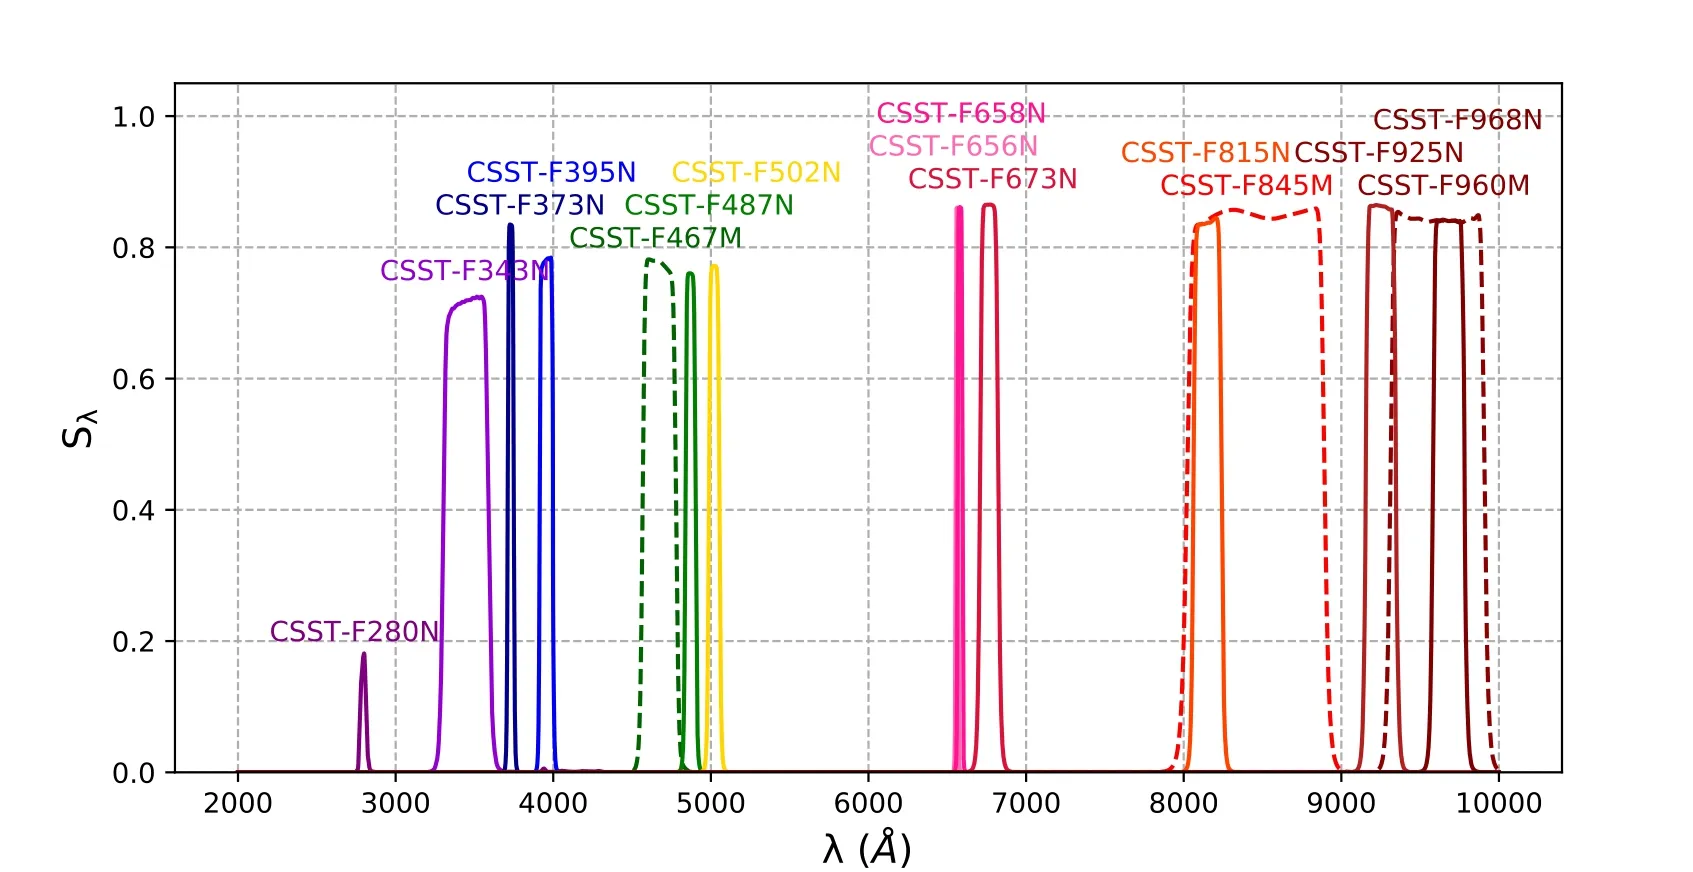
Figure 2. Same as Figure 1, for narrow and medium (dashed curves) filters of the MCI/CSST.
To evaluate the effect of MPs on the MCI/CSST photometric system,we need to select a given chemical pattern to simulate its effect on photometry.In this work,we studied two cases,an NGC 2808-like MP and a less extreme case with chemical variations half those of NGC 2808.We study these two cases because NGC 2808 represents a quintessential (extreme) example of a mono-metallic GC that exhibits variations in almost all light elements(Piotto et al.2007; Gratton et al. 2011; Mucciarelli et al. 2015; Wang et al.2016; Latour et al. 2019). The half-NGC 2808 chemical pattern can represent many less massive GCs with MPs(see,Milone et al.2018). We utilized the Dartmouth Stellar Evolution Database(Dartmouth model) to generate isochrones with different He abundances(Dotter et al.2008).We define two stellar populations described by two isochrones to represent an NGC 2808-like MP.The Dartmouth model allows us to interpolate any isochrone with parameters within -2.5 <[Fe/H]<+0.5 dex, initial He abundances from Y=0.245 to 0.40,and ages from 1 Gyr to 15 Gyr.It is a suitable stellar model to describe an NGC 2808-like GC with an extreme helium enrichment. Based on the literature of Piotto et al. (2007), we adopt the age and metallicity of our two populations,both t=12 Gyr and[Fe/H]=-1.0 dex,respectively.They are different in He abundance, with Y=0.25 for one population and Y=0.40 for the other (hereafter 1P and 2P). The[α/Fe] is 0.0 dex as we confirm that it has a negligible effect on the derived isochrones.
The derived isochrones contain a series of physical parameters, including stellar masses (M/M⊙),effective surface temperatures (logTeff), surface gravity (logg) and luminosities(l ogL L⊙). These parameters, along with the adopted metallicity ([Fe/H]), are used for calculating the bolometric corrections through the PARSEC database of bolometric correction(The YBC database, Chen et al. 2019). The YBC database provides absolute magnitudes in the CSST filter set(we obtain the specific MCI/CSST magnitudes through private communication with Dr. Chen Yang).
We relied on the package SPECTRUM (version 2.77) to calculate isochrones with specific elemental abundances,and thus loci for stellar populations.Given a stellar atmosphere model and certain inputs, SPECTRUM calculates a synthetic stellar spectrum with input parameters.SPECTRUM can calculate reliable synthetic B- to mid-M-type stellar spectra. The synthetic spectra are calculated under the silent&isotope& ATLAS modes.The input line lists are obtained from the main page of the SPECTRUM package,15http://www.appstate.edu/~grayro/spectrum/ftp/download.htmlwhich includes more than 1.6×10⁸absorption lines covering a wavelength range of 900 Å–40000 Å. The input atmosphere models were computed with the ATLAS9 model atmosphere program written by Kurucz(1993)16https://wwwuser.oats.inaf.it/castelli/grids.htmlwith parameters([Fe/H], logg, Teff) from the base isochrone.
We calculate synthetic spectra with different elemental abundances for 1P and 2P stars. Under the adoption of [Fe/H]=-1.0 dex and assuming that the total abundance of CNO remains unchanged, we set all 2P stars to have δ[N/Fe]=+1.0 dex, and δ[O/Fe]=δ[C/Fe]=-0.5 dex. Spectroscopic studies show that NGC 2808 has an Na–O anti-correlation for its member stars (Carretta et al. 2009a). We adopt δ[Na/Fe]=+0.5 dex through visual inspection(Figure 7 of Carretta et al. 2009a), corresponding to a 0.5 dex depletion of the O abundance.According to Pancino et al.(2017),NGC 2808 also exhibits Mg–Al anti-correlation, and we set a δ[Mg/Fe]=-0.5 dex and δ[Al/Fe]=+1.0 dex for 2P stars in our model. We will examine the effects of an NGC 2808-like MP both with/without Y variation (hereafter Case 1 and Case 2 respectively), and a less extreme case with all element variations being half that of NGC 2808 (no Y variation, Case 3). We also test other effects of individual element variation,including(1)the Y variation,(2)the CNO variation,(3)the Na variation,(4)the Mg variation and(5)the Al variation,as well.In these cases, we (not-so-)arbitrarily assume reasonable variations based on literatures (Piotto et al. 2007; Carretta et al.2009a;Pancino et al.2017).We summarize these adopted models in Table 2. The isochrones for chemically enriched stellar populations, and thus 2P loci, are calculated as follows,

where Miis the expected absolute magnitude for a chemically enriched star observed through the filter band i (see Table 1),and Mi,0is the corresponding absolute magnitude for the counterpart with normal chemical abundance. fλandλf0are their radiative fluxes (at 10 pc) we received at the central wavelength of λ,which are calculated through SPECTRUM.Sλ,iis the transmission curve of a specific filter band i. The quantities λ1and λ2indicate the lower and upper wavelength limits respectively. According to the wavelength range of the CSST, we set them as 2500 Å and 10,000 Å, respectively.
Finally,we will compare the loci of the 1P(described by the standard isochrone) with that of the 2P. To quantify their performances at separating two populations, we will calculate their color differences referring to the filter CSST-f814w,Mi-Mf814w,for a referenced RGB star(below the RGB bump)with Mf555w=2.0 mag and a bottom MS star with Mf555w=8.0 mag. The selection of these two stages is arbitrary, which corresponds to a K1-type giant and a K4-type dwarf. We confirm that they are sufficiently cool to exhibit prominent absorption features of CNO-related molecules. In this work, a positive color difference means the chemically enriched population of stars (defined in Table 2) is bluer than normal stars.
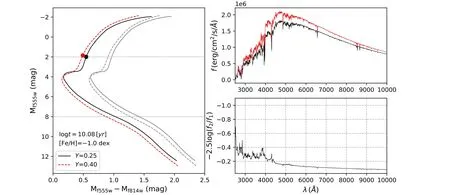
Figure 3.The effect of helium variation in the CMD.Left panel:the CMD in Mf555w-Mf814w vs.Mf555w for 1P(black solid line)and 2P(He-rich,red dashed line).Grey dotted lines signify the RGB and MS stages at Mf555w=2.0 and 8.0 mag.The same loci for 1P and 2P under the UVIS/WFC3 HST photometric system are also present(gray solid and dashed lines).Two example RGB stars are highlighted by black(He-normal)and red(He-rich)circles.They are at the same stage indicated by the DSEP model.The upper-right panel exhibits their synthesis spectra(black:helium-normal;red:helium-rich).The bottom-right panel features the spectrum of their magnitude difference.

Table 2 Adopted Models with Different Abundance Variations for 2P Stars
3. Color–Magnitude Diagrams
In this section we present our main results, which include CMDs of 1P and 2P loci with different chemical patterns(Table 2).
3.1. Helium Variation
Helium is the direct product of H-burning. Polluted stars with chemical anomalies must be He-enriched. As introduced,member stars of GCs are too cold to produce He absorptions at UV-optical passbands.For old stellar populations like GCs,the effect of He enrichment is evolutionary.The effect of helium is reflected by the value of the average molecular weight, μ, and the opacity, κ0. Because the helium opacity is lower than the hydrogen opacity, an increase of the helium abundance at constant metallicity will increase μ and decrease κ0,making the stellar evolutionary track have higher luminosity (L) and effective temperature (Teff). In addition, the increased L will make stars burn their central hydrogen faster than He-normal stars. As a result, the He-enriched population will always exhibit a lower main-sequence turnoff (MSTO) because it evolves more rapidly than its coeval He-normal stellar population.
In Figure 3 we display the isochrones for the 1P(He-normal,Y=0.25)and 2P(Y=0.40)stars(left panel).In the upper-right panel we show two giant spectra with different He abundances at the same evolutionary stages,as indicated by the black(Henormal) and red (He-rich) circles in the left panel. In the
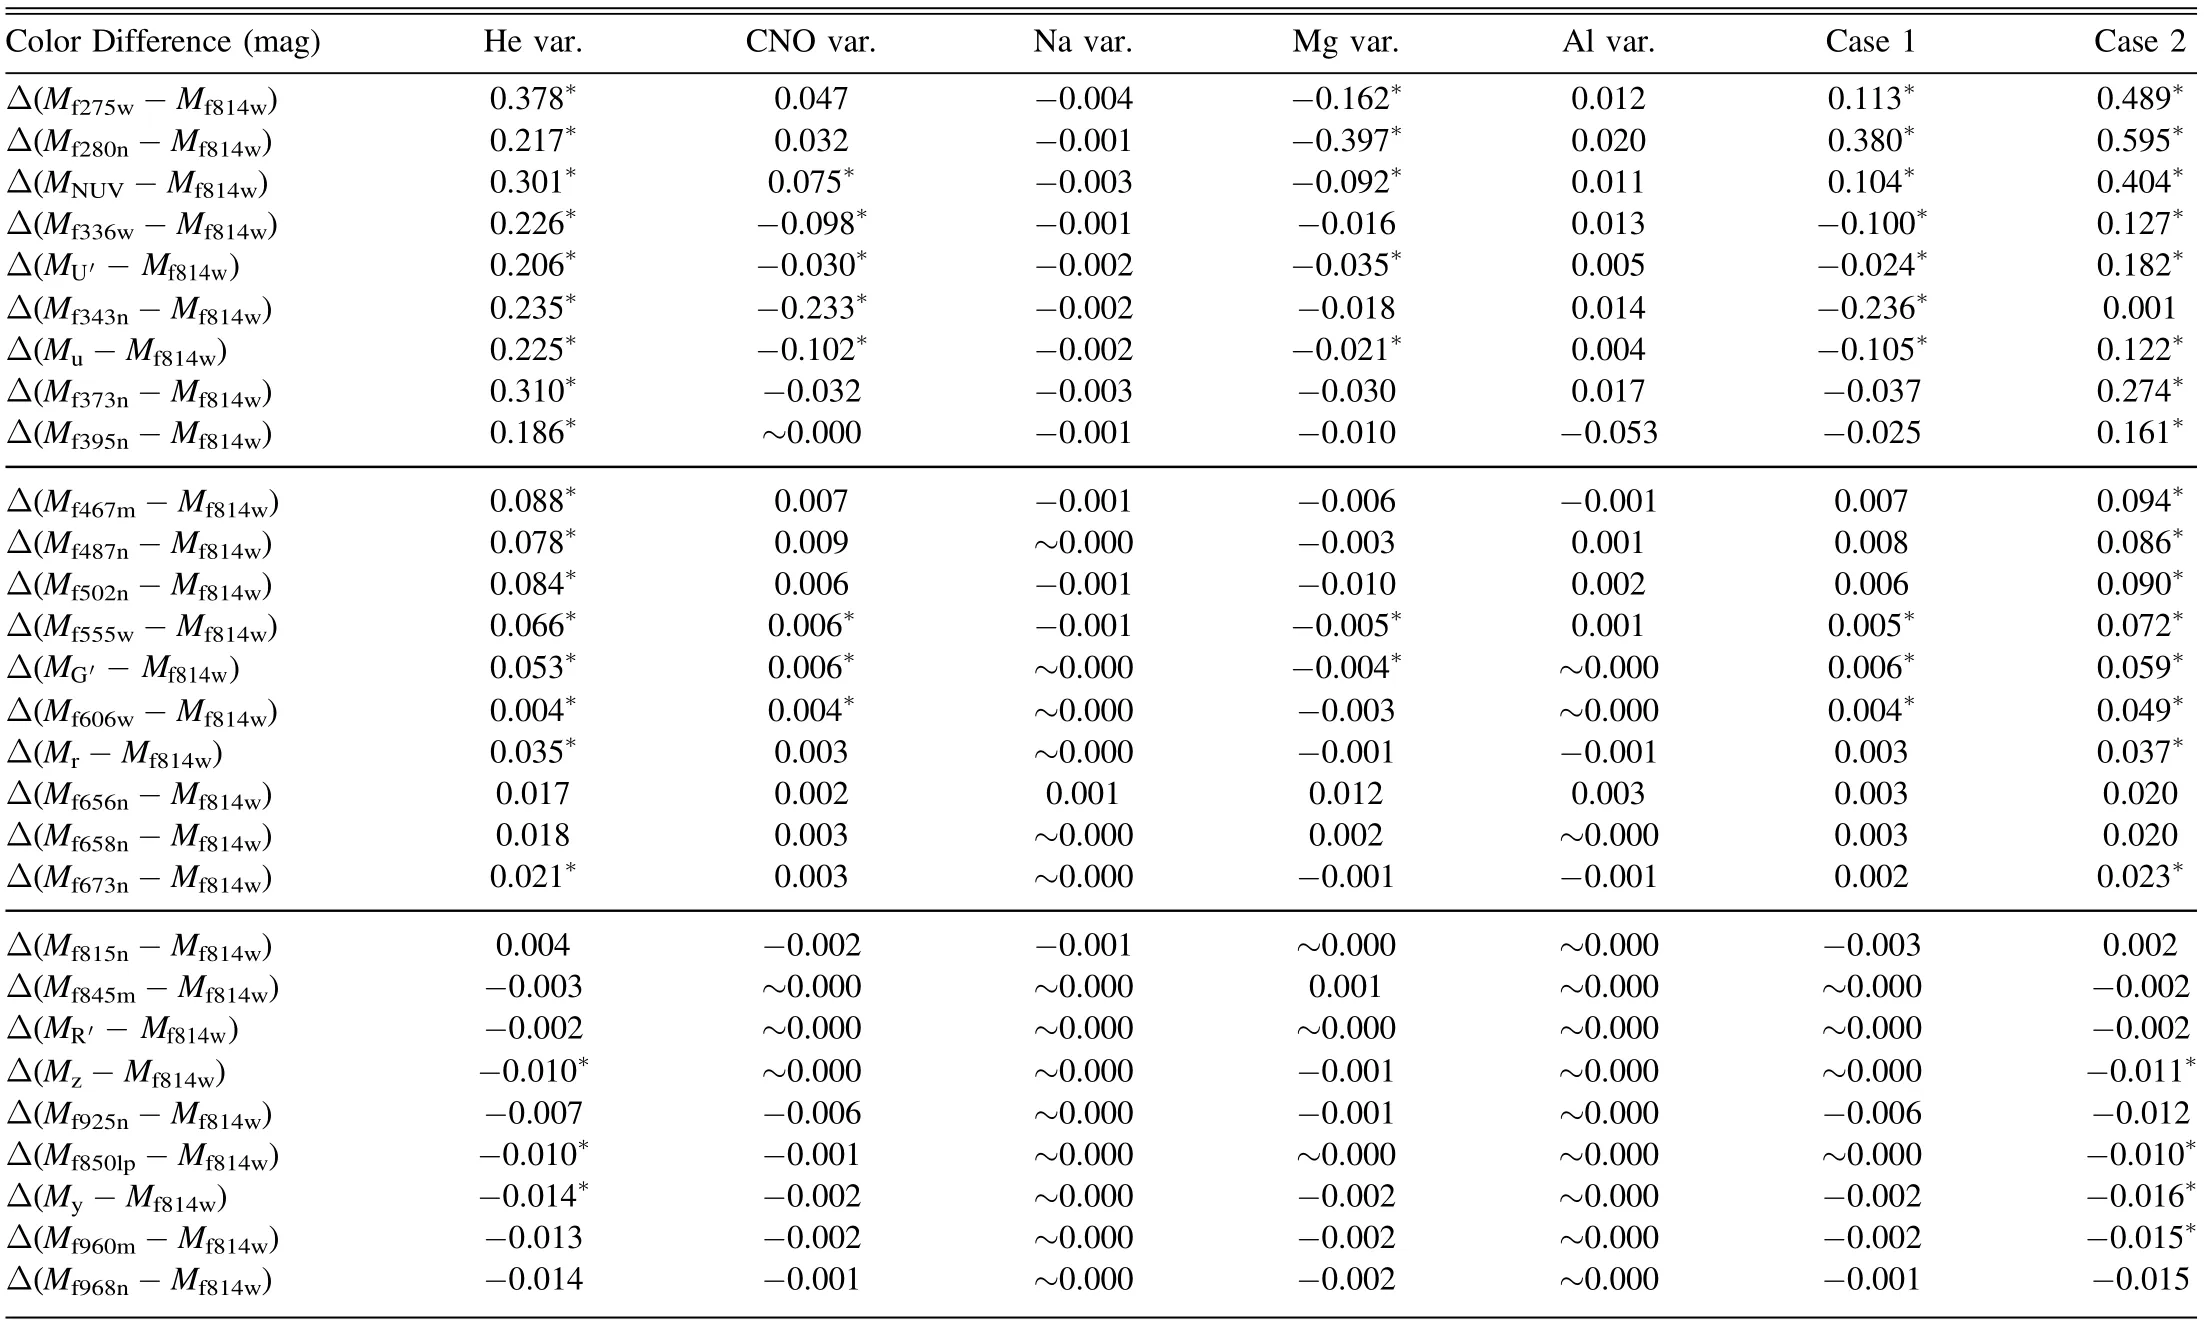
Table 3 Color Differences of Mi-Mf814w(i Indicates Different Filter Bands,see Table 1)between 1P and 2P(for Different Chemical Variations[var.],see Table 2),for the Referenced RGB Stage
Note. The number associated with an asterisk means this color difference can be resolved at the distance of NGC 2808 with a total exposure time of 300 s (see discussions in Section 4).bottom-right panel we exhibit their flux ratios in terms of- 2.5 logf2f1(f2and f1are fluxes of 2P and 1P stars respectively), which is the same as a magnitude difference spectrum. Figure 3 demonstrates that for two stars at the same evolutionary stage, the He-rich star is brighter/bluer than the normal star. The color axis in Figure 3 is described by Mf555w-Mf814w, and for the referenced RGB(MS) stage(indicated by gray dotted lines), the color difference between the two populations is Δ(Mf555w-Mf814w)~0.07(0.15) mag,respectively. As a comparison, we also show the same loci for 1P and 2P under the HST photometric system (UVIS/WFC3),as indicated by gray solid(1P)and dashed(2P)lines in the left panel.We find that the color separations between 1P and 2P are similar in the MCI/CSST and UVIS/WFC3 HST filter systems. The color differences between other passbands,Δ(Mi-Mf814w), are calculated, which are presented in Tables 3 and 4 (for the RGB and MS stages respectively).
Figure 3 affirms that helium-rich MS and RGB stars are hotter than their normal counterparts. A wide color baseline is efficient for disentangling stellar populations with different helium abundances. In Figure 4 we show three isochrone pairs which describe Y=0.25 and Y=0.40 populations in different colors,Mf275w-Mf814w, Mf336w-Mf814wand Mf555w-Mf814w(from left to right respectively).It shows that a wider color baseline can resolve a larger color difference between the two populations.These color differences between 1P and 2P are similar to those under the UVIS/WFC3 HST photometric system(gray solid and dashed lines,respectively).Figure 5 presents the color differences in different filter bands, Mi-Mf814w. Indeed, we find that the bluer the first filter band,the higher the color difference between the two populations. The maximum color differences at both the RGB and MS stages appear in Mf275w-Mf814w, which are Δ(Mf275w-Mf814w)~0.4 mag and ~0.7 mag, respectively. To resolve such color differences, a minimal signal-to-noise ratio ofSNR ~4 for each passband is required (see discussions in Section 4).
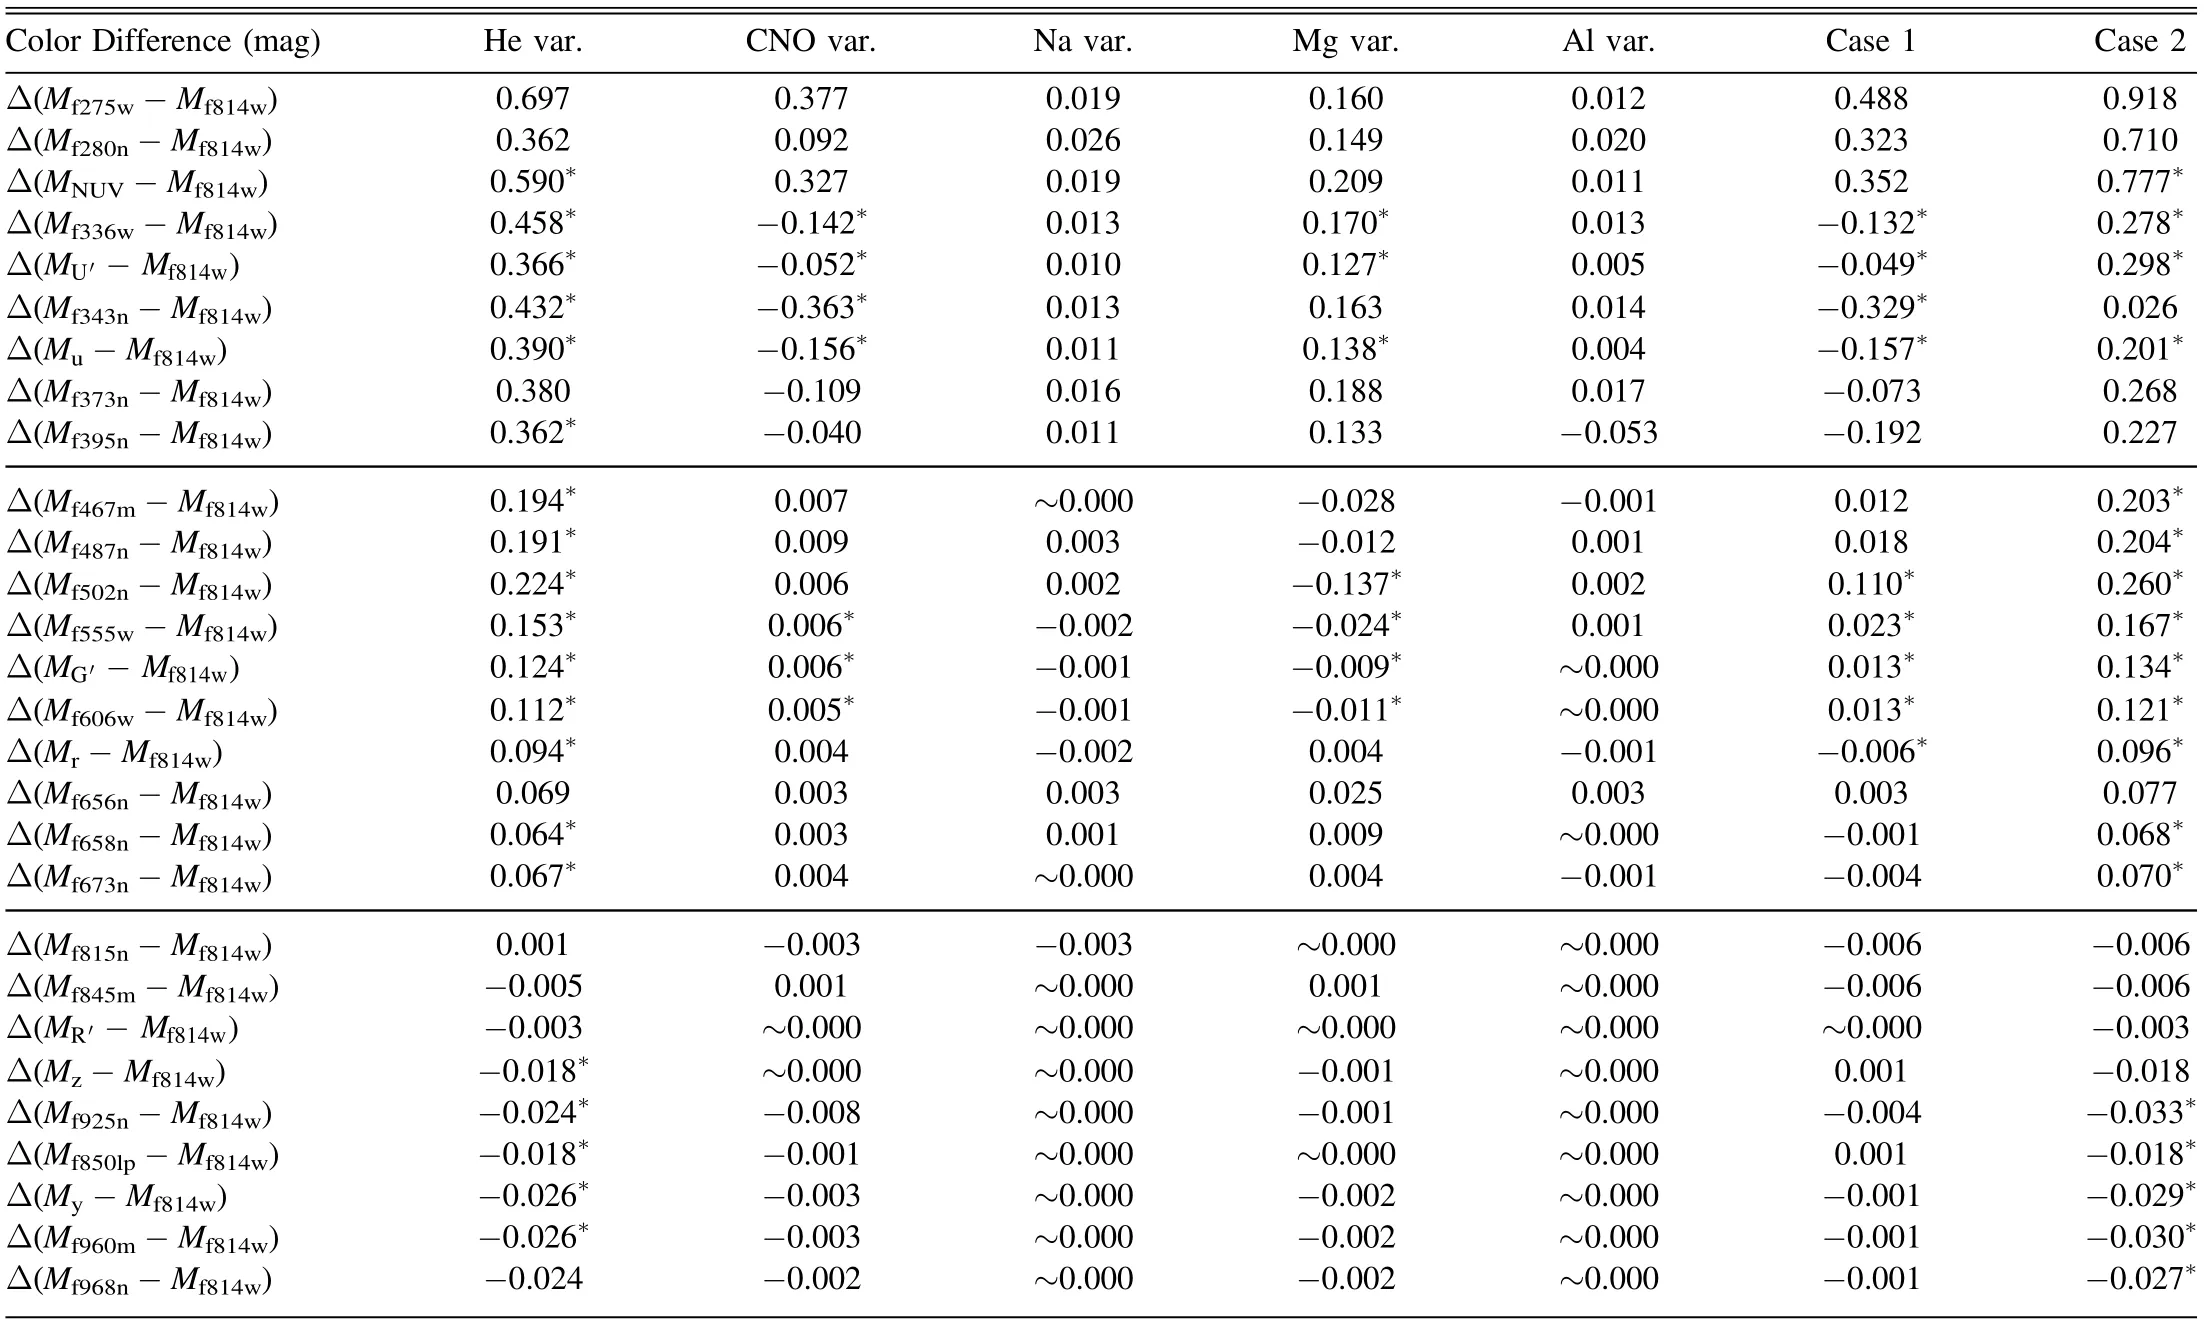
Table 4 The Same as Table 3, Except that the Reference Stage is the Bottom MS
3.2. Carbon, Nitrogen and Oxygen Variations
Measuring CNO variations in photometry requires specific filter bands. As introduced in Section 1, filters centered at the wavelength of λ ~3370 Å (i.e., CSST-f336w, CSST-f343n)would see N-rich stars fainter than normal stars (at the same stage). Since N-enriched stars are CO-depleted, these stars should be brighter than CO-normal stars in filters covering the wavelength range of λ <3000 Å (OH-absorption dominated)or λ ~4300 Å(CH-absorption).Unfortunately,the latter is not included in the MCI/CSST filter system. We present the color differences between the normal population and the population with CNO anomalies (see Table 2) in different color baselines in Figure 6.Indeed,we find that around ~3370 Å normal stars are brighter than N-rich stars. They present negative color differences in color bands involving specific filters (in particular the CSST-f336w and CSST-f343n filters). For filters bluer than ~3000 Å (CSST-NUV, CSST-f280n,CSST-f275w), normal stars are fainter than N-rich stars as the latter are O-depleted, and their color differences are positive.
Figure 6 indicates that if we select a color band involving a filter with λc<3000 Å (CSST-f275w) and a filter with λc~3370 Å (CSST-f343n), we can maximize the color difference between the normal and N-rich population of stars.It also tells us that the color separation is more significant at the MS stage than the RGB, because the selected MS stage has a surface temperature lower than that of the RGB. Stars with lower atmosphere temperatures will have stronger CNO-related molecular absorptions. In Figure 7 we present two CMDs for the normal and N-enriched (CO-depleted) populations (1P and 2P respectively). The upper-left panel presents the CMD involving two visible filter bands, CSST-f555w and CSSTf814w, which show a negligible difference between the two populations. The bottom-left panel features two populations in the color of Mf275w-Mf343n, which exhibit a dramatic color difference. Indeed, similar filter bands are frequently used in HST photometry for studying MPs of GCs (e.g.,Milone et al.2018;Nardiello et al.2018).We present these loci under the same UVIS/WFC3 HST filters in the panel. Again,the color differences between the 1P and 2P revealed by CSST and HST are similar.In the right panels of Figure 7,we display spectra of the referenced RGB star and its counterpart with CNO anomalies (upper) and their magnitude difference spectrum (lower), which explains why the combination of CSST-f275w and CSST-f343n can maximize their color difference. The color differences caused by CNO variation in different filter bands are present in Tables 3 and 4.
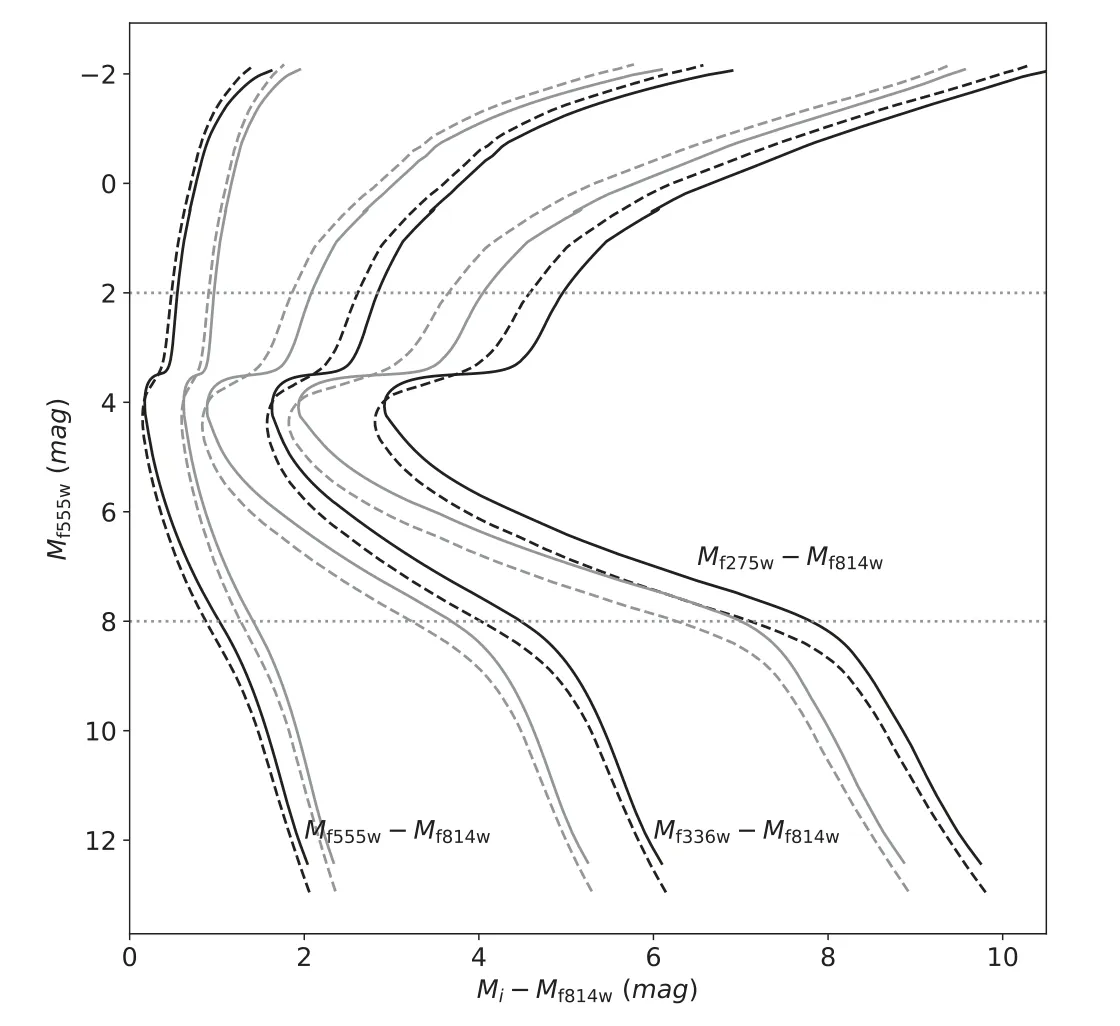
Figure 4.From left to right,loci of normal (1P,black solid lines)and heliumrich (2P, black dashed line) populations in colors of Mf275w-Mf814w,Mf336w-Mf814w and Mf555w-Mf814w, respectively. The same loci for 1P and 2P under the UVIS/WFC3 HST photometric system are indicated by gray solid and dashed lines respectively.
3.3. Sodium Variation
We apply the same analysis to stellar populations with different Na abundance. Although for MPs the Na and O abundances are always anti-correlated, in this subsection we only consider an Na enrichment of δ[Na/Fe]=0.5 dex. More realistic considerations (NGC 2808-like) will be discussed later.Our analysis shows that Na enrichment has a very limited effect on photometry. Although lots of Na I and Na II absorption lines occur in the UV band, the maximum color difference between the two populations does not exceed 0.03 mag. We also find that Na-enrichment has opposite effects on the MS and RGB stages. Na-rich stars are slightly bluer than normal stars at the RGB stage,but are redder at the bottom MS,as depicted in Figure 8. We conclude that the filters designed for MCI/CSST are not suitable to identify MPs with different Na abundance.
3.4. Magnesium Variation
The most significant difference between the normal and Mgrich population stars appears in the color band of Mf280n-Mf814w. Our analysis shows that for the RGB stage,their color difference reaches Δ(Mf280n-Mf814w)=-0.4 dex.This is caused by the combination of the Mg II 2795 Å and 2803 Å absorption lines. Intriguingly enough, the color difference is reversed for the bottom MS populations. The Mg-rich population is bluer than the normal population in most color bands involving UV filters, but is redder in Mf502n-Mf814w. Since its chemical abundances are identical to the RGB, this difference is possibly caused by their surface gravity (logg) difference. Since the degree of ionization depends on the stellar surface gravity, it mainly affects the wavelength range below 3650 Å.Indeed,as shown in Figure 9,filters with central wavelength below 4000 Å are significantly affected. The lower surface temperature may also affect the SED: for very late stars, the enhanced Mg abundance will produce a deeper absorption band, including Mg I 5167 Å,5173 Å and 5184 Å,than a normal star, which thus affects the CSST-f502n photometry. Since to explain the details of this difference is beyond the scope of this article, we leave it as an open question for future investigation.
Figure 9 indicates that the separation between normal and Mg-rich is most significant in the color band of Mf280n-Mf502n.We present the CMDs of normal(1P)and Mg-rich(2P)populations in the left panels of Figure 10.We find the optimal filter sets used for separating the normal and Mg-rich populations are CSST-f280n and CSST-f502n (for HST,these are F280N and F502N accordingly). In these two filters,the color difference between 1P and 2P is much more significant than that observed in optical passbands (i.e.,Mf555w-Mf814w). The color difference seen by the CSST is less significant than that observed by HST at MS, however.Because the transmission curve of the HST F280N filter is higher than that of CSST,the former is more sensitive to small Mg variation. In the right panels of Figure 10 we present the magnitude difference spectra between the Mg-rich and normal reference stars(top-right:RGB stars;bottom-right: bottom MS stars).
3.5. Aluminum Variation

Figure 5. Color differences between normal and helium-enhanced populations in different color bands.

Figure 6. Same as Figure 5, but for normal and N-enriched (CO-depleted) populations.
The effect of Al-enrichment is similar to that of Mg(Figure 11). When considering the colors of Mi-Mf814w,where Mionly contains filter bands bluer than 3800 Å, the Alrich population is redder than the normal population at RGB stage, but is bluer at the bottom MS range. These color differences are very small (|Δ(Mi-Mf814w)|<0.02 mag).Only for the bottom MS range in the color band of Mf395n-Mf814w, the Mg-rich population is redder than the normal population with Δ(Mi-Mf814w)<-0.05 mag. This is caused by the combination of Al I lines at 3944 Å and 3962 Å.However,resolving such a small color difference at the bottom MS in a narrow filter band may require a very long exposure time (see Section 4). We, therefore, do not recommend using the CSST photometry to study Al variations in star clusters.
3.6. NGC 2808-like Multiple Populations
Above we only discuss the effects of MPs with variations of a few or individual elements. A more realistic case should involve variations in all these elements. In this work, we only consider the variations of He,C,N,O,Na,Mg and Al because they are the most abundant elements in stellar atmospheres,producing strong absorption features.For GCs with MPs,Li,F,and some s-process elements may vary from star-to-star as well. Because of their small mass fraction, strong photometric effects caused by these variations are not expected. In this section, we study two cases that follow the definitions inpopulations. We also suggest an alternative color band of MNUV-Mu.Although the color difference between the 1P and 2P is not so significant in this band like Mf275w-Mf343n, the CSST-NUV and CSST-u filters have much wider FWHM than the CSST-f343n (see Figures 1 and 2), which can save lots of exposure time.In addition,these two filter bands will be used in the CSST main survey as well (Gong et al. 2019). In Figure 13 we show the CMDs of two populations in CMDs involving colors of Mf275w-Mf343n, MNUV-Muand Mf555w-Mf814w. The isochrones described by F275W and F343N passbands of UVIS/WFC3 HST are represented by gray solid and dashed lines, respectively. The CSST and HST can separate well the loci for 1P and 2P, and their separations are similar.
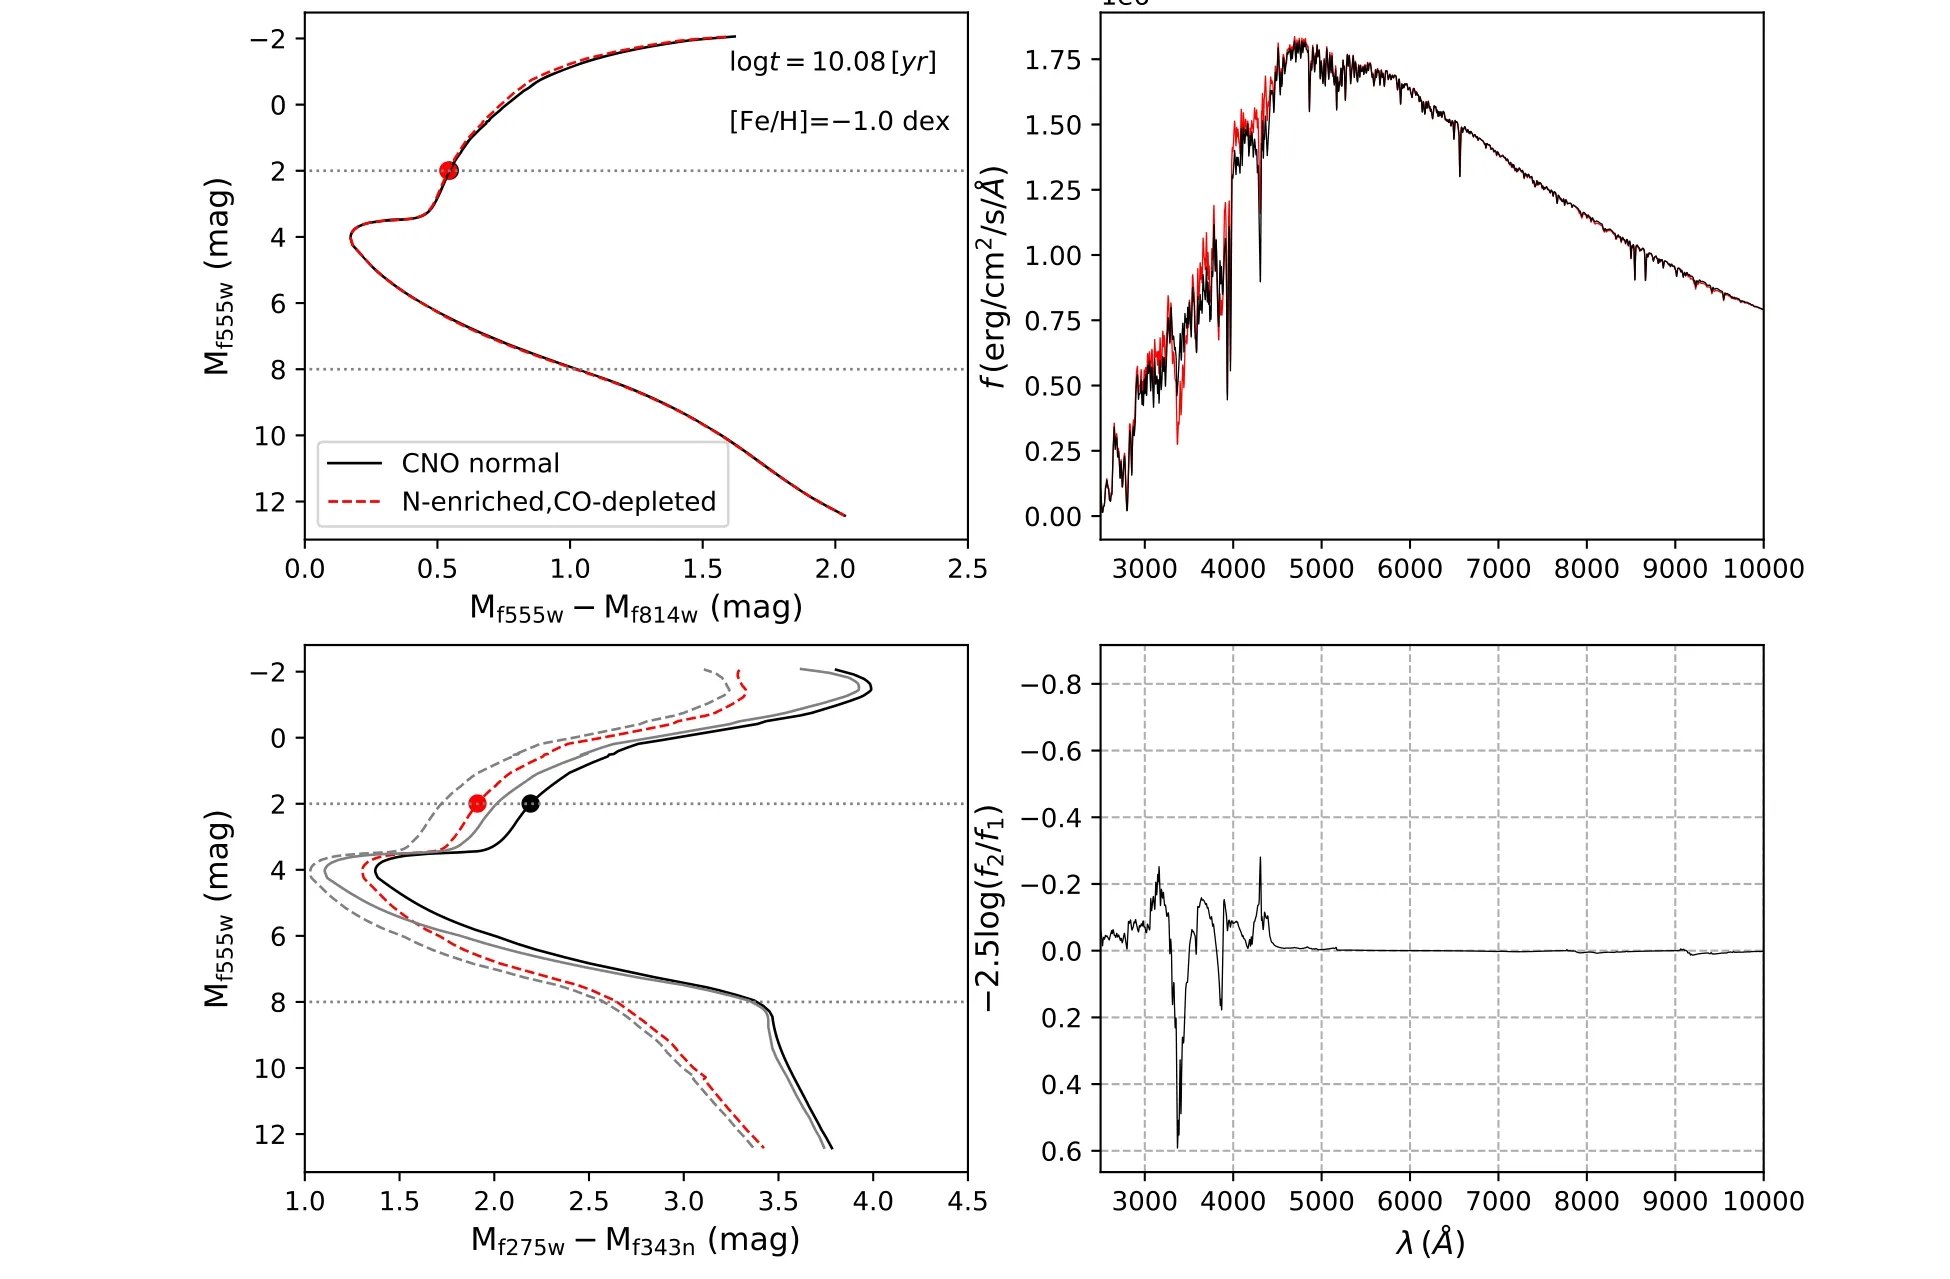
Figure 7. Same as Figure 1, but for normal and N-enriched (CO-depleted) populations (1P and 2P respectively). In left panels we exhibit two loci under colors of Mf555w-Mf814w(top)and Mf275w-Mf343n(bottom),respectively.Grey solid and dashed lines are loci of 1P and 2P in UVIS/WFC3 HST filters respectively.Spectra in right panels are for RGB reference stars.
The color differences between 1P and 2P stars for Case 2 are presented in Figure 14. Driven by the He-enrichment, 2P becomes bluer in all color bands. For this case, the color difference between the 1P and 2P bottom MS can reach Δ(Mf275w-Mf814w)>0.8 mag. Although He variation produces the most significant color difference,we can derive other element variations through different color bands. For example,in Figure 5 we can see if the 1P and 2P are only different in He abundance, they will show a color difference of Δ(M343n-Mf814w)~0.2–0.5 mag. This difference becomes negligible if they are also different in CNO abundances, because N-enrichment (CO-depletion) will make the 2P stars redder than normal stars,compensating the effect of He-enrichment.In addition, if the He-rich population is Mg-depleted, it will become much bluer in the Mf280n-Mf814wcolor band(Δ(Mf280n-Mf814w)~0.6–0.8 mag) than the case without Mg-depletion (Δ(Mf280n-Mf814w)~0.2–0.4 mag, Figure 5).This situation is illustrated in Figure 15.
3.7. A Less Extreme Case

Figure 8. Same as Figure 5, but for normal and Na-enriched populations.
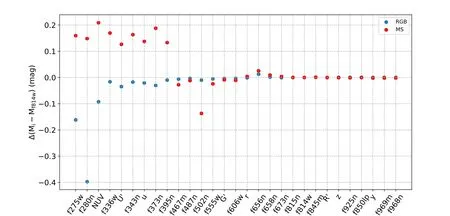
Figure 9. Same as Figure 5, but for normal and Mg-enriched populations.
We have calculated a less extreme model of MPs.According to Milone et al. (2018), most less massive GCs (≾105M⊙) do not exhibit a significant helium spread (δY ~0.00–0.02, their Figure 13), but these clusters still manifest light element variations (their Table 3). Most GCs have N, Mg, and Al variations that are about half those of NGC 2808. In this case,we set an N-enrichment for 2P stars of Δ[N/Fe]=0.7 dex,and these 2P stars are depleted by Δ[C/Fe]=Δ[O/Fe]=-0.18 dex, to make the total CNO abundance constant. Their Mgdepletion is Δ[Mg/Fe]=-0.2 dex, with an Al-enrichment of Δ[Al/Fe]=+0.7 dex,as determined through visual inspection from Pancino et al. (2017). The Na-enrichment is Δ[Na/Fe]=+0.2 dex. In this case, the N-enrichment and Mgdepletion for 2P stars are half of those in NGC 2808.Using the same method,we have calculated the color differences between 1P and 2P for RGB and MS stars, which are presented in Figure 16.We find that under this case,the color differences of Mi-Mf814w(Miis the magnitude under any selected filter)are less obvious than in Case 1,as expected,but they still produce significant color differences when involving UV filter bands.The Mf343nis the most important filter band for separating 1P and 2P, which describes the depth of the NH-absorption feature. Mf275w, Mf280nand MNUVcan maximize the color difference as they measure the O-depletion.The color band like Mf343n-Mf275wis more sensitive than traditional optical colors(e.g., V-I).
In summary, multi-band photometry of the MCI/CSST involving these key filters is crucial for determining detailed abundance variations between different stellar populations.
4. Discussion
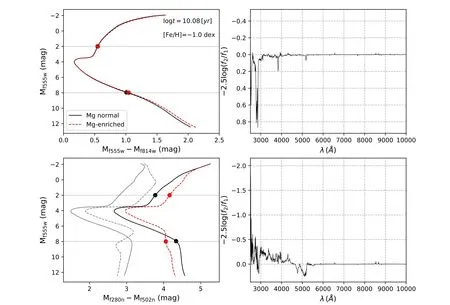
Figure 10.Same as Figure 7,but for normal and Mg-rich populations.In right panels we present the magnitude difference spectra between normal and Mg-rich RGB(top) and MS (bottom) stars (f2 and f1 are fluxes of 2P and 1P stars respectively).
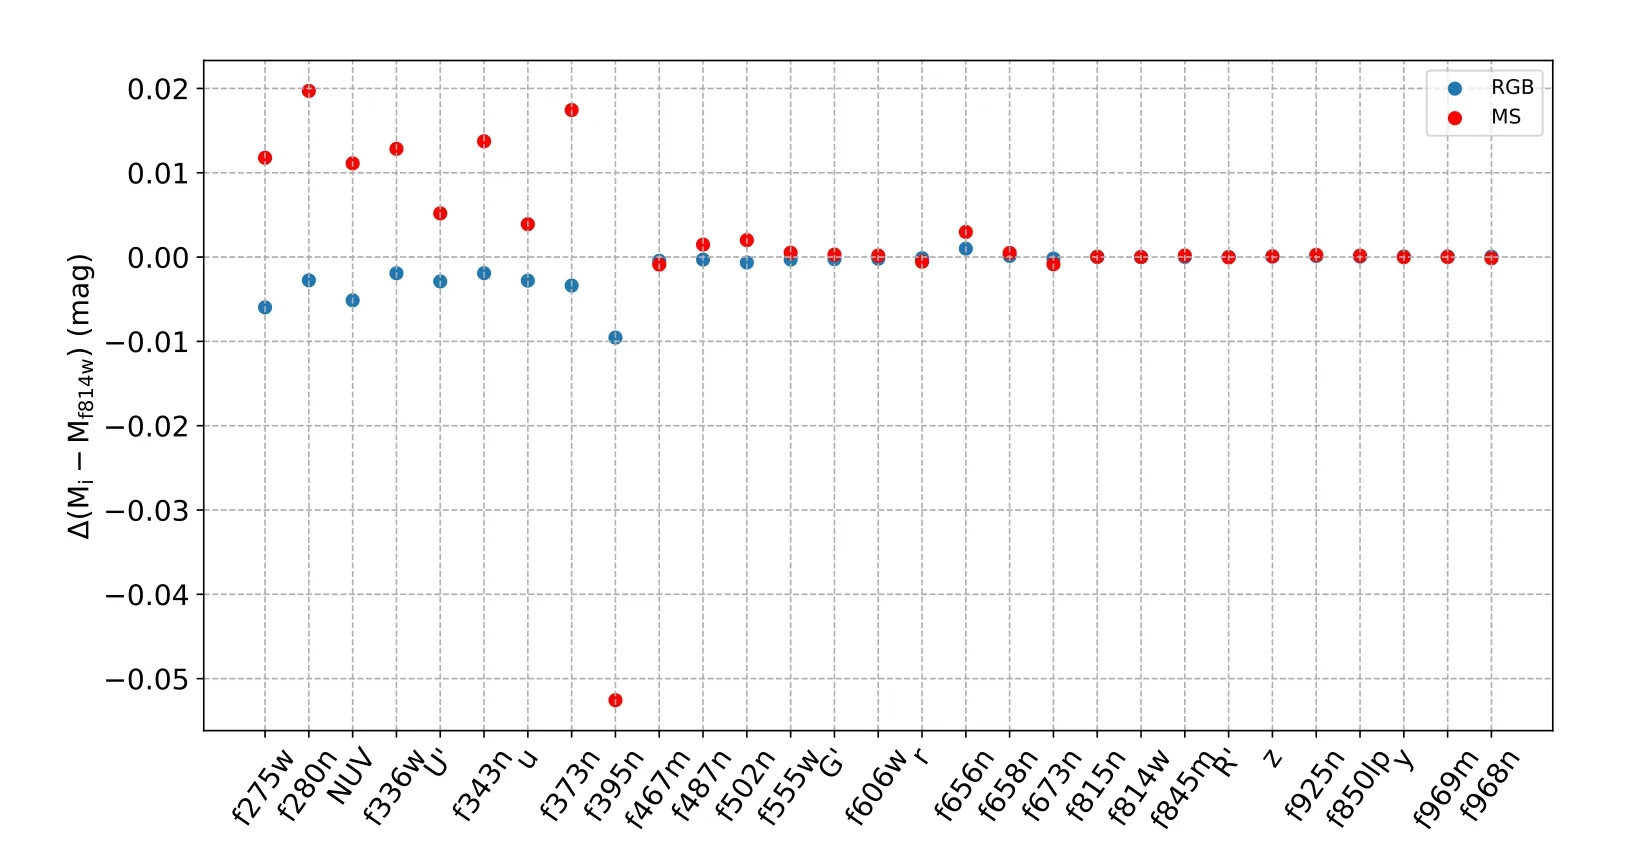
Figure 11. Same as Figure 5, but for normal and Al-rich populations.
In this work we study the photometric patterns of MP chemical variations on synthetic magnitudes of the MCI/CSST filter system. We studied five cases, including He variation,CO-depletion and N-enrichment,Na-enrichment,Mg-depletion and Al-enrichment, two cases with different chemical patterns similar to the GC NGC 2808(with/without He variation), and one less extreme case which better represents many other GCs.We find that colors involving various UV filters are well suited to separating MPs with different He, C, N, O and Mg abundances, but are not suitable for Na and Al variations. We find that the filter CSST-f343n is essential for deriving CNO variations. The color band involving the CSST-f280n filter is optimal for separating MPs with different Mg abundance. The performances of these filters are similar to their counterparts in the UVIS/WFC3 HST photometric system. Considering the exposure time requirement, we suggest that wide filter bands such as CSST-f275w, CSST-NUV and CSST-u can be used for studying MPs in star clusters.
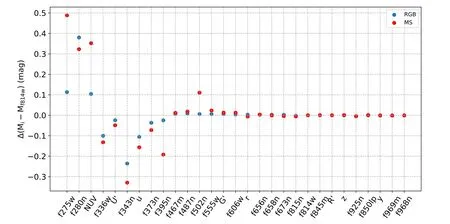
Figure 12. Same as Figure 5, in this figure, the 2P have variations in the C, N, O, Na, Mg and Al elements, as defined in Table 2 (Case 1).
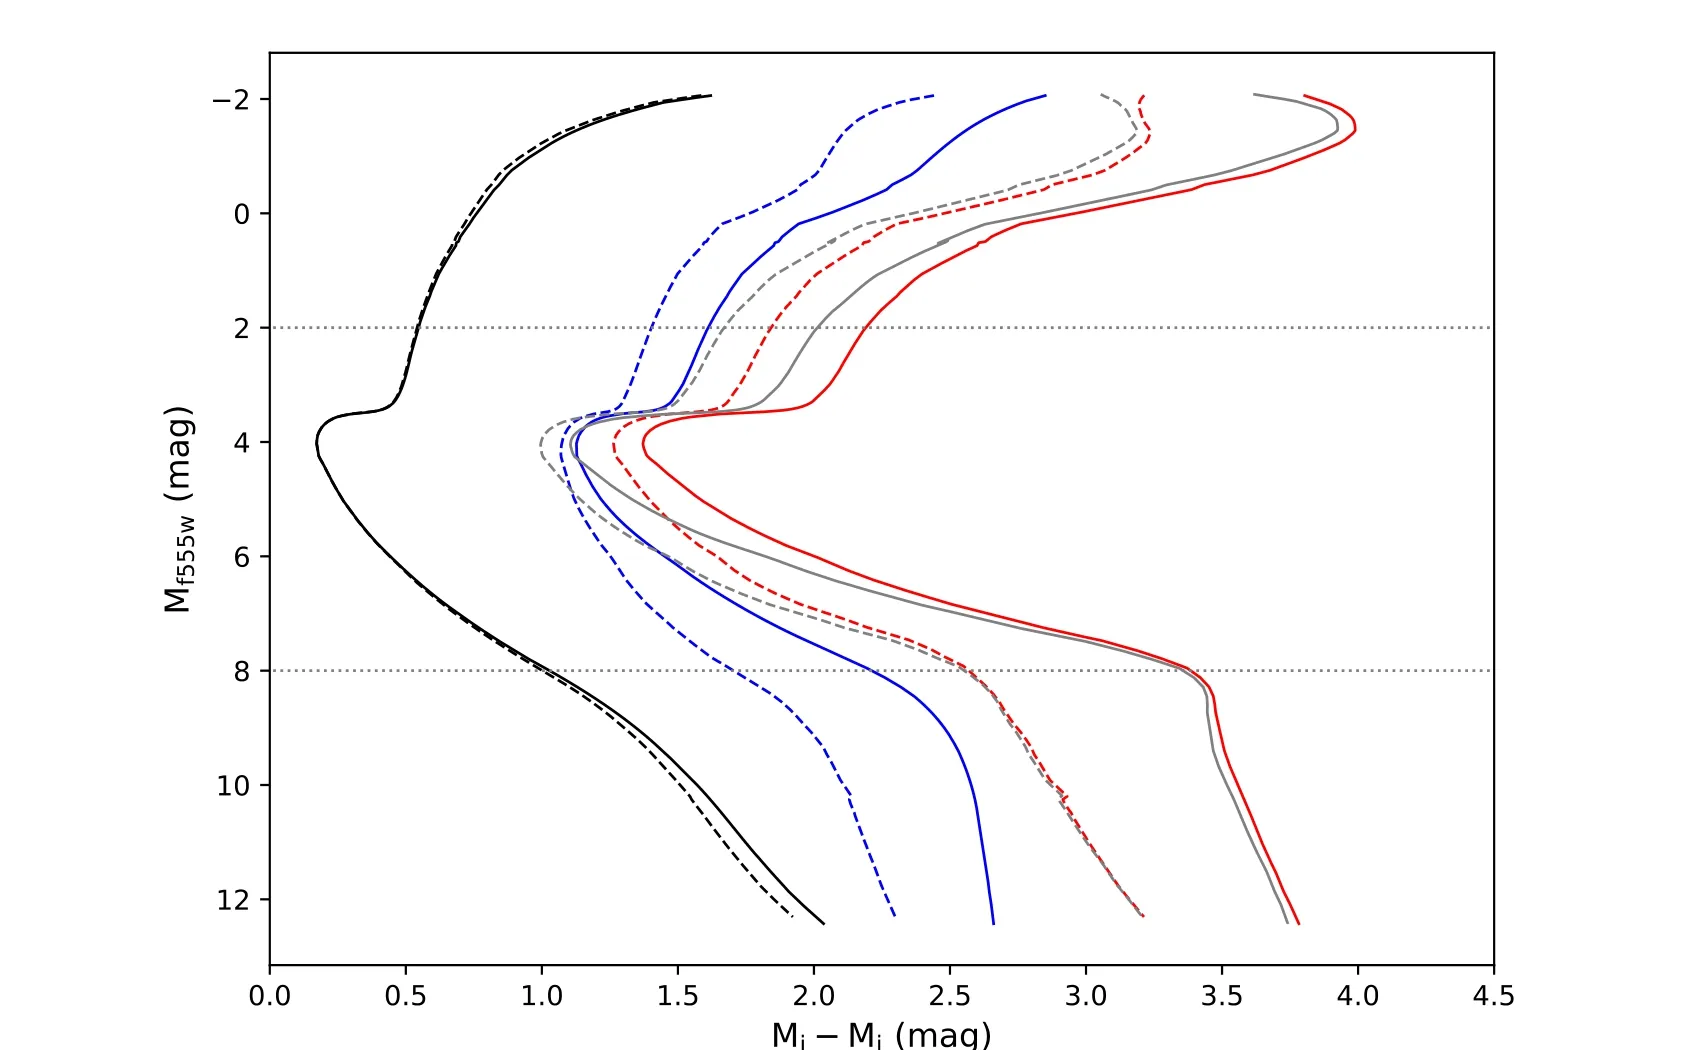
Figure 13.Loci of 1P and 2P(Case 1)in different color bands(black:Mf555w-Mf814w;blue:MNUV-Mu;red:Mf275w-Mf343n;gray:MF275W-MF343N,for HST).The solid and dashed lines represent 1P and 2P stars respectively.
Although currently simulated artificial images for MCI/CSST observations are not available, it is useful to have a preliminary evaluation of whether one can disentangle MPs with MCI/CSST at a typical distance of GCs.We make use of the online CSST exposure time calculator(ETC)for the MCI,17http://etc.csst-sc.cn/ETC-nao/etc.jspto study if we can resolve the referenced RGB and bottom MS stars at the distance of NGC 2808 ((m-M)0~15.6 mag,Kunder et al. 2013) in given color bands. For two RGB stars(mf555w=Mf555w+15.6=17.6 mag), we adopt one exposure,with a total exposure time of ~300 s,while for the bottom MS stars(mf555w=Mf555w+15.6=23.6 mag),we set a total of 18 exposures with an exposure time of 300×180=54,000 s(With this exposure time, the SNR for CSST-f814w at the bottom MS is roughly the same as the SNR at the RGB phase with 300 s exposure time.). For a selected filter, the ETC will return its SNR under a given exposure time. If the resulting SNR is four times the minimum requirement for disentangling MPs, we identify the filter as suitable (marked by asterisks in Tables 3 and 4). We find that using MCI/CSST to resolve NGC 2808-like MPs at the bottom MS is feasible through specific color bands (i.e., MNUV-Mf814w).
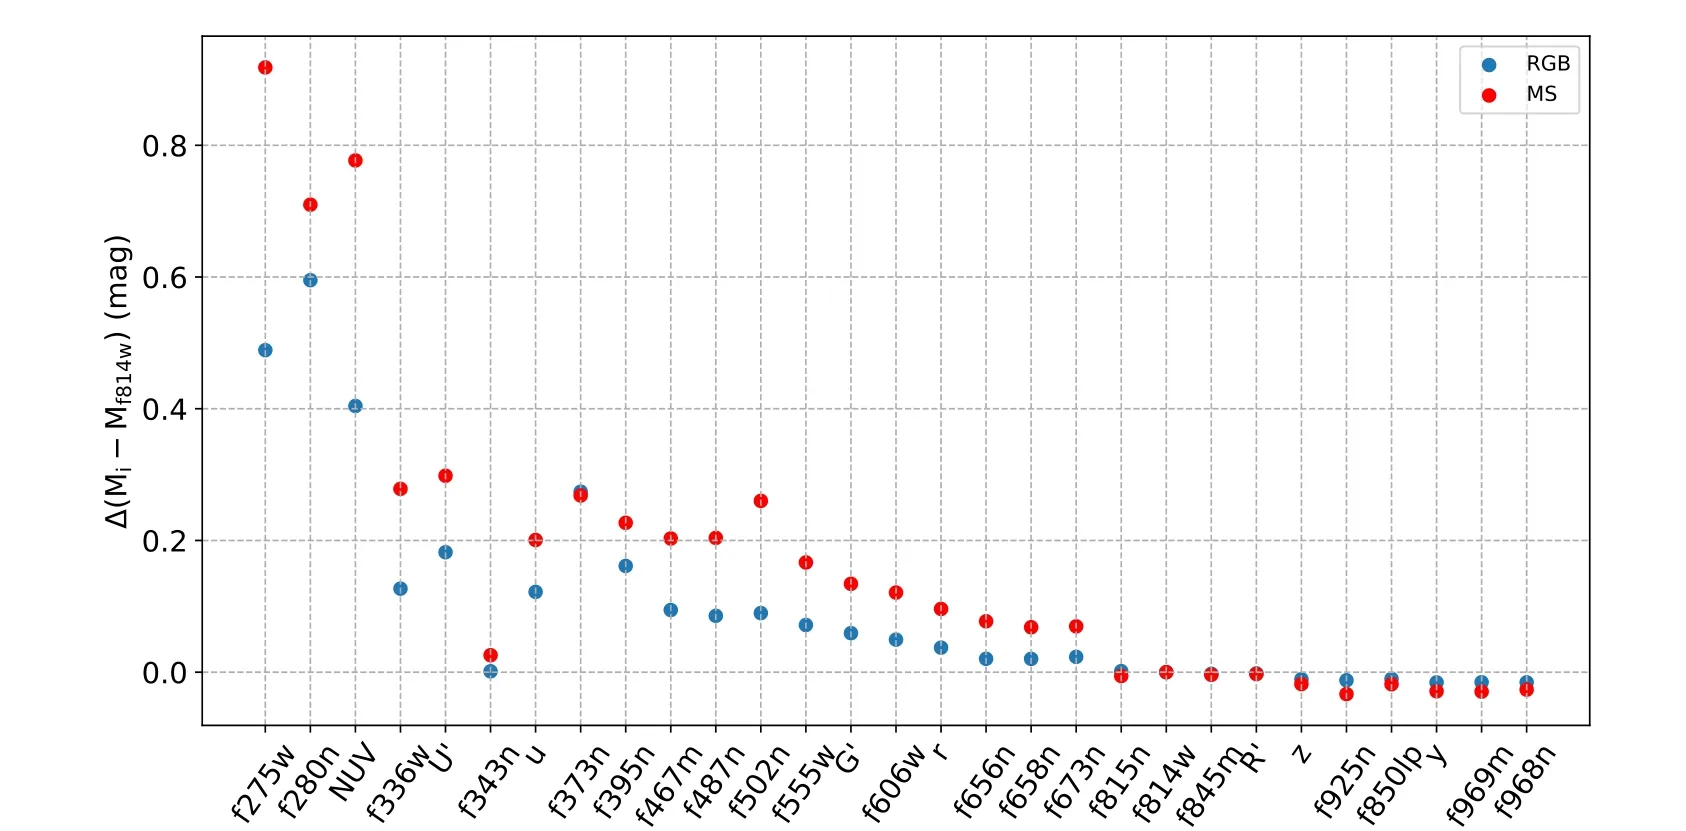
Figure 14. Same as Figure 5, but in this figure, the 2P have variations in the He, C, N, O, Na, Mg and Al elements, as defined in Table 2 (Case 2).

Figure 15.CMDs of 1P(black solid line),2P(Case 2,red dashed line)and He-rich population(without other element variations,black dashed line),in the color bands of Mf343n-Mf814w (left) and Mf280n-Mf814w (right).

Figure 16.Same as Figure 5,but for a less extreme case(Case 3),as defined in Table 2.As a comparison, the Case 1 color differences are plotted by red(MS)and blue (RGB) dashed lines.
Of course, the real CSST observations will be definitely somehow different from what we have evaluated in this work.For example,although Tables 2 and 3 report that the color band of Mf555w-Mf814wcan disentangle MPs with different CNO abundances, their color differences are only Δ(Mf555w-Mf814w)~0.006 mag. Such a small color difference can be easily contaminated by unresolved binaries, blending, differential reddening and point-spread function (PSF) fitting residuals. Because of this, a suitable filter does not mean an optimal selection for studying MPs with certain chemical patterns. Anyhow, our analysis definitely shows that MCI/CSST will be a powerful tool for studying MPs in GCs. This work can serve as guidance for arranging future MCI/CSST observations, such as the choice of filter sets and benchmark GCs.
Acknowledgments
This work was supported by the National Natural Science Foundation of China (NSFC, Grant No. 12073090), and the China Manned Space Project with NO.CMS-CSST-2021-A08,CMS-CSST-2021-B03. We thank Dr. Licai Deng for expertly commenting on the paper. We thank Dr. Yang Chen for calculating bolometric corrections.
 Research in Astronomy and Astrophysics2022年9期
- Research in Astronomy and Astrophysics的其它文章
- The Quasar Candidate Catalogs of DESI Legacy Imaging Survey Data Release 9
- A Photometric Study of Two Contact Binaries:CRTS J025408.1+265957 and CRTS J012111.1+272933
- Investigating the UV-excess in Star Clusters with N-body Simulations:Predictions for Future CSST Observations*
- A Catalog of Molecular Clumps and Cores with Infall Signatures
- Detection of 16 Small Glitches in Nine Pulsars
- Investigations of Thermal Deformation Based on the Monitoring System of Tianma 13.2m VGOS Telescope
