
Species richness patterns and the determinants of larch forests in China
2022-10-12 06:48:28WenJingFangQiongCaiQingZhaoChengJunJiJiangLingZhuZhiYaoTangJingYunFang
植物多样性 2022年5期
Wen-Jing Fang , Qiong Cai , Qing Zhao , Cheng-Jun Ji , Jiang-Ling Zhu ,Zhi-Yao Tang ,**, Jing-Yun Fang ,*
a School of Ecology and Environmental Science, Yunnan University, Kunming 650091, China
b Department of Ecology,College of Urban and Environmental Sciences,and Key Laboratory for Earth Surface Processes of the Ministry of Education,Peking University, Beijing 100871, China
A B S T R A C T Larch forests are important for species diversity, as well as soil and water conservation in mountain regions. In this study, we determined large-scale patterns of species richness in larch forests and identified the factors that drive these patterns. We found that larch forest species richness was high in southern China and low in northern China, and that patterns of species richness along an elevational gradient depend on larch forest type. In addition, we found that patterns of species richness in larch forests are best explained by contemporary climatic factors. Specifically, mean annual temperature and annual potential evapotranspiration were the most important factors for species richness of tree and shrub layers, while mean temperature of the coldest quarter and anomaly of annual precipitation from the Last Glacial Maximum to the present were the most important for that of herb layer and the whole community. Community structural factors, especially stand density, are also associated with the species richness of larch forests. Our findings that species richness in China's larch forests is mainly affected by energy availability and cold conditions support the ambient energy hypothesis and the freezing tolerance hypothesis.
Keywords:Biodiversity Community structure Determinants Geographic pattern Larch forest Species richness
1. Introduction
Species diversity is critical for forest ecosystem stability and sustainability, and research on species richness has produced important insights into the mechanisms that regulate general patterns of biodiversity (Brown, 2014; Kinlock et al., 2018; Zhong et al., 2021). One key goal of research on biodiversity is identifying the factors that drive species richness, especially in forests,one of the most important terrestrial ecosystems(Fang et al.,2012;Wu et al., 2014; Liang et al., 2016). Accordingly, ecologists have identified several patterns of species richness in plants (e.g., latitudinal, elevational, and longitudinal gradients) (Feng, 2008; Liu et al., 2015; Lü et al., 2018) and factors that influence these patterns (e.g., forest structure and climate) (Hakkenberg et al., 2016;Chu et al., 2019). However, understanding large-scale patterns of species diversity and the factors that drive these patterns remains a major challenge in ecology (Brown, 2014; Kinlock et al., 2018;Zhong et al., 2021).
Various hypotheses have been proposed to explain the patterns of species diversity. For example, the ambient energy hypothesis posits that species diversity is regulated by energy availability, represented by the mean annual temperature and annual potential evapotranspiration (Turner, 2004; Allen et al.,2007). The freezing tolerance hypothesis suggests that species diversity increases with winter temperature, mean temperature of the coldest month,or annual extreme low temperature(Currie et al., 2004; Wang et al., 2009a). The water-energy dynamic hypothesis suggests that species diversity is determined jointly by water-energy interaction, which is commonly described by the actual evapotranspiration (O'Brien, 1993; Kreft and Jetz, 2007;Wang et al., 2009a). The habitat heterogeneity hypothesis states that high habitat heterogeneity permits greater species coexistence (Kerr and Packer,1997; Jetz and Rahbek, 2002). Finally, the historical climate hypothesis stipulates that species diversity,especially the diversity of endemic species,is influenced by longterm climatic stability across the Quaternary, as evaluated by the anomaly and velocity of present and past climate (Araújo et al.,2008; Sandel et al., 2011; Harrison and Noss, 2017). In fact, the large-scale patterns of species richness are likely regulated jointly by many factors and processes (Whittaker et al., 2001; Jetz and Rahbek, 2002; Kreft and Jetz, 2007), and these hypotheses are not mutually exclusive (Kreft and Jetz, 2007).
Larch (LarixMill.) plants refer to 11-13 deciduous needle species belonging to Pinaceae,are widely distributed in the alpine and subalpine regions of the northern hemisphere, and form typical mountain deciduous coniferous forests(Farjon,2010;Yang et al.,2017).According to the relative size between bract and seed scales,Larixspecies are divided into two groups, i.e., Sect.Larixand Sect.Multiseriales.In China,species of the Sect.Larix(i.e.,Larix gmelinii,L.gmeliniivar.principis-rupprechtii,Larix kaempferi,Larix olgensis,Larix sibirica) are mainly distributed in the mountain regions of North China, whereas those of the Sect.Multiseriales(i.e.,Larix griffithii,Larix himalaica,Larix kongboensis,Larix mastersiana,Larix potaninii,L. potaniniivar.australis,L. potaniniivar.chinensis,Larix speciosa) are mainly distributed in the mountain regions of Southwest China and the alpine regions of the Tibetan Plateau (Cheng and Fu,1978; Liu et al., 2002). Studies have indicated that hotspots of conifers richness occur in mountainous areas within the broader regions of long-term climate stability and the most widespread conifers broadly follow paleoclimate and contemporary temperature gradients (Sundaram et al.,2019;Sundaram and Leslie,2021).Although patterns of species richness have been examined in a few specific larch forest types (Wang et al., 2009b; Fang et al., 2019), large-scale patterns of species diversity in larch forests and the factors that determine these patterns remain unclear.
In this study, we used data gathered from fieldwork to characterize patterns of species richness in larch forests in China and examined the factors that drive these patterns.We aim to answer the following questions about larch forests in China: (1) what is the distribution of species richness? (2) what are the dominant factors that drive patterns of species richness? (3) which hypothesis is more suitable for explaining the species richness patterns?
2. Material and methods
2.1. Study sites
We investigated 483 larch forest plots (each plot with an area of 600 m2)distributed between 85.14 and 130.84°E longitude,27.1 and 52.86°N latitude, and between elevations of 125 and 4399 m(Table 1; Fig. 1). We defined a forest as a larch forest when the number of larch individuals was no less than 3 and the relative basal area of larches was no less than 25%. For each plot, geographic and topographic information were recorded, and species from the tree,shrub, and herb layers (each layer was identified by the life form of plants) were identified. The height and diameter at breast height(DBH)of each tree were recorded.For detailed methods of the field investigation, please see the protocols of Fang et al. (2009). In total,we investigated thirteen larch forest types(Table 1,a larch forest type is determined by the dominant larch species).All larch forests were natural forests without any human disturbance except theL.kaempferiforest, which is a non-native species but planted extensively in China.AlthoughL.kaempferiforest plots were planted,these forests were otherwise relatively undisturbed by human activity.

Table 1 The distribution ranges, climatic conditions, importance value of larch trees, and community structure for different larch forest types in China.
2.2. Calculation of community structure and species richness
For each plot,we calculated three community structural indices:average DBH (Da, cm), average height (Ha, m) and stand density(Density, stem ha-1, Eq. (1)) (Meng, 2006).In Eq. (1),α denotes slope of a plot.

Species diversity of larch forests was expressed by species richness(plant species number of a plot).For this study,the species richness of different layers and the whole community were based on an area of 600 m2.
2.3. Environmental data
Slope and aspect were used as topographic indices, and aspect data was divided into discrete levels(see Shen et al.,2015 for details).
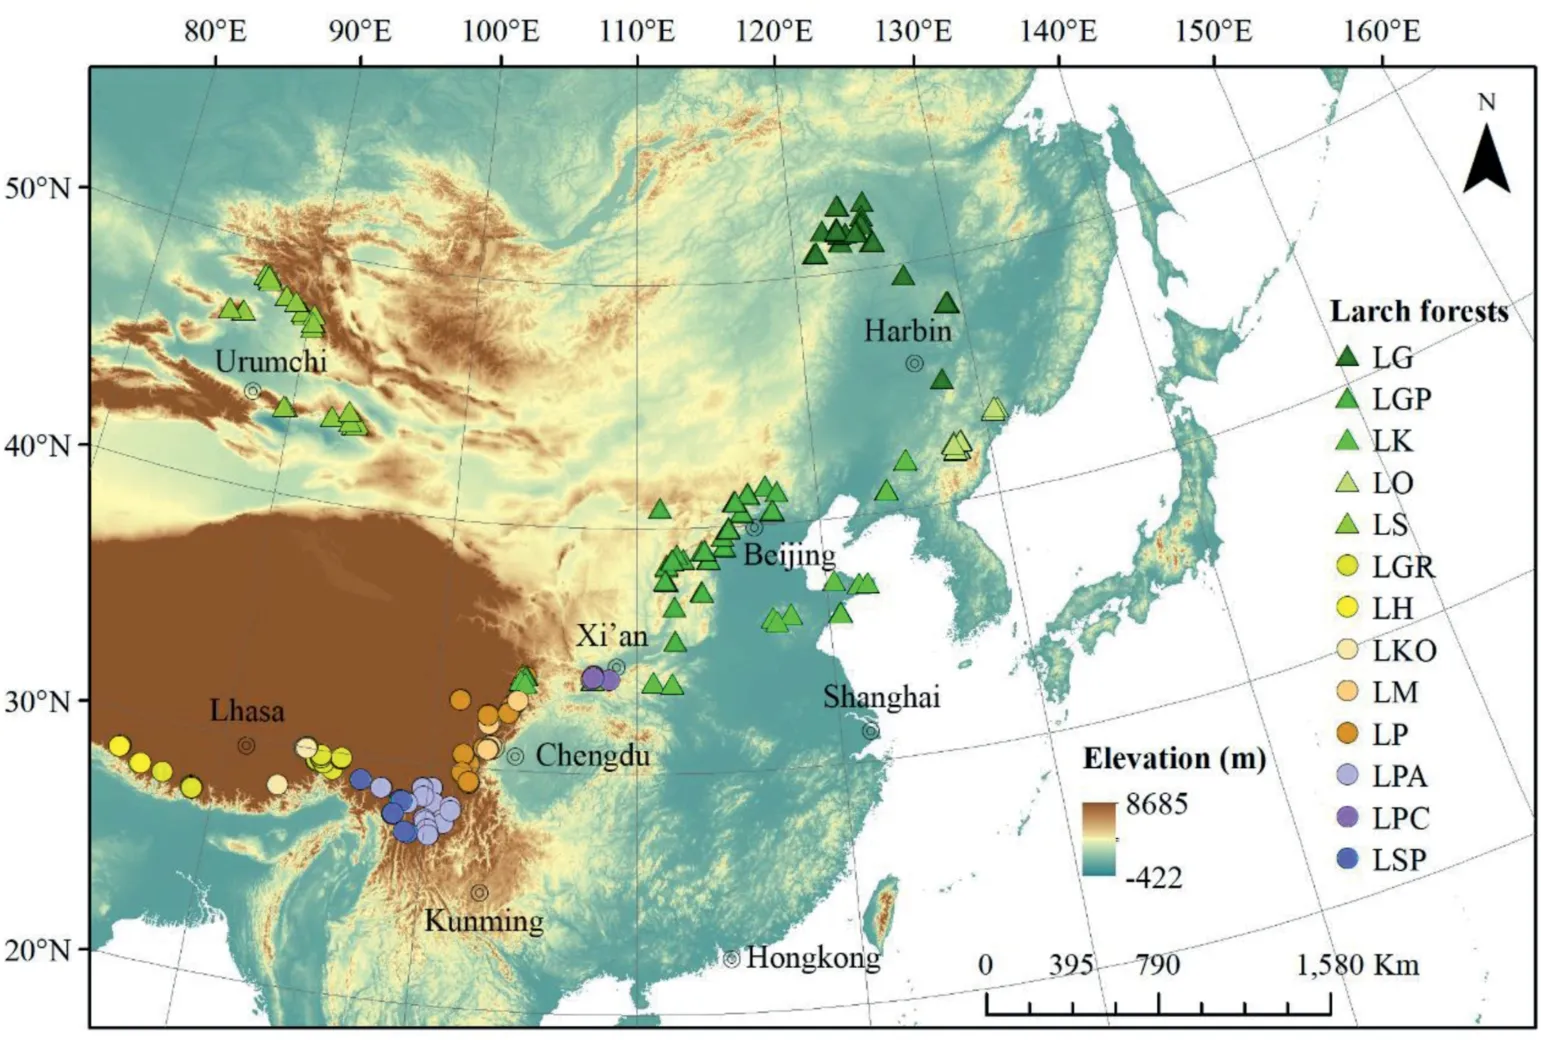
Fig.1. The larch forest sites investigated in this study. Triangles indicate plots dominated by species from the Sect. Larix (Sect. Larix forests hereafter) and circles indicate plots dominated by species from the Sect.Multiseriales(Sect.Multiseriales forests hereafter).LG,L.gmelinii forest;LGP,L.gmelinii var.principis-rupprechtii forest;LK,L.kaempferi forest;LO,L. olgensis forest; LS, L. sibirica forest; LGR, L. griffithii forest; LH, L. himalaica forest; LKO, L. kongboensis forest; LM, L. mastersiana forest; LP, L. potaninii forest; LPA, L. potaninii var.australis forest; LPC, L. potaninii var. chinensis forest; LSP, L. speciosa forest.
Contemporary climatic data was extracted from the World Climate Database with a spatial resolution of 30 arc seconds(http://www.worldclim.org) and the Global Potential Evapo-Transpiration Climate Database with a spatial resolution of 30 arc seconds(http://www.csi.cgiar.org).According to the longitude and latitude of each plot, we extracted monthly mean temperature (MMT,°C), monthly precipitation (MP, mm), and annual potential evapotranspiration (APE, mm) from the above two databases. Based on MMT and MP, we calculated the following climatic indices: mean annual temperature (MAT,°C), mean temperature of the coldest quarter(MTCQ,°C),mean temperature of the warmest quarter (MTWQ,°C), annual precipitation (AP,mm), precipitation of the wettest quarter (PWQ, mm) and precipitation of the driest quarter (PDQ, mm).
For paleoclimatic data, we extracted MAT and AP of the Last Glacial Maximum (about 22,000 years ago, LGM) under the MPIESM-P scenario from the World Climate Database with a spatial resolution of 2.5 arc minutes (http://www.worldclim.com/pale oclimate1). Using contemporary annual values minus LGM annual values, we calculated two paleoclimatic factors: the anomaly of MAT from LGM to the present(Anomaly.MAT) and the anomaly of AP from LGM to the present(Anomaly.AP) (Araújo et al., 2008).
2.4. Statistical analyses
We compared species richness in the tree,shrub,and herb layers and the whole community among different larch forest types and between two larch forest groups by analysis of variance and multiple comparisons with the Bonferroni test.
We used standard major axis regression (SMA) to fit the relationships between species richness in larch forests and fourteen factors that may drive species richness patterns in the tree,shrub,and herb layers, as well as the whole community. The fourteen factors included seven contemporary climatic factors (i.e., MAT,MTCQ, MTWQ,AP, PWQ,PDQ, and APE), two paleoclimatic factors(i.e., Anomaly.MAT and Anomaly.AP), two topographic factors (i.e.,slope and aspect),and three community structural factors(i.e.,Da,Ha, and Density). Following the results of SMA, we removed some variables that did not satisfy the t-test thresholds (criteria:pvalue <0.1) from original models(including all factors)(Table S1).Then, we limited collinearity issues among variables by further removing variables with a variance inflation factor >5(Wang et al.,2021). In this process, similar variables, such as temperature variables, were selected into the models based on biggerR2of SMA(Tables S1 and S2). Using the all-subsets regression to estimate all models from the remaining variables with adjustedR2,we obtained several models with the largest adjustedR2(Fig.S1).Comparing the Akaike information criterion (AIC) of those models fitted by the general linear model (GLM) allowed us choose the best models,which we defined as those with a lower value of AIC and more factor categories (Table S3). The exploratory powers of different variables of the best models for each layer and overall species richness of larch forests were calculated based on analysis of variance (ANOVA).
For each best model of species richness in the tree, shrub, and herb layers and the whole community of larch forests,we used the method of variation partitioning to separate the explanatory powers of contemporary climatic, paleoclimatic, topographic, and community structural factors. We used SMA to determine geographic patterns of species richness and the relationships between patterns of species richness and the potential factors that underlie these patterns factors. All analyses were performed in R 4.0.0 (Development Core Team, 2020) with the “raster” and“extract” functions of “raster” package, “sma” function of “smatr”package, “vif” function of “car” package, “regsubsets” function of“leaps”package and“varpart”function of“vegan”package(Warton et al., 2012; Fox and Weisberg, 2019; Oksanen et al., 2019; Lumley and Miller, 2020; Hijmans, 2020).
3. Results
3.1. Species richness of larch forests
The plot-based mean species richness of tree, shrub, and herb layers were 4.2 ± 3.1(mean ± standard deviation, species/600 m2,similarly hereinafter),10.5±6.9,and 24.6±13.3,respectively,with a total of 37.1 ± 17.6 (Table S4; Fig. 2). Species richness differed significantly across forest types and was higher in the Sect.Multiserialesforests than in the Sect.Larixforests (Fig. 2).
For the tree layer, the species richness was higher in theLarix mastersianaforest(8.2±3.6 species/600 m2,similarly hereinafter)than in all types of the Sect.Larixforests except for theL. olgensisforest(5.8±3.9),while species richness was lower in theL.sibiricaforest(2.1±1.0)than in all other forest types(Table S4;Fig.2a).For the shrub layer,species richness was higher in theL.griffithiiforest(15.4 ± 5.0) than in theL. gmelinii(9.0 ± 5.0),L. gmeliniivar.principis-rupprechtii(6.7 ± 6.1),L. sibirica(4.2 ± 3.1),L. himalaica(8.0 ± 2.3) andL. potaniniivar.chinensisforests (7.6 ± 3.7), while was lower in theL. sibiricaforest than in all other forest types(Table S4; Fig. 2b). For the herb layer and the whole community,species richness was higher in theL.mastersianaforest(36.6±11.1)than in theL. gmelinii(17.8 ± 11.6),L. gmeliniivar.principis-rupprechtii(19.1 ± 11.4),L. kongboensis(26.1 ± 16.2) andL. specioseforests(19.8±8.1),while lower in theL.gmeliniiandL.gmeliniivar.principis-rupprechtiiforests than in theL. griffithii(27.7 ± 12.1),L.mastersiana,L.potaninii(31.8±14.9)andL.potaniniivar.australisforests (30.2 ± 14.5) (Table S4; Fig. 2c and d).

Fig.2. Comparison of species richness in the(a)tree layer,(b)shrub layer,(c)herb layer,and(d)overall among different larch forest types.Blue and orange denote the Sect.Larix forests and the Sect. Multiseriales forests, respectively. Different letters indicate significant differences (p <0.05). Sect. L, Sect. Larix forests; Sect. M, Sect. Multiseriales forests. For other abbreviations of larch forest types, see Fig.1.
3.2. Geographic and climatic patterns of species richness
Species richness of different layers and the whole community decreased with increasing latitude(Fig.3).Both Sect.Larixand Sect.Multiserialesforests exhibited the same latitudinal patterns of species richness as that of the total larch forests (Fig. 3). Similarly,species richness of all larch forest types,except forL.kaempferiandL.griffithiiforests,decreased with elevation(Fig.S2).For total larch forests,there was not significant change of woody species richness along the elevational gradient,although the herb layer and overall species richness increased with elevation (Fig. 3). Species richness of the herb layer and the whole community in Sect.Larixand Sect.Multiserialesforests showed the opposite elevational pattern to that in total larch forests (Fig. 3).
For all different layers and the whole community, species richness increased with MAT, MTCQ, AP and APE, but decreased with Anomaly.AP(Fig.4).For both larch forest groups,the relationships between species richness and climatic factors were consistent with those of total larch forests, except for in Sect. Multiseriales forests,where the relationship between AP and species richness differed(Fig.S3).In addition,herb layer species richness was not related to MAT, AP, or Anomaly.AP for either larch forest group, except for a negative relationship between Anomaly.AP and herb layer species richness in Sect. Multiseriales forests (Fig. S3).

Fig. 3. Changes of species richness in the (a, b) tree,(c, d) shrub,and (e, f) herb layers and (g, h) overall species richness with latitude (a, c, e, g) and elevation (b, d, f, h) for larch forests in China. Sect. L and Sect. M denote plots from the Sect. Larix and Sect. Multiseriales forests, respectively.

Fig. 4. Changes in species richness of larch forests with (a) annual precipitation (AP), (b) annual potential evapotranspiration (APE), (c) anomaly of annual precipitation from the Last Glacial Maximum to the present (Anomaly.AP), (d) mean annual temperature (MAT), and (e) mean temperature of the coldest quarter (MTCQ).
3.3. Relationships between species richness and forest structures
Species richness in the tree layer was negatively related to the average DBH and height but positively related to the stand density(Fig.5).Species richness in the shrub layer decreased with average DBH but increased with stand density, respectively(Fig. 5a and c).Furthermore, species richness in the herb layer decreased with stand density(Fig.5c).Overall species richness did not change with structural factors (Fig. 5).
Species richness of the two larch forest groups changes with average DBH and stand density consistently with that of the total larch forests, with the exception of the relationships between species richness and average height (Figs. 5 and S4). Species richness of the shrub and herb layers and the whole community of the Sect.Larixforests increased with average height(Fig.S4b).Further analysis showed that the relationships between species richness and average height were also not consistent for different larch forest types (Fig. S5).
3.4. The influence of climatic, topographic, and structural characteristics on species richness
The most important factors for the species richness of larch forests were contemporary climatic factors (Table 2; Fig. 6). GLM showed that the best models explained 37.2%, 35.8%, 13.7%, and 28.0% of the variations in species richness in the tree, shrub, and herb layers and the whole community, respectively (Table 2).Contemporary climatic factors independently explained 6.6%-31.7%, paleoclimatic factors independently explained 3.0%-6.9%,community structural factors independently explained 0%-9.8%,and topographic factors independently explained 0%-0.6% of the variations in different layers and overall species richness, respectively(Fig. 6).

Fig. 5. Relationships between species richness and (a) average diameter at breast height (Da), (b) average height (Ha), and (c) stand density (density) for larch forests in China.
The contemporary climatic factors with the greatest explanatory power on species richness in different layers and the whole community were temperature-related(6.3%-16.5%)(Table 2).The most important factor for species richness of the tree and shrub layers was MAT(15.0%and 16.5%),whereas the most important factor for the herb layer and the overall species richness was MTCQ(6.3%and 14.4%) (Table 2). The second important factor for the species richness of the tree and shrub layers was APE(0.3%-5.0%)(Table 2).The explanatory power of AP(0.3%-5.0%)was very small for woody and overall species richness (Table 2). The best models included only one paleoclimatic factor, Anomaly.AP, which was the second important factor for the herb layer and the overall species richness(4.1% and 7.1%) (Table 2). The impact of topographic factors on species richness were negligible and limited to the herb layer and overall (0.9% and 0.5%) (Table 2). However, the structural factors were nonnegligible, especially for the species richness of the tree layer (5.1% and 4.5% for average DBH and stand density, respectively)(Table 2).
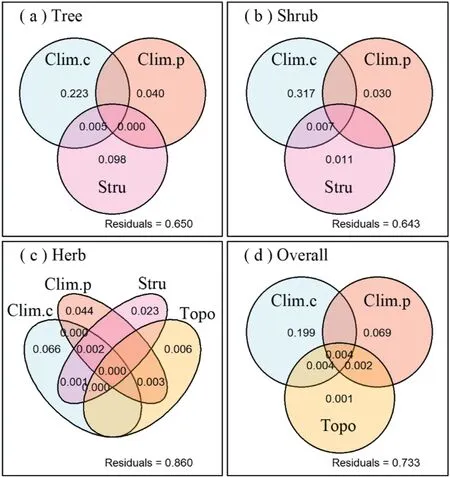
Fig.6. Variation partitioning of the influences of contemporary climatic,paleoclimatic,topographic,and structural characteristics on the(a)tree layer,(b)shrub layer,(c)herb layer, and (d) overall species richness of larch forests in China. Abbreviations: Clim.c,contemporary climatic factors;Clim.p,paleoclimatic factors;Topo,topographic factors;Stru, community structural factors.

Table 2 The best regression model selected for species richness of larch forests.
4. Discussion
4.1. Larch forest types influenced geographic patterns of species richness
Consistent with previous research for other taxa (Willig et al.,2003; Feng, 2008; Kinlock et al., 2018), species richness of larch forests decreased with increasing latitude in China. However, species richness showed different elevational patterns between Sect.Larixand Sect.Multiserialesforests (Fig. 3). One possible explanation for such patterns is that Sect.Multiserialesforests are distributed at higher elevations than Sect.Larixforests,while at the same time, the species richness was higher in the Sect.Multiserialesforests than in the Sect.Larixforests;hence,species richness of total larch forests increased significantly with increasing elevation(Table 1; Figs. 2 and 3). Species richness of different larch forest types decreased monotonically with elevation, except for theL.kaempferiforests,which increased with elevation,andL.griffithiiforests, which showed a non-significant elevational pattern of species richness (Table 1; Fig. S2). Taken together, our results indicate that for larch forests in China the increase in species richness along an elevational gradient is the result of the combined effects of different larch forest types.
4.2. Relative importance of environmental and structural factors for species richness
Generally, large-scale patterns of species diversity are most influenced by climatic factors(Currie et al.,2004).Species richness of larch forests increased significantly with increasing MAT,MTCQ,AP, and APE (Fig. 4), consistent with previous studies (Gaston,2000; Wang et al., 2009b; Fang et al., 2012). In addition, our finding that temperature indices(e.g.,MAT and MTCQ)are the most important factors regulating species richness of larch forests in China is consistent with findings from previous studies on other forests types in China (Wang et al., 2009b; Wu et al., 2018). The most important factor for woody species richness of larch forests was MAT,which supports the ambient energy hypothesis;however,the most important factor for the herb layer and the overall species richness of larch forests was MTCQ, which supports the freezing tolerance hypothesis(Currie et al.,2004;Turner,2004;Allen et al.,2007; Wang et al., 2009a). The species richness of different layers and the whole community were driven by different factors,consistent with related studies (Loidi et al., 2021; Wang et al.,2021). Although energy-related factors were very important, water factors, such as AP, showed little influence on the species richness of larch forests(Table 2).That is,our results do not support the water-energy dynamic hypothesis (O'Brien, 1993; Wang et al.,2009a).
Studies on conifers have indicated the importance of historical climate for diversity (Sundaram et al., 2019; Sundaram and Leslie,2021). Similarly, we found that the second important factor for the herb layer and the overall species richness was Anomaly.AP(Table 2). Species richness in different layers and the whole community decreased significantly with Anomaly.AP, which is partly consistent with Wang et al. (2021), who found that tree species richness decreased but herb species richness increased with Anomaly.AP for plant species richness of temperate forests in Northeast China. Loidi et al. (2021) found that the contemporary climate was the main predictor of species diversity of the whole community, the tree layer, and the floor layer in temperate deciduous forests in Western Eurasia, while the shrub layer was also influenced by historical climate.This is consistent with our results,namely the explanatory powers of paleoclimatic factors for species richness of larch forests were smaller than that of contemporary climatic factors,although the paleoclimate was important for herb layer and overall species richness (Table 2; Fig. 6). That is, the historical climate hypothesis is not the most appropriate for explaining the species richness of larch forests.
Although some studies have stated the importance of topographic factors for species diversity (Kreft and Jetz, 2007; Wang et al., 2021), in our study the explanatory powers of topographic factors were negligible(Table 2;Fig.6).Our results do not support the habitat heterogeneity hypothesis (Kerr and Packer, 1997; Jetz and Rahbek, 2002).
In addition to environmental factors, community structural factors have also been shown to influence forest species richness,especially tree species richness(Hakkenberg et al.,2016;Chu et al.,2019). Our results verified that community structural factors explain more species richness in the tree layer of larch forests than in other layers (Fig. 6). Chu et al. (2019) indicated that stand abundance was a more appropriate predictor for species richness of forest trees on a global scale.Similarly,we found that stand density was not only important for the species richness of the tree layer in larch forests but also important for that of the herb layer(Table 2).
5. Conclusions
In this study, we used data gathered in the field to describe patterns of species richness in larch forests in China and identify the underlying factors that are responsible for these patterns.We found that the species richness of larch forests has distinct latitudinal and elevational patterns and that elevational patterns of species richness are dependent on larch forest type. We also found that the most dominant factors that drive patterns of species richness in larch forests in China are contemporary climate factors and that the impact of these factors varies by forest layer. Furthermore, species richness in the tree layer is influenced by community structure, whereas the herb layer and overall species richness have been affected by the paleoclimate.Our findings on species richness patterns of larch forests in China support the ambient energy hypothesis and freezing tolerance hypothesis.
Author contributions
JF designed the research; WF, QC, QZ, CJ, ZT, and JF performed the fieldwork; WF conducted the analysis; WF, ZT, JF, and all the others contributed to the writing of the manuscript.
Declaration of competing interest
The authors declare that they have no known competing financial interests or personal relationships that could have appeared to influence the work reported in this paper.
Acknowledgments
This study was supported by the National Natural Science Foundation of China (No. 31988102) and the National Science and Technology Basic Project of China (No. 2015FY210200). We thank all investigators for the field survey, the local forestry bureau for their assistance and Drs.Tian Di and Yan Zhengbing for their help in editing the manuscript.
Appendix A. Supplementary data
Supplementary data to this article can be found online at https://doi.org/10.1016/j.pld.2022.05.002.
- 植物多样性的其它文章
- GUIDE FOR AUTHORS
- Taxonomic synopsis of Berberis (Berberidaceae) from the northern Hengduan mountains region in China,with descriptions of seven new species
- Plant invasions facilitated by suppression of root nutrient acquisition rather than by disruption of mycorrhizal association in the nativeplant
- Evolutionary importance of the relationship between cytogeography and climate: New insights on creosote bushes from North and South America
- SSR markers development and their application in genetic diversity evaluation of garlic (Allium sativum) germplasm
- Mapping the habitat suitability of Ottelia species in Africa