The continuous wavelet projections algorithm: A practical spectral-feature-mining approach for crop detection
Xiohu Zho ,Jingheng Zhng,* ,Ruiling Pu ,Zif Shu ,Weizhong He ,Kihu Wu,*
a College of Artificial Intelligence,Hangzhou Dianzi University,Hangzhou 310018,Zhejiang,China
b School of Geosciences,University of South Florida,Tampa,FL 33620,USA
c Lishui Institute of Agriculture and Forestry Sciences,Lishui 323000,Zhejiang,China
Keywords:Hyperspectral Crop parameters Crop phenotyping Continuous wavelet analysis Successive projections algorithm
ABSTRACT Spectroscopy can be used for detecting crop characteristics.A goal of crop spectrum analysis is to extract effective features from spectral data for establishing a detection model.An ideal spectral feature set should have high sensitivity to target parameters but low information redundancy among features.However,feature-selection methods that satisfy both requirements are lacking.To address this issue,in this study,a novel method,the continuous wavelet projections algorithm (CWPA),was developed,which has advantages of both continuous wavelet analysis (CWA) and the successive projections algorithm (SPA) for generating optimal spectral feature set for crop detection.Three datasets collected for crop stress detection and retrieval of biochemical properties were used to validate the CWPA under both classification and regression scenarios.The CWPA generated a feature set with fewer features yet achieving accuracy comparable to or even higher than those of CWA and SPA.With only two to three features identified by CWPA,an overall accuracy of 98% in classifying tea plant stresses was achieved,and high coefficients of determination were obtained in retrieving corn leaf chlorophyll content (R2=0.8521)and equivalent water thickness (R2=0.9508).The mechanism of the CWPA ensures that the novel algorithm discovers the most sensitive features while retaining complementarity among features.Its ability to reduce the data dimension suggests its potential for crop monitoring and phenotyping with hyperspectral data.
1.Introduction
Spectroscopy can provide information about properties of objects by detecting their radiance over a spectral range,and is used to study interactions between matter and electromagnetic radiation.Given that spectroscopy can be used to analyze material characteristics,it has been exploited by physicists and chemists as an analytical tool since the early 20th century [1].Because the spectral characteristics of crops are influenced by their biophysical and biochemical characteristics,spectroscopy has become an effective tool for monitoring crop characteristics and for estimating and evaluating ecosystem parameters.Its applications include crop classification [2,3],retrieval of crop biochemical components [4-6],and detection of crop diseases and insects [7-9].Analysis of crop spectra aims to extract spectral features associated with critical characters such as species,and physiological and biochemical parameters [10,11].Currently,methods for processing spectral data comprise mainly spectral feature selection and extraction.
Spectral feature selection and dimensionality reduction in spectral analysis are made necessary by the strong correlation and high redundancy between adjacent spectral bands [12,13].In recent years,several studies have used statistical methods to select spectral features,including t-test [14],KL divergence [15],Chernoff bound [16],receiver operating characteristic (ROC) curve [17],and Wilcoxon test [18].Yuan et al.[19] characterized the spectral response of tea plant anthracnose by combining spectral-ratio analysis and independent t-test to identify spectral bands that were sensitive to the disease.The method could eliminate differences in leaves and illumination circumstances and thereby increase the difference between healthy and diseased samples.
Given the high correlation generally present among spectral bands and the inability of sensitivity analysis to eliminate crosscorrelation among features,many methods focusing on reducing information redundancy among spectral features have been proposed to achieve the optimization of the selected feature set.They include the branch and bound method[20],regression coefficients[21],maximum relevance minimum redundancy [22],uninformative-variable elimination [23],mutual information feature selection[24],genetic algorithms[25],and the successive projections algorithm(SPA)[26].Among them,the SPA is particularly ideal for optimizing spectral band features.Starting from one band,the SPA applies projection operations in vector space to gradually add new bands,mining spectral feature combinations with low collinearity to avoid information redundancy among bands[27,28].
In contrast to spectral band selection,spectral feature extraction aims to excavate information hidden in a spectrum by applying a linear or nonlinear transformation of the original spectral bands.Common spectral feature extraction methods may include spectral derivatives[29],continuum removal analysis[3],and vegetation index [12],which are associated with various absorption and reflectance characteristics of crop biochemical properties and/or physiological status [30,31].Such approaches as principal component analysis [32],independent component analysis [33],and linear discriminant analysis [34] also attempt to project spectral data into a feature space to extend the scope and depth of the exploration of spectral features.For detecting crop disease and insects,Shahin et al.[35]and Sinha et al.[36]found that a combination of spectral bands selected based on principal component analysis produced the similar accuracy as using the full spectrum.
The continuous wavelet analysis(CWA)is an advanced spectral analysis method that has been introduced for interpreting plant spectral signals.The CWA is able to decompose the spectral signal on a continuous scale and wavelength to capture not only spectralintensity but spectral shape information.The wavelet features at multiple scales allow simultaneous extraction not only of global but local spectral features,thereby achieving the deep mining of the spectral signals [37-39].In feature selection with CWA,a threshold criterion is usually applied to identify sensitive features.Cheng et al.[37] used the coefficient of determination (R2) as a standard to select the top 1% of the features as the preferred feature set.Using the statistic P-value=0.01 as a threshold,Zhang et al.[38] divided the wavelet coefficient matrix into several regions to select the feature at the center of the region as the preferred feature set.Tian et al.[39] used a machine learning algorithm to test wavelet features,and selected the top 5% of features as the preferred feature set based on the overall accuracy(OA).However,it should be noted that such a feature selection method based on sensitivity ranking is often plagued by information redundancy between features.
In some tasks in crop phenotyping and monitoring,an ideal spectral feature set should have high sensitivity to target parameters but low information redundancy among features.Feature selection methods in spectral signal processing that can satisfy both requirements are lacking.Achieving deep mining of key information in spectrum and reducing redundant information at the same time would increase the practical capacity of spectral analysis.Motivated by these challenges,we pursued two research goals in this study:(1)based on both the CWA and the SPA,to develop a novel method,the continuous wavelet projections algorithm (CWPA),for generating optimal spectral feature set with sensitivity and complementarity for crop detection;and (2)to evaluate its performance in multiple crop detection and monitoring scenarios by comparing the CWPA with CWA and SPA feature-based models (hereafter abbreviated as respectively the CWPA,CWA,and SPA models,).
2.Materials and methods
2.1.Principle of CWA
CWA uses a continuous wavelet transform to decompose a reflectance spectrum by continuous scaling and shifting to obtain a wavelet coefficient spectrum,and then either extracts key components (wavelet features) or constructs an energy feature vector[40].In comparison with commonly used spectral indices,the wavelet features reflect information mainly about the spectral shape,as opposed to just the intensity of spectral bands [37].A continuous wavelet transform decomposes the reflectance spectrum into wavelet coefficients at multiple scales.Matching the spectral curves with the scaled and shifted wavelet basis function generates sensitive wavelet features.Features at low scale correspond to high-frequency spectral variation(microscopic characteristics),whereas features at high scale correspond to low-frequency spectral variation (macroscopic characteristics).CWA uses a mother wavelet function to decompose the continuous wavelets of an original spectrum.A mother wavelet function is.

where a is a scaling factor describing the width of the wavelet and b is a shifting factor describing the wavelet position.An original spectrum can be transformed into a set of power coefficients as follows:

where f(λ )(λ=1,2,...,n,where n is t he number of wavelengths)is the spectrum,and the coefficients...,n) constitute a two-dimensional scalogram with one dimension representing the decomposition scale and the other the wavelength.Because the shape of the absorption bands of a plant spectrum approaches the shape of the quasi-Gaussian function (the Mexican Hat wavelet) [41],it was used as the mother wavelet in this study.To simplify the wavelet transformation analysis,the decomposition scale was restricted to 2i(i=0,1,2,...,10),which has been shown[37,42] sufficient for the selection of wavelet features.Studies[22,43]have shown that the number of features affects model accuracy.Accordingly,for the CWA model,it was decided to retain the top 1%,5%,and 10% of features based on sensitivity,and then uses eight neighborhood searches for independent feature regions and finally selects the extreme values of each region as the optimal wavelet feature set.
2.2.Principle of SPA
The SPA is a forward-selection method that uses projections in a vector space to minimize variable collinearity.SPA starts with a first wavelength k(0)and then incorporates a new one at each iteration until a specified number N of wavelengths is reached.If N and k(0)are not known a priori,all candidates are considered and combined with a regression or classification model to find optimum values of N and k(0).See Araujo et al.[27]for a detailed introduction to the algorithm.
2.3.Development of CWPA
The CWPA is a single-layer feedback feature-selection algorithm for generating optimal feature set from given spectra.The main steps are as follows:
Step 1: Use CWA to decompose the original sample spectra(sample s,band b) and generate wavelet coefficient matrices (W1,W2,...Wn),which is a 3D wavelet feature matrix (sample s,band b,scale n).
Step 2: Fuse the wavelet features of multiple decomposition scales by reshaping the wavelet feature matrix to a 2D matrix(sample s,band b × scale n) named WF.
Step 3: Use SPA to generate b × n feature sets for WF under a given number of features.
Step 4: Perform ANOVA (corresponding to the classification model) or correlation analysis (corresponding to the regression model) for all features in each feature set and calculate the mean P-value or R2,respectively.The feature set corresponding to the smallest P-value or the largest R2is then assigned as the optimal feature set.
Step 5: Select a number of features in a given range (1-m) in turn and repeat steps 2-4 to obtain the optimal feature sets (F1,F2,...,Fm) with the given number of features.
Step 6: Based on the optimal m feature sets,calibrate the classification or regression model under different numbers of features,and calculate the OA or R2for classification and regression models,respectively.By comparison of accuracies under several numbers of features,the feature set with the highest OA or R2is then eventually assigned as the optimal feature set.
In contrast to a conventional feedback strategy based on model accuracy,the CWPA adopts the results of sensitivity analysis to filter the feature sets,thereby greatly reducing the computational complexity of the algorithm.The workflow of the CWPA is illustrated in Fig.1.
The feature sets selected by the three algorithms (CWA,SPA,and CWPA) were fed into machine learning algorithms to build classification or regression models.The random forest (RF) and naive Bayes (NB) algorithms were used to establish classification models.As an integrated learning method,RF is advantageous for processing high-dimensional and unbalanced datasets,and thus generates more accurate results and handles overfitting more efficiently than the constituent models [44,45].The NB has a simple structure,provides accurate predictions,and has been used in various fields during the past few decades [46,47].For the regression model,multiple linear regression was adopted for model establishment [27,48].For the SPA and CWPA models,the number of features (NF) ranged from 1 to 100 for subsequent analysis.
2.4.Evaluation of models
For model evaluation,the OA were used for evaluating classification models,whereas R2and root mean square error (RMSE)were used for evaluating the regression models.Considering that the NF is also associated with the operating efficiency of the algorithms,the NF was also used in this study as an indicator of model quality (Fig.2).All statistical analysis and modeling were performed with MATLAB software (MathWorks Inc.,Natick,MA,USA).
2.5.Experimental spectral datasets
The CWPA was tested and its performance was compared with CWA and SPA using three datasets under both classification and regression scenarios(Fig.2).A spectral dataset of tea plant stresses(TEASPEC) and a corn leaf spectral dataset of corn leaf pigments(CORNSPEC) was collected to test the model performance in classification and regression scenarios,respectively.To further verify the robustness of the algorithm,a plant leaf spectral dataset of optical biochemical properties (LOPEX) containing 45 plants was used to test the model performance in a regression scenario.Each dataset was randomly divided into a calibration subset(60%)and a validation subset (40%) to allow independent model validation(Table 1).

Table 1 Details of datasets used in this study.
2.5.1.Spectral dataset of tea plant stresses (TEASPEC)
TEASPEC is a leaf spectral dataset that includes three types of tea plant stress: tea green leafhopper (GL),anthracnose (AH),and sunburn (BR).Because these common stresses are easily confused in the tea garden,this dataset was collected by our research team for selecting spectral features and developing detection models.The experiment was conducted at the experimental base of the Tea Research Institute,Chinese Academy of Agricultural Sciences,Hangzhou,China.The hyperspectral data were measured using a Cubert UHD185 frame hyperspectral imager (CCD) (http://cubertgmbh.com/) placed in a dark box under two 50 W halogen lamps(ASD Pro Lamp,ASD Inc.,Boulder,CO,USA).The hyperspectral image has 126 equally distributed bands covering a spectral range of 450-950 nm at a spectral resolution of 4 nm.Hyperspectral reflectance was obtained by calibrating the image with a reference PTFE whiteboard and blackboard (https://sphereoptics.de/).The dataset included 50 GL hyperspectral images,30 AH hyperspectral images,and 50 BR hyperspectral images.The region of interest(ROI)was selected from the lesion center,and the mean of all pixels in the ROI was used as the spectral datum for the sample.
2.5.2.Corn leaf spectral dataset of leaf pigments (CORNSPEC)
CORNSPEC includes 213 corn leaf spectra and the corresponding pigment contents,which can be used to identify spectral features and models for retrieving leaf chlorophyll content.The CORNSPEC dataset was collected by our research team at Beijing Xiaotangshan Precision Agriculture Experimental Base,Beijing,China.The leaf spectra were measured with a FieldSpec UV/VNIR spectrometer(ASD),which covers a full spectral range of 400-2500 nm.The spectrometer was coupled with an ASD Leaf Clip to permit leaf spectral measurement.Ten readings were recorded and averaged to obtain a spectral measurement for each leaf.The leaf spectral reflectance was derived by calibrating the spectral radiance with the spectrum of a white Spectralon reference panel (99% reflectance).Immediately after spectral measurement,the measured portion of the leaf was excised and placed in a tube containing 10 mL dimethyl sulfoxide.The pigments were extracted by placing the tube in a 65°C water tub in a dark room for>5 h.Chlorophyll a(Chl a)and chlorophyll b(Chl b)were extracted,and their concentrations were computed following Lichtenthaler et al [49]:

where CAand CBare the respective concentrations of Chl a and Chl b in mg L-1and OD647and OD663are the optical densities at the given wavelengths.Hereafter,the concentration of Chl a+Chl b is abbreviated as Chl.
2.5.3.Plant leaf spectral dataset of optical biochemical properties(LOPEX)
The LOPEX dataset was collected by the Joint Research Centre in Italy and used to characterize relationships between foliar chemical constituents and spectral signals [50].The dataset has been used in the remote-sensing community for feature selection,model calibration,and validation [51,52].The spectral data (i.e.,330 spectral reflectance measurements in the spectral range of 400-2500 nm) and corresponding equivalent water thickness(EWT)from the dataset were used to establish a retrieving model.
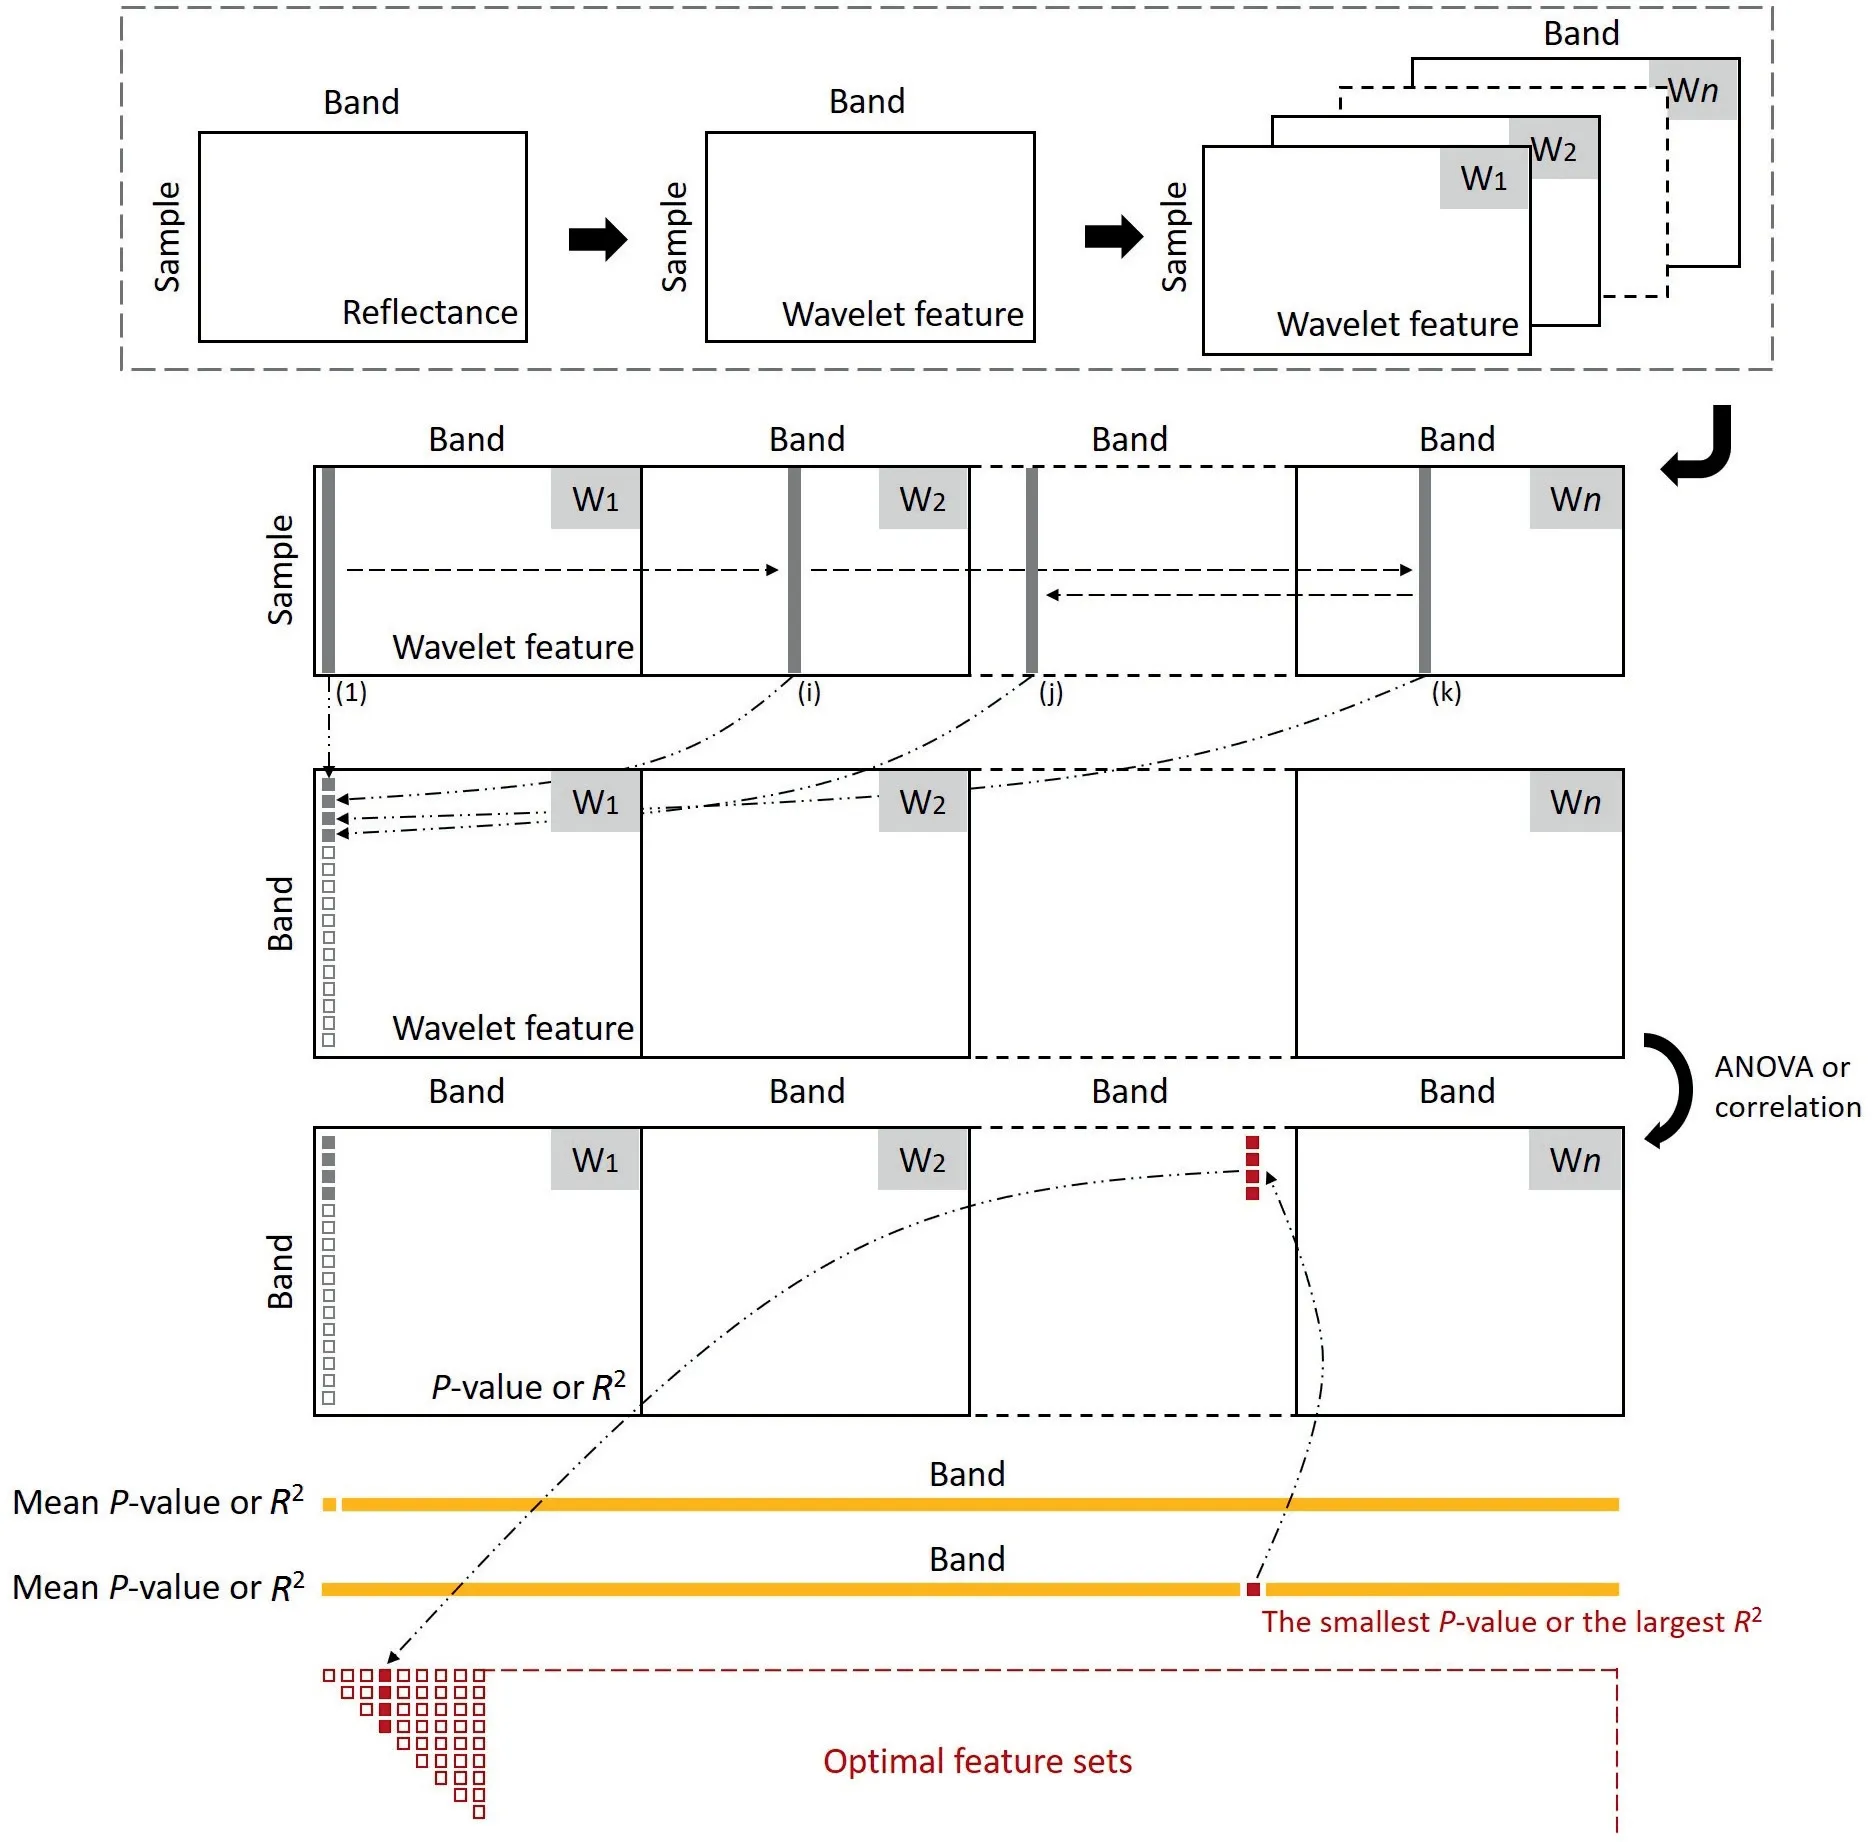
Fig.1.Workflow of the continuous wavelet projection algorithm (CWPA).W1,W2 and Wn indicate wavelet features of differing decomposition scales.
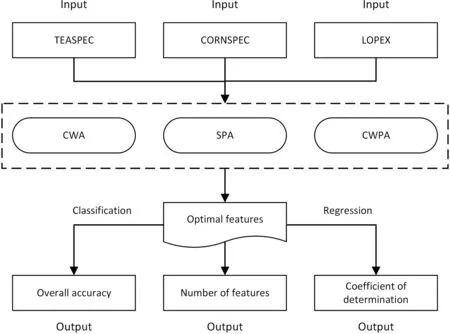
Fig.2.A schematic illustration of data analysis and model evaluation.
3.Rsesults
3.1.Selection of spectral features
For TEASPEC,the spectral curves of GL,AH,and BR samples overlapped (Fig.S1).The averaged coefficients of variation (CV,the standard deviation/mean per band,averaged over bands) of the three classes were 0.15,0.19,and 0.16,respectively.The mean CV of the CORNSPEC dataset was 0.13,whereas the spectral variation of the LOPEX dataset was relatively large (CV=0.29,Fig.S2).
ANOVA fitted to the decomposed wavelet features among the stress classes in TEASPEC revealed that a high proportion of the wavelet features were capable of differentiating stresses even with a strict criterion(P-value<0.001,Fig.3).In the CORNSPEC dataset,most sensitive features were distributed in 400-900 nm (Fig.4A).In the LOPEX dataset,most features over all bands responded well to the EWT (R2>0.7,Fig.4B).For feature selection of CWA,under differing sensitivity thresholds,differing number of wavelet features were obtained.For the TEASPEC dataset,the most sensitive wavelet features in separate feature regions were selected(Fig.3),and the same wavelet features were retained under the 1% and 5% thresholds (scale: 8;central: 930 nm;hereafter the wavelet feature is described as S8-B930),and an additional feature under the 10% threshold (S9-B526,Table S1).For CORNSPEC,that the sensitive areas were relatively concentrated(Fig.4A),resulting in similar selected wavelet features (such as at S3-B511,S7-B719,and S6-B805 nm) under three different thresholds (Table S2).Unlike the results of the first two datasets,the NF of LOPEX differed under three thresholds (Table S3).Under the 10% threshold,five feature regions adjacently positioned on the left side of the scalogram were selected (Fig.4B).
Compared to the CWA model,owning to the mechanism of optimizing the combination of features by successive projection,the CWPA model identified small numbers of features for the TEASPEC(NF=2),CORNSPEC(NF=2),and LOPEX(NF=3)datasets.The position of the first feature selected by the CWPA model was close to those of the features selected by CWA under the threshold of 1%(Tables 2,S1-S3),including S7-B941 and S8-B930 for TEASPEC,S4-B560 and S3-B559 for CORNSPEC,and S7-B1162 and S6-B1158 for LOPEX.However,the subsequent features selected by the CWPA model differed from those of the CWA model.Most wavelet features selected by CWPA were not located in the most sensitive regions identified by CWA (Figs.3 and 4).
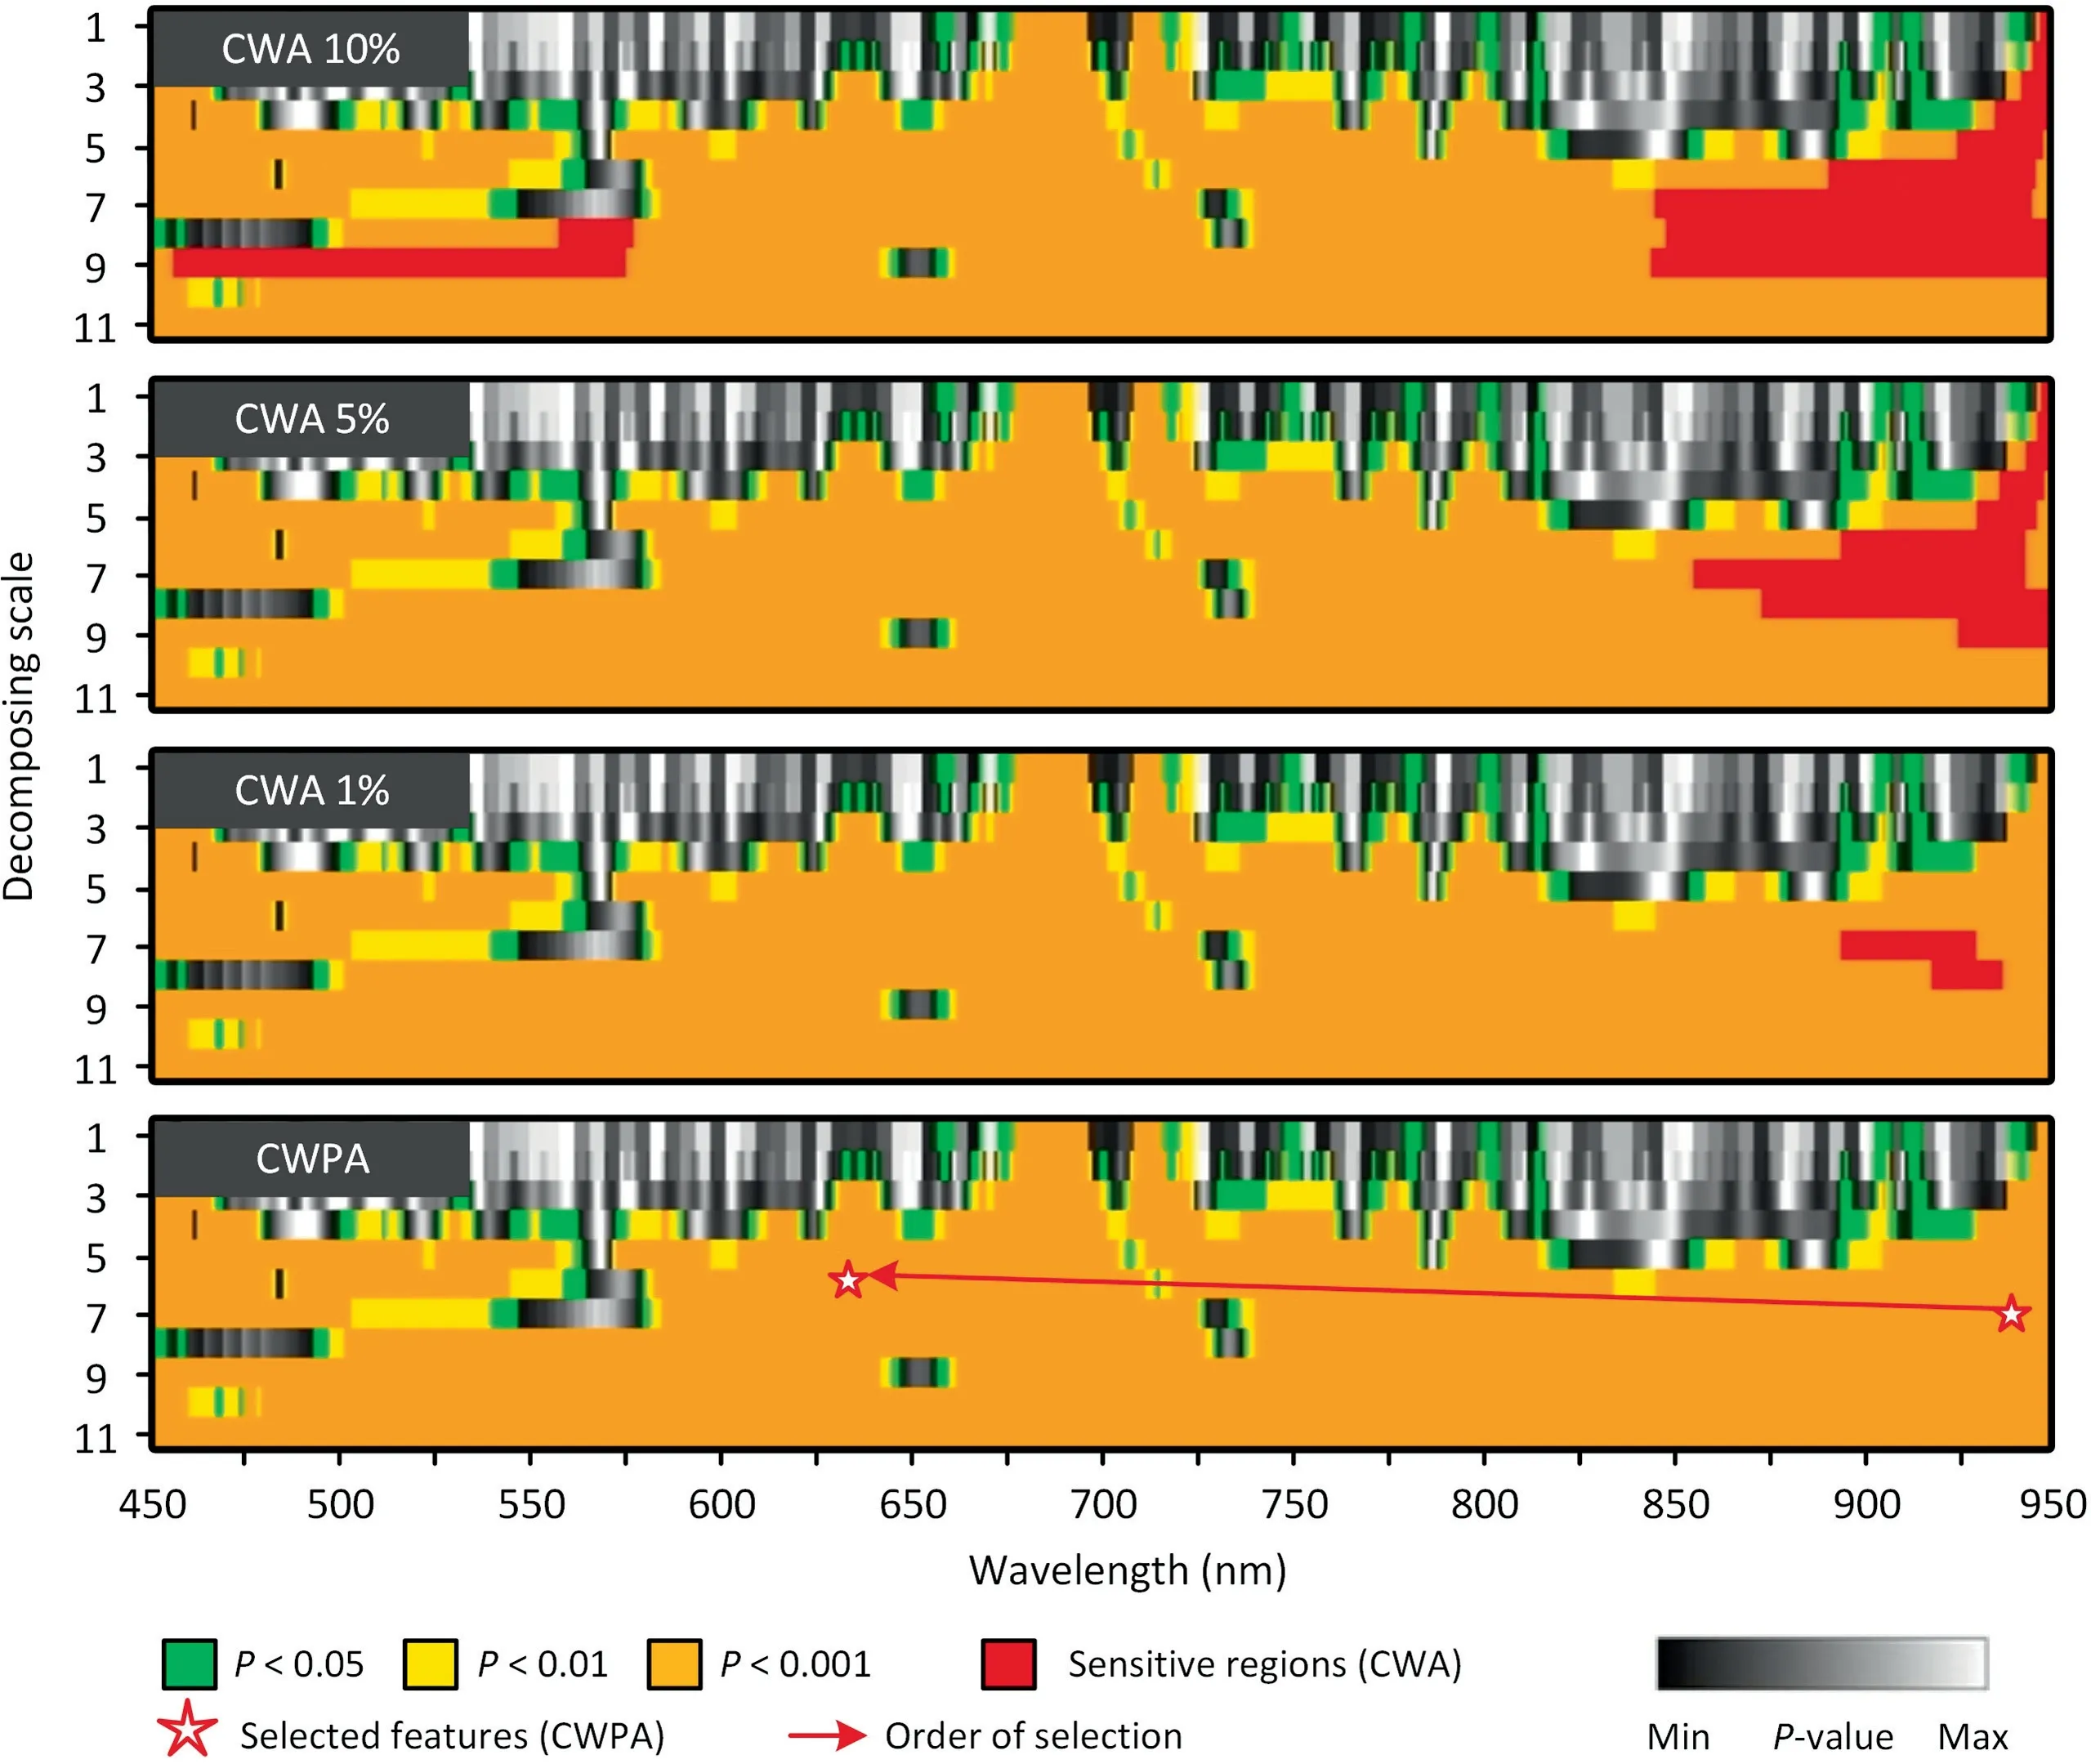
Fig.3.Sensitivity scalogram and selected feature regions under CWA and CWPA for TEASPEC dataset (classification scenario).The P-value is used as the sensitivity index;10%,5%,and 1% indicate the retention ratio of the top most sensitive features.

Fig.4.Sensitivity scalogram and selected feature regions under CWA and CWPA for regression scenarios(A)CORNSPEC dataset and(B)LOPEX dataset.The R2 is used as the sensitivity index;10%,5%,and 1% indicate the retention ratios of the top most sensitive features.
Fig.5 shows the variation in accuracy for SPA and CWPA within the NF range of[1,100].The OA of SPA in the classification scenario increased with NF in general,and the accuracy tended to be stable when the NF was large.In the regression scenario,the R2of SPA increased at the beginning,and then tended to be stable (LOPEX)or decline (CORNSPEC).In contrast,the accuracy variation curve of the CWPA model exhibited a consistent pattern across datasets.The accuracy curve showed a sharp increase at the very beginning(usually two or three features),and then the accuracy decreased sharply,followed by a slow rise (TEASPEC) or a slight rebound across the slow decline in accuracy (CORNSPEC and LOPEX).Although the accuracy curve of the CWPA model showed an irregular variation pattern with the increase in NF,the maximum accuracy was still found at the very beginning of the curve.In comparison with the optimal SPA model,the optimal CWPA model reduced the NF from 67(RF)and 69(NB)to 2(both RF and NB)for the TEASPEC dataset.A similar pattern was observed in regression scenarios.With the CORNSPEC and LOPEX datasets,the optimal SPA model selected 16 and 67 features,whereas the optimal CWPA model selected only 2 and 3 features.

Fig.5.Model accuracy varying with number of features for SPA and CWPA.The dotted line indicates the number of features corresponding to the maximum accuracy in the test set.
3.2.Modeling accuracy
The CWPA model was more accurate than the CWA and SPA models with both classifiers in TEASPEC (Table 3).The accuracies of the CWPA model reached 98.08% (RF) and 100% (NB),whereas the accuracies of the CWA model using two wavelet features were only 82.70% (RF) and 73.08% (NB).Although the SPA model used a large number of spectral features,their accuracies were still lower than the CWPA model (94.23% for RF and 78.85% for NB).In the regression scenarios,even though it found the smallest NF (2 or 3 features),the CWPA model produced similar accuracy to the
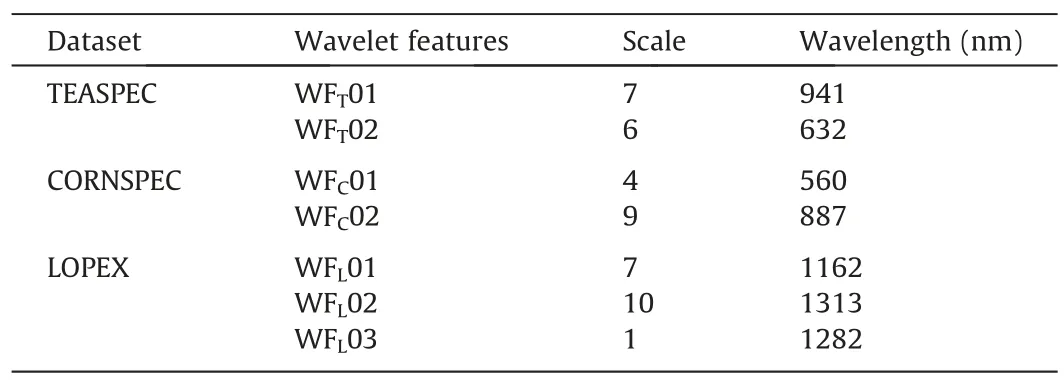
Table 2 Selected wavelet feature parameters of CWPA.
WFT,WFC,and WFLare selected wavelet features identified by the CWPA for TEASPEC,CORNSPEC,and LOPEX,respectively.CWA and SPA models (Table 3).With the CORNSPEC dataset,the generally high accuracy suggests that the chlorophyll of corn leaves could be effectively retrieved based on any of the models.The accuracies of the three models were generally satisfactory for retrieving EWT with the LOPEX dataset.Overall,even with very small NF,the CWPA model produced equal or even higher accuracy in comparison with the CWA and SPA models under both classification and regression scenarios.

Table 3 Results created by three algorithms.
4.Discussion
The CWPA model generated an ideal and small number of features for crop detection under classification and regression scenarios.This superiority stems mainly from the core idea of the CWPA model,which is to maximize the sensitivity of features,meanwhile ensuring complementarity among them.In the CWPA model,the feature sensitivity-ranking procedure that was proposed for generating the feature chain ensures that the topranked features in the chain have both high sensitivity and strong complementarity.Accordingly,the head of the feature chain ensures a small NF with excellent combinations.For all three datasets,the first wavelet feature identified by the CWPA model was the most sensitive of all the SPA features (Fig.S3).This advantage arises from the essence of wavelet analysis,which transfers the original spectral information to the wavelet feature space and allows deep mining of the spectral features for crop detection.Because the CWPA model adopts a successive projection strategy in generating the wavelet feature chain,the selected feature set can include not only sensitive features,but also features that are complementary with those sensitive features,thus increasing the information richness.
In the TEASPEC dataset,the first feature,WFT01 (S7-B941),identified by the CWPA reflects mainly the destruction of the cellular structure of the leaf and the decrease in water content caused by tea stresses [31,53].The high sensitivity of WFT01 to the tea stresses forms a solid basis for the CWPA feature set.The next identified feature,WFT02(S6-B632),reflects the damage to chloroplast structure [53].Even though the WFT02 is out of the top 10%sensitivity scalogram,it may carry important information complementary to the WFT01,a notion supported by a low correlation between them (R2=6.004 × 10⁻¹⁰).In contrast,the two wavelet features selected by CWA have high information redundancy(R2=0.9543),which results in lower accuracy.The SPA model selected 67(RF)and 69(NB)features,with the feature sets including bands over 450-650 nm and some bands in the near-infrared region.The inability of original spectral bands to characterize some subtle spectral variations may account for the lower accuracy than CWPA.A lack of highly sensitive features that are able to dominate the feature set may explain why the accuracy of the SPA model varied smoothly with increasing NF.Too many features also lead to inefficient model operations.
The high sensitivity and strong complementarity of features identified by the CWPA model were also evident in the regression scenarios.In the LOPEX dataset,the three wavelet features selected by the CWPA model were located at 1162,1313,and 1282 nm,which are all important regions of leaf water absorption [54].The first feature WFL01 showed high sensitivity (R2=0.9172) to the parameter but very low correlation with the other features.Cheng et al.[42]showed that wavelet features outperformed spectral bands and vegetation indices in retrieving leaf water content.However,severe information redundancy was found among features selected by CWA (Fig.S4),with R2>0.99 between features 1-5 and R2>0.86 between features 6-10.Similarly,for the CORNSPEC dataset,the first feature WFC01 selected by the CWPA was very sensitive to Chl (R2=0.7928) and was located at the green peak of the spectrum (560 nm),which is indeed an important reflection spectral region of Chl.The very low correlation between WFC01 and WFC02 (R2=1.2803 × 10⁻¹⁰) confirmed the strong complementarity between them.The same defects of low sensitivity and highly correlated features were found in the SPA and CWA models for the CORNSPEC dataset.
The CWPA used in spectral deep mining and informationdimension reduction has shown great potential for modeling applications based on hyperspectral data.The essence of the CWPA algorithm is to examine the sensitivity of spectral features to specific datasets and optimize feature combinations.The strategy of taking model accuracy to feed back into feature combination further strengthens the adaptability of CWPA.The CWPA has been tested only in typical crop phenotype detection indicators at leaf and canopy level.Further testing in other scenarios,such as in detecting nitrogen content [55],nitrogen use efficiency [56],water use efficiency[57],canopy coverage[58],canopy height[59]and plant density at emergence [60],is needed.The CWPA model greatly alleviates the computational complexity of spectral data analysis and was calculated within one second based on validation dataset(Intel Core i7-6700HQ,RAM 8 GB),suggesting relatively high efficiency of computation.CWPA is an efficient data-analysis method for large-scale crop monitoring by remote sensing (with airborne and satellite-borne spectral sensors) for specific scenarios and has great application potential in crop breeding and cultivation.Further research would investigate the compatibility of the proposed algorithm at diverse spectral resolutions and measure its performance using real-world data.Combination of CWPA features with deep-learning approaches may further improve the performance of models in crop monitoring and phenotyping.
5.Conclusions
A novel method,the continuous wavelet projections algorithm(CWPA) is described for identifying sensitive feature set for crop detection.By performing deep mining of spectral information and optimization of feature combinations,the CWPA generates fewer complementary features than other algorithms while achieving greater accuracy in correlating crop status with bioparameters.Facilitated by continuous wavelet analysis,the first feature identified by the CWPA was highly sensitive in both classification and regression scenarios.Under the successive projection procedure,the features sequentially selected by CWPA carry information supplementing that of the first feature.It thereby conquers the common problem of feature-selection methods: the lack of spectral uniqueness and information redundancy among features,and ensures relatively high accuracy with fewer features.The classification accuracy of tea plant stresses reached 98.08%by application of the CWPA-derived two features from the TEASPEC dataset.The CWPA used two features to retrieve corn chlorophyll in CORNSPEC (R2=0.8521) and more accurately extracted the equivalent water thickness from LOPEX(R2=0.9508)using three selected features.Overall,the CWPA outperformed the CWA and SPA in extracting and identifying effective features in both classification and regression scenarios.
CRediT authorship contribution statement
Xiaohu Zhao:Writing-original draft,Investigation,Validation,Data curation.Jingcheng Zhang:Conceptualization,Funding acquisition,Writing -review &editing.Ruiliang Pu:Writing -review &editing.Zaifa Shu:Investigation,Validation,Data curation.Weizhong He:Investigation,Validation,Data curation.Kaihua Wu:Conceptualization,Funding acquisition.
Declaration of competing interest
The authors declare that they have no known competing financial interests or personal relationships that could have appeared to influence the work reported in this paper.
Acknowledgments
This work was supported by the National Natural Science Foundation of China(42071420),the Major Special Project for 2025 Scientific,Technological Innovation (Major Scientific and Technological Task Project in Ningbo City) (2021Z048),and the National Key Research and Development Program of China(2019YFE0125300).
Appendix A.Supplementary data
Supplementary data for this article can be found online at https://doi.org/10.1016/j.cj.2022.04.018.
- The Crop Journal的其它文章
- Assessing canopy nitrogen and carbon content in maize by canopy spectral reflectance and uninformative variable elimination
- Automatic segmentation of stem and leaf components and individual maize plants in field terrestrial LiDAR data using convolutional neural networks
- Leaf pigment retrieval using the PROSAIL model:Influence of uncertainty in prior canopy-structure information
- Field estimation of maize plant height at jointing stage using an RGB-D camera
- Quantifying the effects of stripe rust disease on wheat canopy spectrum based on eliminating non-physiological stresses
- Estimation of spectral responses and chlorophyll based on growth stage effects explored by machine learning methods

