Automatic segmentation of stem and leaf components and individual maize plants in field terrestrial LiDAR data using convolutional neural networks
Zurui Ao ,Fngfng Wu ,Sihn Hu ,Ying Sun ,Ynjun Su ,Qinghu Guo ,Qinhun Xin,*
a Guangdong Key Laboratory for Urbanization and Geo-simulation,Sun Yat-sen University,Guangzhou 510275,Guangdong,China
b State Key Laboratory of Vegetation and Environmental Change,Institute of Botany,Chinese Academy of Sciences,Beijing 100093,China
c Department of Ecology,College of Urban and Environmental Science,and Key Laboratory of Earth Surface Processes of the Ministry of Education,Peking University,Beijing 100871,China
Keywords:Terrestrial LiDAR,Phenotype Organ segmentation Convolutional neural networks
ABSTRACT High-throughput maize phenotyping at both organ and plant levels plays a key role in molecular breeding for increasing crop yields.Although the rapid development of light detection and ranging(LiDAR)provides a new way to characterize three-dimensional(3D)plant structure,there is a need to develop robust algorithms for extracting 3D phenotypic traits from LiDAR data to assist in gene identification and selection.Accurate 3D phenotyping in field environments remains challenging,owing to difficulties in segmentation of organs and individual plants in field terrestrial LiDAR data.We describe a two-stage method that combines both convolutional neural networks (CNNs) and morphological characteristics to segment stems and leaves of individual maize plants in field environments.It initially extracts stem points using the PointCNN model and obtains stem instances by fitting 3D cylinders to the points.It then segments the field LiDAR point cloud into individual plants using local point densities and 3D morphological structures of maize plants.The method was tested using 40 samples from field observations and showed high accuracy in the segmentation of both organs (F-score=0.8207) and plants (Fscore=0.9909).The effectiveness of terrestrial LiDAR for phenotyping at organ (including leaf area and stem position)and individual plant(including individual height and crown width)levels in field environments was evaluated.The accuracies of derived stem position (position error=0.0141 m),plant height(R2>0.99),crown width(R2>0.90),and leaf area(R2>0.85)allow investigating plant structural and functional phenotypes in a high-throughput way.This CNN-based solution overcomes the major challenges in organ-level phenotypic trait extraction associated with the organ segmentation,and potentially contributes to studies of plant phenomics and precision agriculture.
1.Introduction
The imbalance between increasing food demands driven by population growth and uncertain food supplies due to farmland loss and changing climate threatens global food security [1].Molecular breeding aimed at improving crop yields is an effective means to mitigate current food problems [2].A central task in molecular breeding is to dissect the genetics of plant traits with the aid of high-throughput phenotype data [3,4].There are both academic and industrial demands for robust and efficient methods to extract high-throughput phenotypic traits.
Remote sensing provides new opportunities to scan plants and identify plant phenotypes [5,6].Optical imaging techniques have been used for the recognition and analysis of plant traits and their relationships to plant architecture [7],growth [8-10],yield[11-13],and stress responses [14-17].Optical images provide abundant spectral and texture information but lack structure information that helps in understanding plant function.The stereovision technique [18] has been developed to characterize three-dimensional (3D) plant structures based on multi-view images,but suffers from drawbacks such as stereo-matching errors caused by illumination and shadowing,incomplete reconstruction data caused by occlusion among plant components,and tradeoffs between accuracy and efficiency [19].Optical images can be used to extract specific 3D phenotypic traits (e.g.,leaf area,crown size,and plant height)effectively in controlled environments[16,20,21],but often face limitations in characterizing accurate and detailed 3D plant structure in field environments.
The emergence of light detection and ranging (LiDAR) technology provides a powerful tool for acquiring 3D structural data.LiDAR actively emits laser pulses and measures the distance from the sensor to the target using the time delay between the emitted and backscattered light signals.LiDAR has a broad range of applications in surveys of forest resources [22] and monitoring ecosystems [23,24],because it can partially penetrate vegetation canopy and is insensitive to sunlight.Recently [25],LiDAR has gained increasing attention in plant phenotyping studies.LiDAR systems mounted on the unmanned aerial vehicles or the terrestrial platforms can overcome difficulties in image-based phenotyping (such as illumination and saturation effects) and can provide accurate measurements of phenotypic traits,such as morphological parameters,projected leaf area,leaf area index (LAI),and aboveground biomass at the plot level [26-28].
Various individual plant segmentation methods have been proposed to measure phenotypic traits at the plant level.Höfle [29]proposed a region-growing method that accounts for both radiometric and geometric features in detecting maize (Zea mays L.)plants in terrestrial LiDAR data.Jin et al.[4] demonstrated the potential of a deep learning-based method for individual maize segmentation and individual height measurements.Miao et al.[30]developed a semi-automatic toolkit for point-cloud segmentation of maize shoots at differing growth stages.It is also of interest to measure 3D structure at the organ level to further link plant phenotype with genetic parameters and environmental conditions[12].A prerequisite for such analysis is to segment plant organs(such as leaf and stem)in terrestrial LiDAR data,and an automatic and accurate organ-segmentation algorithm is still lacking.
Existing methods for organ segmentation using terrestrial LiDAR data include model-based,feature-based,and learningbased methods.Model-based methods fit primitives for different components (such as by using cylinders for stems and planar surfaces for leaves) and have been widely used in tree segmentation[31-33].Feature-based methods extract user-defined features associated with intensity,local spatial distribution,and waveform from neighborhood points in a specific region,and separate different components using empirical rules constructed from the derived features [34-36].Conventional machine-learning-based methods also require user-defined features,but construct segmentation rules from manually labeled points using statistical learning methods such as support vector machines [37],random forests[38,39],and conditional random fields [40].Recently developed deep-learning-based methods [41-43] can automatically extract features from big data and offer advantages in classification and segmentation in LiDAR data.
Current segmentation methods face at least three challenges in segmenting stems and leaves of maize plants from field terrestrial LiDAR data: (1) limited applicability of the methods.LiDAR data contain 3D structural information but lack spectral information,and the intensities of LiDAR points contain large uncertainties[44].Only a few LiDAR systems have the ability to capture multiwavelength data.Commonly only geometric coordinate information is available in LiDAR data,limiting the application of feature-based and machine-learning-based methods.Most model-based methods developed for tree organ segmentation according to structure characteristics are inappropriate for maize organ segmentation because crops and trees have different structures.Moreover,terrestrial LiDAR data from maize contain considerable noise and occlusion,which will strongly influence the accuracy of model fitting.Although some methods [34,45-47]can segment stems and leaves of maize from the point cloud of an individual plant,they require pre-processing of individualplant segmentations,which is often conducted manually.Accuracies of these methods are limited in segmenting organs from field terrestrial LiDAR data,which contain a large number of overlapping individual maize plants.(2) Difficulties in parameter tuning.Feature-based and model-based methods require empirical rules that involve a series of thresholds for segmenting stems and leaves.Maize leaves have irregular shapes and there are complex connections between leaves and stems.In field environments,leaves of different individual plants likely overlap each other at various positions.It is hard to isolate different components with user-defined thresholds,especially when maize plants of different sizes and shapes are planted closely in the field.(3) Loss of spatial information.Convolutional neural networks (CNNs) have become increasingly important for component segmentation of crops.One key challenge to CNN-based component segmentation is that CNNs handle structured data well but work poorly on unstructured and unordered 3D points.One approach to addressing this issue is to convert the 3D point cloud data of LiDAR into structured 2D images[4]or 3D voxels[45].Such conversion inevitably leads to the loss of spatial information.There are point-based CNNs for point-cloud segmentation,such as PointNet and its variants [48,49].These methods often require down-sampling the input point clouds to a specific size(e.g.,2048 points),which also leads to loss of spatial information.
The objective of this study was to overcome the main challenges in organ-level phenotypic trait extraction associated with the segmentation of organs for individual maize plants in field terrestrial LiDAR data.We propose an automatic method that first separates stem and leaves using a point-based CNN and then segments the point cloud into individual maize plants based on morphological characteristics.In contrast to existing organ segmentation algorithms,which can deal with point clouds of only one individual plant [34,45-47],the proposed method is able to handle field terrestrial LiDAR data directly.A major advantage of the proposed method is that it does not depend critically on user-defined thresholds,customized features,or empirical rules.We evaluated the effectiveness of terrestrial LiDAR in phenotyping at both organ (including leaf area and stem position) and individual maize (including individual height and crown width) levels in field environments.
2.Materials
2.1.Point-cloud data collection and preprocessing
Field experiments were conducted in a maize field with an area of 800 m2(40 m × 20 m) located at Institute of Botany,Chinese Academy of Sciences,Beijing,China (Fig.1a).The maize cultivar was Zhengdan 958(ZD958),a low-nitrogen-efficient maize hybrid.Maize seeds were planted with a distance of 0.8 m between columns,and the distance between adjacent plants in a column ranged from 0.6 to 1.3 m.Overall,the planting density was approximately 1.35 plants m-2.A FARO Focus3D X120 laser scanner was used to acquire LiDAR data of maize.The nominal scanning range of the LiDAR sensor is 0.6-120 m,and the scanning accuracy is 0.002 m.Maize was scanned at the tasseling stage,because in this period the plant height and leaf numbers varied largely for different individuals and there were complex interactions between leaves of different plants.This approach helped to ensure that the scanned data were representative and suitable for assessing the performance of the proposed method in organ and plant segmentation and extraction of phenotypic traits.In total,six scans were collected to cover the study area.The multi-scan data was then registered and stitched in the FARO SCENE 5.4.4 software to obtain a LiDAR point cloud for the entire site.The height of the maize plants ranged from 2.13 to 3.02 m,and the crown width ranged from 0.92 to 1.74 m.The leaf number of the maize plants varied from 8 to 15,and the point density varied from 7533 to 40,790 points plant-1.

Fig.1.The study site and maize data scanned by terrestrial LiDAR are shown for(a)an overview of the study site,(b)LiDAR data for the training site,and(c)LiDAR data for the test site.The LiDAR data are colored by height.
Owing to the field observation conditions,the maize LiDAR data contained large amounts of noise.The statistical outlier removal(SOR) algorithm [50] as implemented in point cloud library (PCL)[51] was used to identify outliers.The number of neighborhoods and the threshold of standard deviation were set to 6 and 2,respectively.Ground returns were identified using the improved progressive triangulated irregular network (TIN) densification filtering algorithm[52]for its high accuracy in complex terrain.The identified ground returns were then used to interpolate a 2 m digital elevation model(DEM).A normalized point cloud was constructed by subtraction of the DEM from the height of each LiDAR point.To avoid the influence of small objects on the ground,points in the normalized point cloud with a height value below 0.1 m were removed.
After pre-processing,we chose two subsites with high data quality(containing little noise and few missing values) to conduct the experiment,using one for training and the other for testing.As can be seen in Fig.1b and c,the training site and the test site contained respectively 100 (2,724,850 points) and 40 maize plants(603,360 points.We segmented individual plants from the LiDAR data and manually labeled the points belonging to stems and leaves for model training and evaluation.
2.2.Field measurements
Ground measurements of maize phenotypic traits,including stem position,individual height,crown width,and leaf area,were collected for 40 test samples.Individual height was measured manually when the LiDAR data were being scanned.A DJI Mavic Pro was used to capture a top-view image for each test sample.The DJI drone flew at a height of 5 m above the ground with a constant focal length to capture images with a resolution of 0.002 m.The reference crown width was then calculated as the length of the plant along its perpendicular direction(Fig.2a).All leaves were harvested and scanned using a Canon LiDE 220 scanner (Fig.2b).The scanned images of leaves were processed with WinFOLIA software to calculate the reference leaf area.The reference stem position was extracted from the geometric center of the manually labeled stem points.
3.Methods
We propose a new method that combines CNNs and morphological characteristics to segment stem and leaf for individual maize plants via a two-stage process.In the first stage,a pointbased CNN is applied to classify both stems and leaves in downsampled LiDAR point clouds.The initial classification results are refined to reduce misclassification and obtain the complete stem and leaf classes.In the second stage,individual maize plants are extracted using a clustering-based method relying on local point densities and 3D morphological structures of the maize leaves.Based on the segmentation results,we developed a straightforward solution to extract 3D phenotypic traits from field terrestrial LiDAR data.
3.1.Stem and leaf segmentation based on deep learning
Fig.3 illustrates the workflow of proposed method for segmenting stems and leaves.We used the PointCNN semantic segmentation model to differentiate stems and leaves because PointCNN effectively accounts for local geometric features and is efficient in computation[53].Since PointCNN supports only a specific number of points as input data,the training and test sites are divided into grids.Following the planting interval,we set the grid length to 1.2 m and width to 0.8 m.We randomly selected 2048 points in each grid for model training and testing (Fig.3c).
In the training phase,the point clouds for all grids were augmented by rotating a random angle ranging from 0 to 180°in both
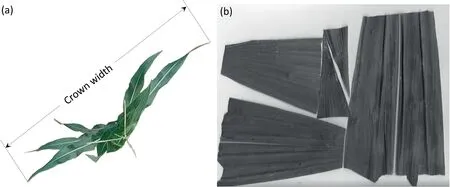
Fig.2.Images used to measure the reference phenotypic traits of (a) crown width and (b) leaf area.
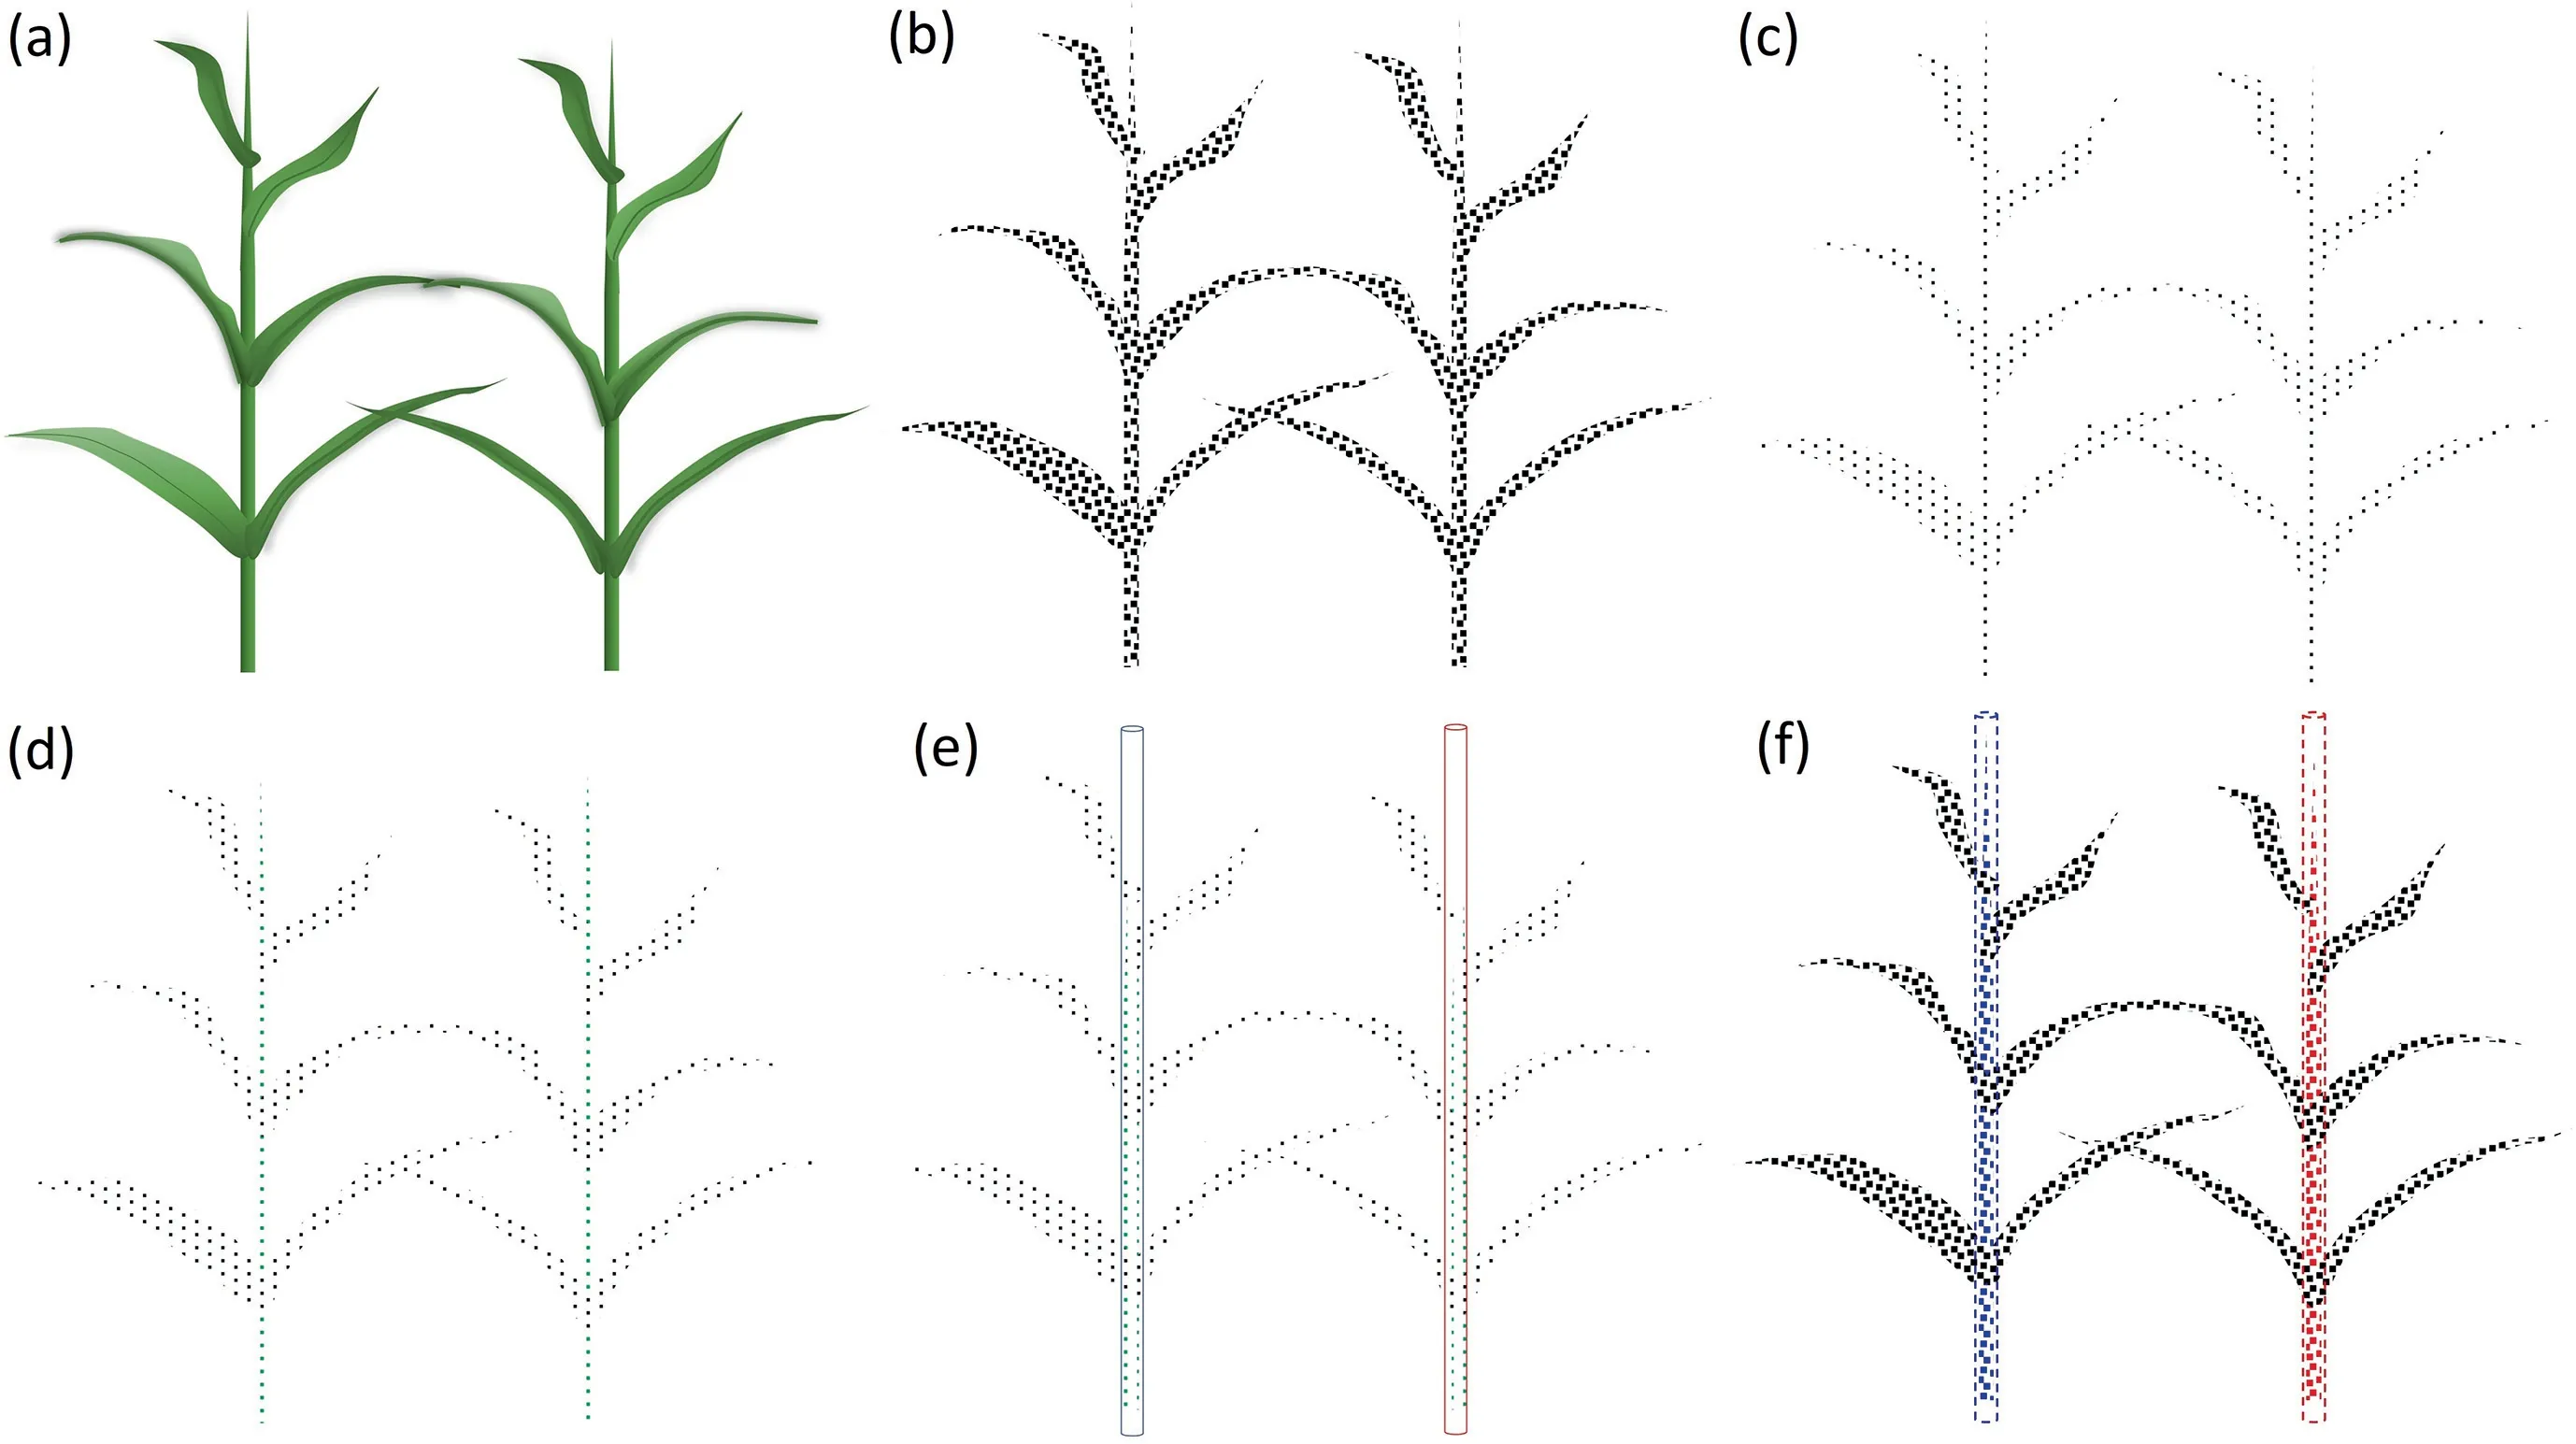
Fig.3.The workflow of the proposed method for segmenting stems and leaves of maize plants shows examples for (a) two individual plants,(b) the corresponding point clouds,(c)a down-sampled point cloud,(d)initial segmentation results obtained by PointCNN,(e)3D cylinder fitted by the random sample consensus(RANSAC)algorithm,and (f) refined segmentation results.Black and green points denote leaf and stem,respectively.Red and blue points denote different stem instances.
vertical and horizontal directions,and scaling with a ratio between 0.85 and 1.15 to enrich the training set.After the augmentation,the training dataset contained 4000 point clouds.We extracted 80% of the data in the training dataset for model training and 20% data for model validation.Details for the dataset used are shown in Table 1.Owing to uneven distribution of stem and leaf sample sizes,the model suffered from overfitting and tended to classify all points into the leaf class.To address this problem,we used a weighted cross entropy as the loss function as follows:where L denotes training loss,W(x )denotes the weight of sample x,W(x )=1 if x belongs to the leaf class;otherwise,W(x )is set to the ratio of leaf sample size to stem sample sizes,p(x )and q(x )represent the reference and predicted probability distribution of sample x,respectively [54].

Table 1 Detailed information for the LiDAR data used.

The Adam optimization method [55] was used to minimize training loss.The learning rate was initialized to 10-4and decayed at a ratio of 0.8 for every 10,000 iterations.The batch size was set to 8 to fit the GPU memory.The model was iteratively trained for 500 epochs to ensure convergence.At the end of each training epoch,the model was evaluated on the validation dataset,andthe one minimizing validation loss was selected as the optimal model.
The initial segmentation results (Fig.3d) obtained by the deep learning model contained errors such as oversegmentation,undersegmentation,and noise.Because segmentation was conducted in a subset of the original point clouds,a refining process was required to optimize the segmentation results and obtain the complete stem and leaf points.Considering that the stem grows vertically,we fitted 3D cylinders with a radius of 0.04 m to the initial stem points using the random sample consensus (RANSAC) algorithm,each cylinder corresponding to a single stem instance(Fig.3e).The fitted cylinders were used to extract stem points in the original point cloud.The points within the cylinders were labeled as stems and those outside the cylinders as leaves to obtain the optimized segmentation results (Fig.3f).
3.2.Individual plant segmentation based on morphological characteristics
Now stem instances and unsegmented leaves were obtained,and further processes were needed to segment the point cloud into individual maize plants.We developed a clustering-based segmentation method for maize plants relying on local point densities and 3D morphological structures of maize leaves.As shown in Fig.4,the main idea behind the proposed method is to extract leaf clusters from the point cloud according to local point densities and then assign every leaf cluster to the plant to which it belongs,using a morphological rule.
There is typically a gap between leaves in different plants,and local point densities change accordingly.We used a densitybased spatial clustering of applications with noise (DBSCAN)algorithm to extract leaf clusters from the point clouds (Fig.4b) [56].The DBSCAN algorithm contains two adaptive thresholds: the radius Rnghbrfor neighbor searching and the minimum number of neighbors Nnghbrfor core point identification.We set Rnghbrto six times the average point distance (0.03 m) and Nnghbrto the fifth percentile of numbers of neighbors for all points.For convenience,we denoted two clusters as contacting clusters if the minimum of the distances between any two points,one in each cluster,was less than Rnghbr.The output leaf clusters were divided into four categories according to the number of contacting stem instances:noisy clusters,isolated clusters,single instance clusters,and multiinstance clusters (Fig.4b).A cluster was recognized as noisy if the number of points in the cluster was less than Nnghbr.We did not remove noisy clusters because they comprised small objects with low point densities (such as the tips of leaves) and were important for preserving the shapes of objects.The isolated clusters comprised fragments of leaves that were detached from all stem instances owing to occlusion and missing values in the point clouds.Single-instance clusters represented clusters that contacted only one stem instance.Multi-instance clusters represented clusters that contacted multiple stem instances because of overlaps among leaves.
We constructed a morphological rule to assign labels to different categories of leaf clusters.Points in noisy clusters were merged into their nearest single-instance cluster(Fig.4c).Isolated clusters were assigned according to the continuity of leaves.The leaf grows continuously and the direction at a certain point is related to the points nearby.In addition,the direction of a complete leaf cluster is pointing to the stem to which it belongs.For each isolated cluster,we performed a principal component analysis (PCA) to derive its direction and extracted all single-instance clusters along that direction as candidates.We then derived the angles between the directions of the isolated cluster and all candidates,and merged the isolated cluster into the candidate corresponding to the minimum angle(Fig.4d).For each multi-instance cluster,we identified overlapping leaves by the shortest path connecting two stem instances and then cut the overlapped leaves in the middle(Fig.4e).In this way,multi-instance clusters were split into several single-instance clusters.All single-instance clusters were directly assigned to the plant to which the contacting stem instances belonged (Fig.4f).
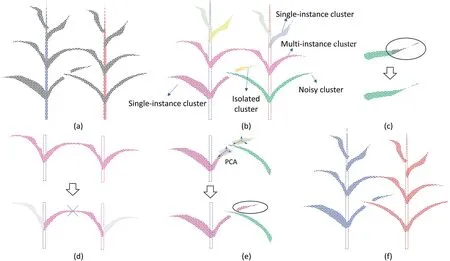
Fig.4.Diagrams that illustrate individual maize plant segmentation based on morphological characteristics show (a) point cloud with stem instances and unsegmented leaves;(b) leaf clusters obtained by the DBSCAN algorithm,where each color represents one cluster;(c) assigning a noisy cluster to its nearest single-instance cluster;(d)assigning an isolated cluster to a single-instance cluster according to the consistency of the leaf direction;(e)identifying the connected path between two stems and splitting the multi-instance cluster into several single-instance clusters,and(f)assigning each single-instance cluster to a contacting stem instance and producing the segmentation results.
3.3.Extraction of phenotypic traits
We extracted phenotypic traits at both organ and plant levels based on segmented stem and leaf instances.We focused on four key phenotypic traits associated with plant function and molecular breeding: leaf area,stem position,individual height,and crown width.As shown in Fig.5,the stem position was obtained from the fitted cylinders in Section 3.1 and the individual height was calculated from the difference between the highest and the lowest points.Because we removed points below 0.1 m in the preprocessing of LiDAR data,we added 0.1 m to the calculated individual height to avoid underestimation.Crown width was calculated from the projection onto the horizontal plane.To derive leaf areas,the point clouds for each individual plant were clustered into supervoxels using the voxel cloud connectivity segmentation(VCCS) method [57].VCCS splits the point cloud into voxels and iteratively merges these voxels according to color,spatial,and normal proximities.We did not account for color or normal proximities because color information was unavailable and normal estimation is sensitive to noise and the search radius.To account for point densities and leaf widths,we set the parameters of voxel resolution and seed resolution to 0.008 m and 0.08 m,respectively.We removed supervoxels that contacted the stem instance(Fig.5b).Each supervoxel for leaves was projected onto its bestfitting plane(Fig.5c)[58],and then a 2D triangulation representation for the points in the supervoxel was generated using the alpha-shape algorithm as implemented in Matlab R2020a(Fig.5d).The leaf areas were obtained from the sum of areas of all triangles.
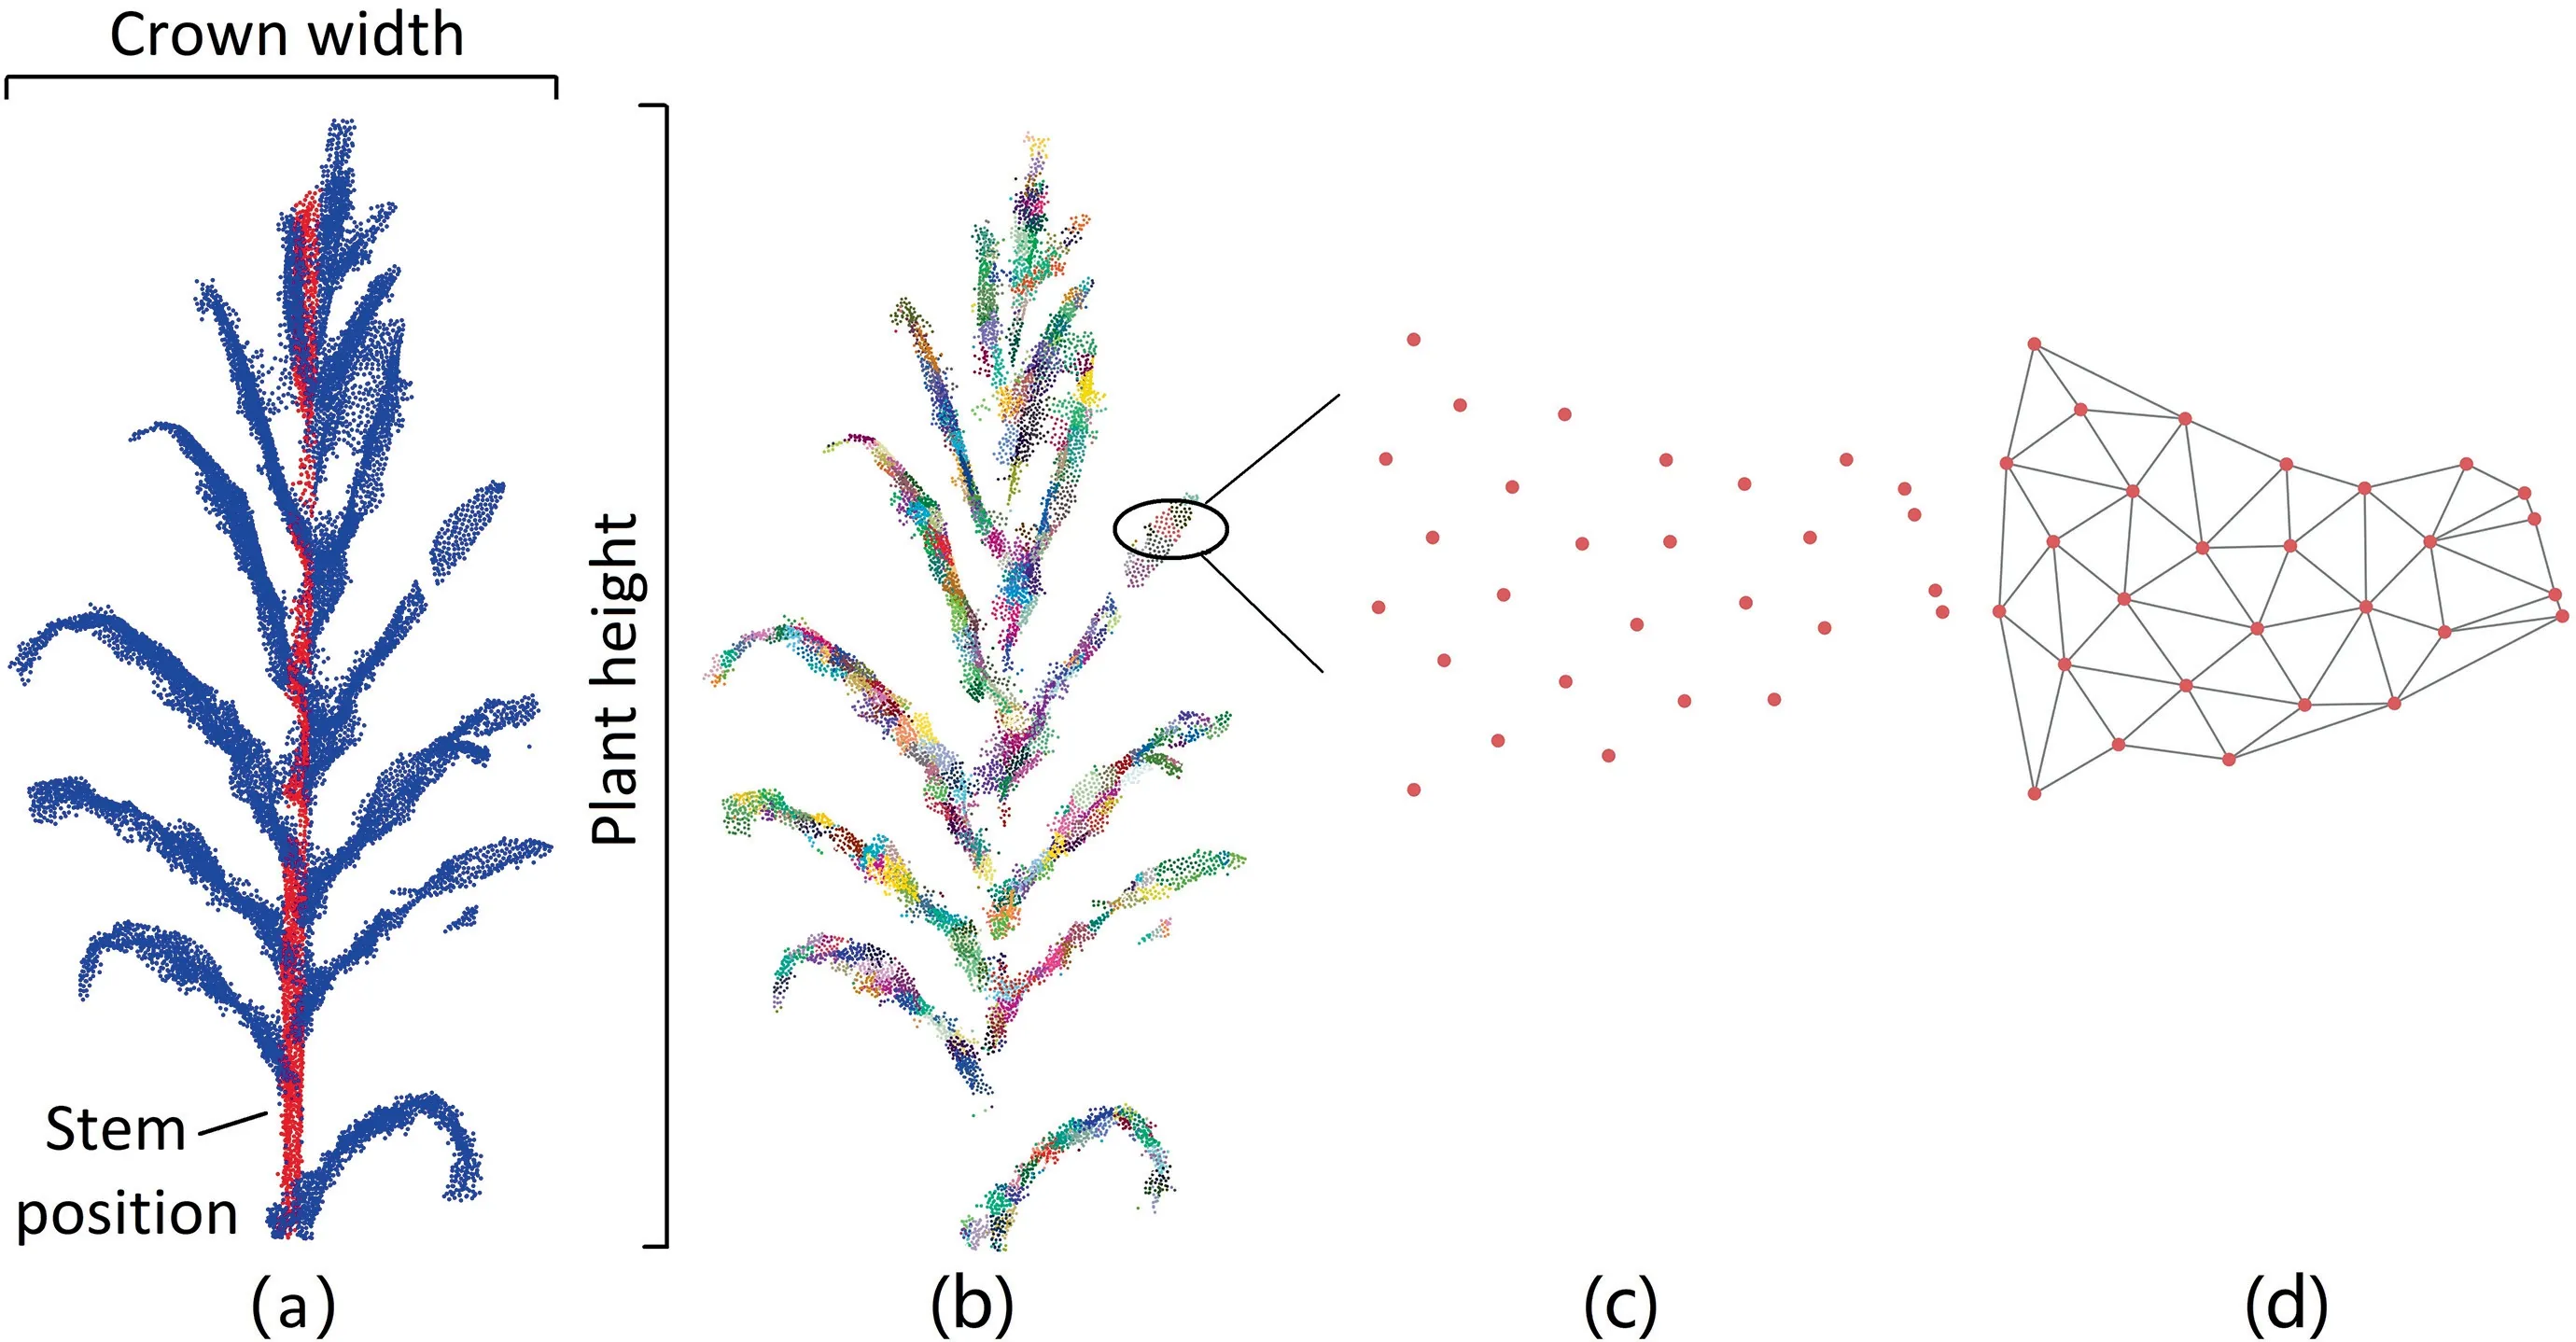
Fig.5.Diagrams that illustrate phenotypic traits of individual maize plants,showing (a) the extraction of stem position,crown width,and plant height;(b) supervoxels clustered for leaves using voxel cloud connectivity segmentation(VCCS)method;(c)the supervoxel projected onto its best-fitting plane,and(d)triangulation representation of one supervoxel for leaf area estimation.
3.4.Quantitative evaluation
We evaluated the segmentation results of both organs (including stems and leaves) and plants at the point level.Three commonly used accuracy metrics including recall (r),precision (p),and F-score were adopted[59].For individual maize segmentation,the true positive(TP)indicates points that are correctly segmented into an individual plant;the false positive (FP) denotes the points that are wrongly segmented into an individual plant;and the false negative(FN)denotes the points that belong to an individual plant but are assigned to another individual plant.The stem-leaf segmentation result was evaluated for each individual maize.We denoted the stem as the positive class and the leaf as the negative class.If a stem point was correctly segmented,we called it TP;if a leaf point was wrongly segmented as stem,we recognized it as FP;and if a stem point was wrongly segmented as leaf,we recognized it as FN.The r,p,and F-score can be derived as follows:

We used quantitative metrics in the form of root-mean-square error (RMSE) and coefficient of determination (R2) to evaluate the accuracy of phenotypic trait extraction.RMSE assesses the differences between predicted and measured phenotypic traits and R2accounts for the linear relationships between the predicted and measured phenotypic traits.These metrics are given by

where yianddenote respectively the reference and predicted phenotypic traits for the ith plant,denotes the mean of y,and n denotes the number of plants.
4.Results
4.1.Segmentation of stems and leaves
The initial segmentation results produced by the PointCNN model achieved an F-score of 0.9579.After the RANSAC-based refinement,all stem instances were successfully extracted with no false negative or false positive predictions.Fig.6 shows the refined segmentation results for representative maize plants with the lowest height,highest height,noisy scanning (where the point cloud contained much noise),incomplete scanning(where parts of maize were missing from the point cloud),lowest F-score,and highest Fscore.It can be seen that the segmentation results were highly consistent with the ground truth.At the point level,the proposed method yielded an F-score of 0.8343 for the lowest maize plant(Fig.6a) and an F-score of 0.8469 for the highest maize plant(Fig.6b),demonstrating its applicability to plants of different heights.The method also produced accurate results with noisy(Fig.6c)and incomplete(Fig.6d)data.The F-scores for noisy scanning and incomplete scanning were 0.8409 and 0.9179,respectively.The most challenging scenario is shown in Fig.6e,where the stem grew with a marked curvature.In this case,the fitted 3D cylinder failed to envelop the points near the curving stem and the method reached its lowest F-score of 0.7042.Although there were large numbers of broken and vertically growing leaves,the proposed method achieved a high F-score of 0.9317 in the scenario of Fig.6f.

Fig.6.Stem-leaf segmentation results.(a) and (b) were selected according to the indicated properties.The left image in each panel shows the ground truth and the right image shows the segmentation results.Red and blue color indicate stem and leaf points,respectively.
The quantitative metrics in Table 2 demonstrate that the method could well segment stems and leaves from field terrestrial LiDAR data.The mean r,p,and F-score for each individual maize were 0.8922,0.7620 and 0.8207,respectively.The accuracies were robust to different heights,leaf numbers,and point densities.
4.2.Segmentation of individual maize plants
The individual plant segmentations are compared with the ground truth in Fig.7.The quantitative metrics in Table 2 demonstrate that the proposed method performed reasonably well for individual maize segmentation.The accuracies were strongly related to the complexities of the interactions between different plants.Individual plants that did not overlap with others were completely segmented with no errors of commission or omission.In total,the method achieved a full score (F-score=1) for 18 individual plants.For overlapping plants,the method successfully segmented most of their leaves and the F-scores were >0.94 for all plants.The mean r,p,and F-score for each individual maize were 0.9914,0.9910,and 0.9909 respectively.These results demonstrate the ability of the developed model to segment individual maize plants using field terrestrial LiDAR data.
4.3.Phenotypic trait extraction
The quantitative metrics in Table 3 indicated that the mean error of extracted stem position was 0.0141 m.It can be observed that the accuracy of stem position was dependent on the results of stem-leaf segmentation.For example,the plant with ID 37 showed a relatively low accuracy of stem-leaf segmentation owing to its curved stem (Fig.6e),and the error of stem position was relatively large.Fig.8 shows the accuracy of extraction for individual height,crown width and leaf area.The extracted individual height was very close to the manually measured ground truth with high correlation (R2>0.99) and low error(RMSE <0.004 m) (Fig.8a).For crown width,the RMSE increased as the accuracy of individual maize segmentation decreased.The extracted crown width for the completely segmented 18 individual plants exactly matched the ground truth (Fig.8b).Errors in leaf area were dependent on the completeness of the LiDAR scanning and individual maize plant segmentation.For example,two leaves of the plant with ID 40 (Fig.6f) had been missed in the scanned data owing to occlusion and the corresponding accuracy of leaf area was relatively low.Overall,the method achieved a R2of 0.8557 and a RMSE of 0.0504 m2for leaf area estimation(Fig.8c).

Table 2 Accuracy assessments of segmentation results.

Table 3 Accuracy assessment for the extraction of stem position.
5.Discussion
5.1.Organ and individual plant segmentation
Organ segmentation is an essential part of organ-level phenotypic trait extraction from field terrestrial LiDAR data.Most existing methods rely on a series of user-defined thresholds and customized features,and focus on the construction of empirical rules to segment organs [34,46,47].The method based on vertical point density (VPD) [46] assumes that the VPD of the stem is necessarily greater than that of the leaf,and uses a threshold to distinguish between stem and leaf.However,VPD is greatly influenced by plant size,leaf number,leaf angle,and overlap degree,so that this assumption is not necessarily satisfied across different plants.Moreover,the threshold needs to be carefully tuned for each plant,and it is commonly very hard to find a universal VPD threshold to extract stems while excluding leaves effectively for all plants.The median normalized-vector growth (MNVG) algorithm [34] constructs a series of geometric constraints to identify the stems of single maize plants.It can deal with the point cloud of an individual plant,but cannot segment field LiDAR data containing numbers of plants of different sizes.Moreover,the MNVG algorithm faces challenges when the spatial distribution characteristics of stems and leaves do not meet the predefined geometric constraints.A previous study [45] developed a 3D voxel-based CNN to segment organs from the point cloud of a single maize plant,but requires pre-processing of individual plant segmentations and cannot handle field LiDAR data directly.Additionally,the conversion frompoint cloud to 3D voxels inevitably leads to the loss of spatial information.By contrast,the proposed method can directly segment stems from field terrestrial LiDAR data that contains numbers of maize plants of different sizes and shapes.It uses a point-based CNN rather than a series of user-defined thresholds and empirical rules to segment stems and leaves.There is only one free parameter in the refinement of stem-leaf segmentation: the stem radius,which can be easily determined by visual evaluation or prior knowledge of the study area.Because the proposed method does not involve complicated threshold tuning,and yields accurate results,it may be a better choice than existing methods for stem-leaf segmentation.
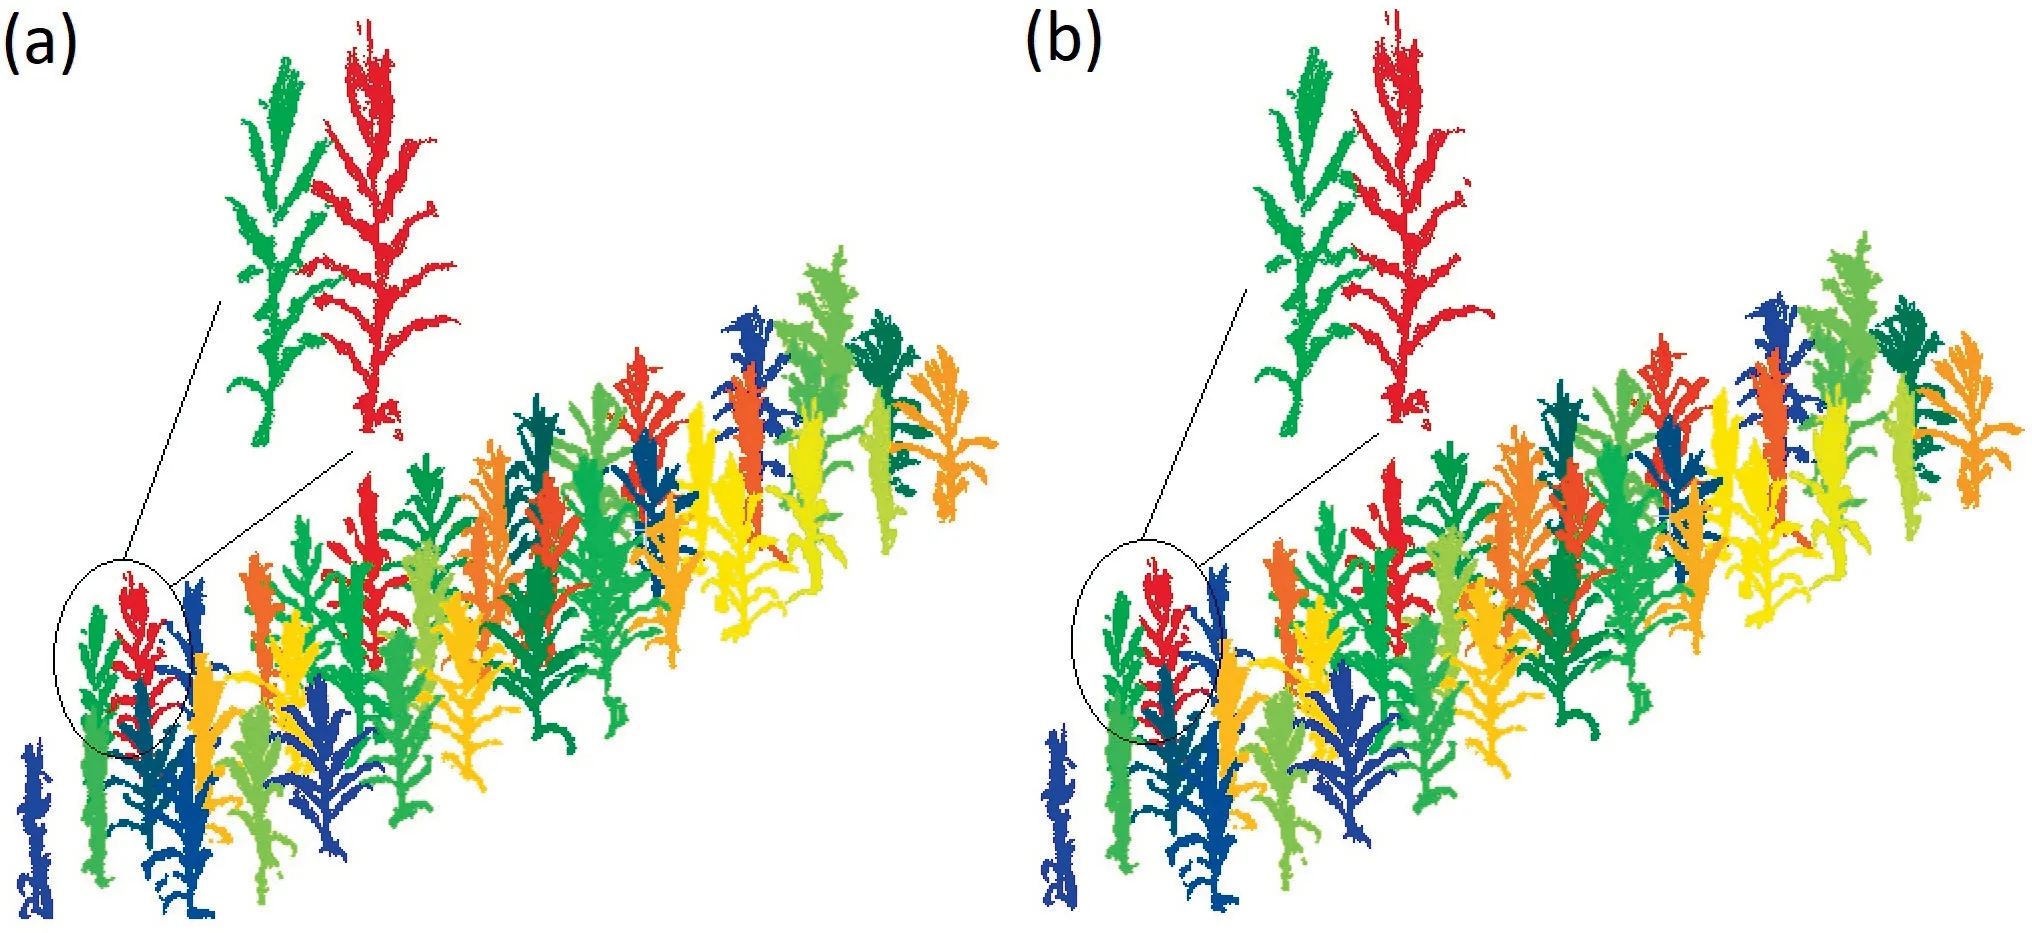
Fig.7.Comparison between(a)ground truth and(b)individual maize segmentation results obtained by the proposed method.Points in different individual plants are shown in different colors.

Fig.8.Correlations between the phenotypic trait estimated by the proposed method and the ground truth:(a)the individual plant height,(b)crown width,and(c)leaf area.
Although the individual maize segmentation is based on the stem-leaf segmentation results,its accuracy does not depend critically on the accuracy of stem-leaf segmentation.This is owing to the reliable morphological character-based rules for assigning leaf clusters.In this rule,isolated individual plants can be easily segmented once their stems are roughly determined and the segmentation results of overlapped plants depend only on the accuracy of the stem position.Given that all stem instances are successfully extracted and the error of stem position is small (0.0141 m),the proposed rules produce accurate results in individual maize segmentation.There are two thresholds to be tuned in the algorithm:the radius Rnghbrfor neighbor searching and the minimum number of neighbors Nnghbrfor core point identification.We evaluated the influences of various thresholds on the segmentation results(Fig.9).The Rnghbrwas evaluated in the range of [0.02,0.06] with an increment of 0.005,and the Nnghbrwas evaluated in a range of the 5th,10th....40th percentiles of number of neighbors for all points.This sensitivity analysis showed that the change of Rnghbrwith constant Nnghbrhas little influence on the results,whereas the change of Nnghbrwith constant Rnghbrcan strongly influence the accuracy.Because Nnghbris used to differentiate noise from core points,we recommend that it be set to the 5th to 15th percentile of local densities for all points.
Previous studies [34,46,47,60] have demonstrated that point density and plant height are influential factors for stem-leaf separation and individual plant segmentation methods.The proposed method down-sampled the original point cloud into 2048 points and used the down-sampled data for PointCNN model training and prediction.In the terrestrial LiDAR point cloud,the number of points for a maize plant is usually much >2048 points,which means that the method is applicable in fields with varying point densities.In addition,the training data was rotated and scaled in a wide range to simulate maize plants with different height,which can effectively improve the robustness of the model to plant height.Since the maize individuals are planted irregularly,the planting density varies across the study area.As a result,input samples of the PointCNN model may include no stem instance or more than one stem instance.Still,the PointCNN can accommodate these situations and produce satisfactory stem-leaf separations.Although planting density has little influence on the stem-leaf separation results,it can strongly affect the accuracy of individual maize segmentation.A major reason is that the number of overlapping leaves tend to increase with planting density.We adopted a straightforward strategy to segment the overlapped leaves from adjacent plants:cutting them off in the middle.This strategy helps to reduce the number of free parameters and avoid complicated threshold tuning,but sacrifices segmentation accuracy to some extent.Our use of a 3D cylinder to extract stem points from the original point cloud may encounter problems when the stem grows with a degree of curvature.A skeleton-based method [46]may be helpful for the extraction of curved stems and the refinement of overlapping leaf segmentation,and merits further investigation.Although we used only a single cultivar of maize to train the PointCNN model,it can also handle the semantic segmentation of the other maize cultivars without change because the shapes of maize stems and leaves are similar among cultivars.The types of maize organs vary with different growth stages.In this study,the PointCNN model was trained using maize data acquired at the vegetative stage which included only stems and leaves.The presence of other types of organs (such as ears) would complicate the semantic segmentation of maize plants in the reproductive stages.It is likely that PointCNN would require additional training for application to maize plants at other growth stages.
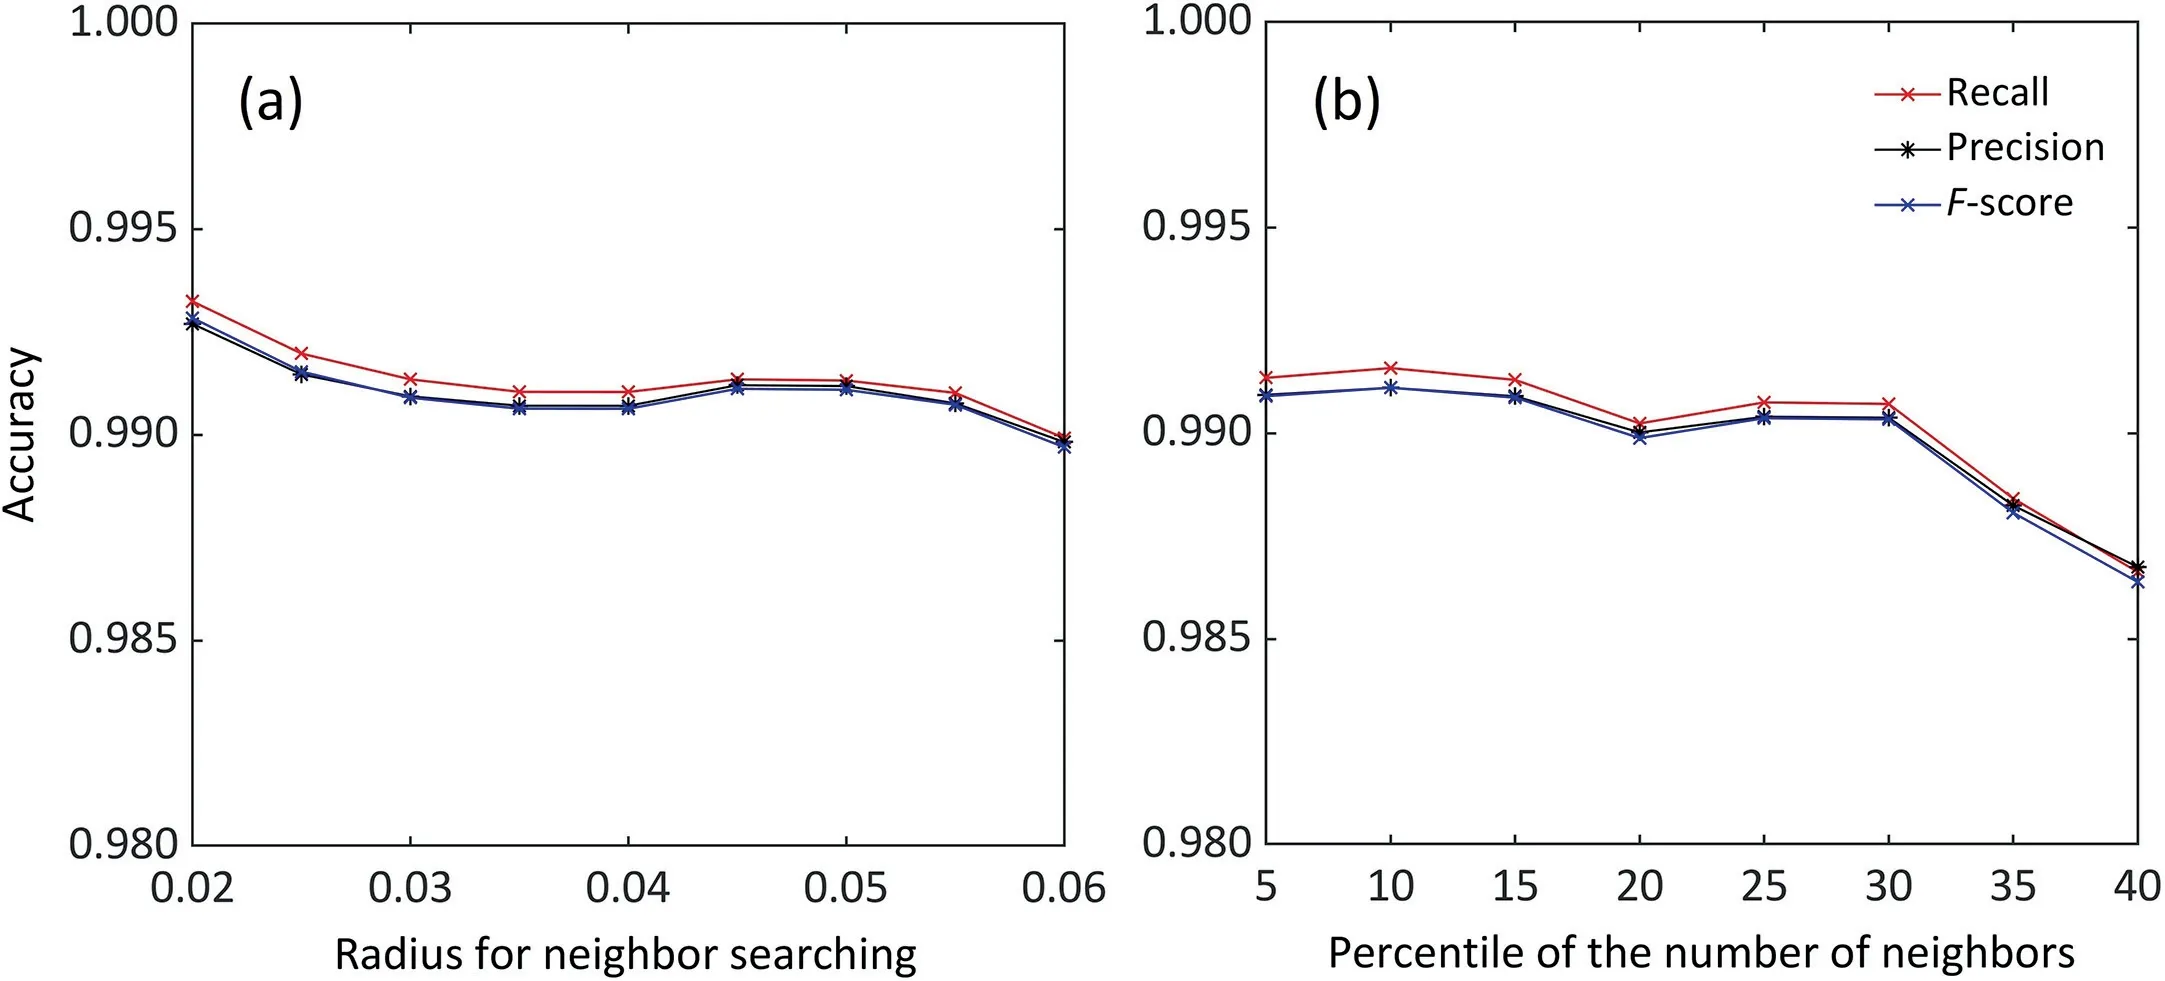
Fig.9.Analysis of sensitivity to parameters.(a)The change of Rnghbr with constant Nnghbr equal the 5th percentile of number of neighbors for all points.(b)The change of Nnghbr with constant Rnghbr of 0.03 m.
5.2.Phenotypic trait extraction
One discovery of interest in this study is the effectiveness of terrestrial LiDAR for phenotyping at both organ and individual plant levels in field environments.All stems were successfully segmented,and the stem position was extracted with a mean error of 0.0141 m.This accuracy can fulfill the need of evaluating group parameters such as planting density and total number of plants,thus showing high potential or agricultural management.The high correlations between the reference and derived plant height (R2>0.99),crown width(R2>0.90),and leaf area(R2>0.85)allow to investigate plant structural and functional phenotypes in a high-throughput way,which is of vital importance for linking plant genomics and environmental parameters.However,there are still some limitations in the present study.The derived maize leaf area was slightly underestimated relative to the ground truth,a finding for which we suggest two explanations.First,leaves are very hard to scan in the field environment owing to occlusion,and the incomplete scans may introduce errors in LiDAR-derived leaf area.Second,the difficulties in cutting off overlapping leaf clouds also influence leaf area estimation.Recent advances in deep learning [61,62] have shown potential for phenotypic analysis such as counting maize stems and tassels.Leaf-area extraction will benefit from new deep learning-based models that are more robust to noise and incomplete scans.
6.Conclusions
This study developed a two-stage method able to segment organs (stems and leaves) of individual maize plants using field terrestrial LiDAR data.In the first stage,stem points were extracted using the PointCNN model and stem instances were defined by fitting 3D cylinders to the extracted stem points.In the second stage,LiDAR point clouds were segmented into individual plants according to the local point densities and 3D morphological structures of maize plants.The method achieved high accuracy in both component segmentation (F-score=0.8207) and plant segmentation (Fscore=0.9909).The accuracies were robust to different heights,leaf numbers,and point densities.The effectiveness of terrestrial LiDAR for phenotyping at the organ (including leaf area and stem position) and individual plant (including individual height and crown width)levels in field environments was evaluated.Comparisons between the LiDAR-derived phenotypic traits and ground truth demonstrated that the proposed method extracts accurate information for high-throughput phenotyping from terrestrial LiDAR data and provides helpful information for potential analysis of the relationship between genotypes,environmental conditions and phenotypes.The implementation code and test data may be publicly accessed in GitHub (https://github.com/sysu-xin-lab/Corn_segmentation).We welcome researchers and scholars to further evaluate and improve the proposed method.
CRediT authorship contribution statement
Zurui Ao:Methodology,Investigation,Writing -original draft.Fangfang Wu:Investigation.Saihan Hu:Investigation.Ying Sun:Methodology.Yanjun Su:Methodology.Qinghua Guo:Methodology.Qinchuan Xin:Writing -review &editing.
Declaration of competing interest
The authors declare that they have no known competing financial interests or personal relationships that could have appeared to influence the work reported in this paper.
Acknowledgments
This research was supported by the Strategic Priority Research Program of the Chinese Academy of Sciences (XDA24020202),the National Key Research and Development Program of China(2017YFA0604300),the National Natural Science Foundation of China (U1811464 and 41875122),the Western Talents(2018XBYJRC004),and the Guangdong Top Young Talents(2017TQ04Z359).
- The Crop Journal的其它文章
- Assessing canopy nitrogen and carbon content in maize by canopy spectral reflectance and uninformative variable elimination
- Leaf pigment retrieval using the PROSAIL model:Influence of uncertainty in prior canopy-structure information
- The continuous wavelet projections algorithm: A practical spectral-feature-mining approach for crop detection
- Field estimation of maize plant height at jointing stage using an RGB-D camera
- Quantifying the effects of stripe rust disease on wheat canopy spectrum based on eliminating non-physiological stresses
- Estimation of spectral responses and chlorophyll based on growth stage effects explored by machine learning methods

