沉积物磷形态空间分布特征及释放风险评估——以沱江流域为例
唐金勇,尹月鹏,曹 熙,张 瑜,张 雯,3*
沉积物磷形态空间分布特征及释放风险评估——以沱江流域为例
唐金勇1,2,尹月鹏1,2,曹 熙1,2,张 瑜1,2,张 雯1,2,3*
(1.成都理工大学生态环境学院,四川 成都 610059;2.国家环境保护水土污染协同控制与联合修复重点实验室(成都理工大学),四川 成都 610059;3.地质灾害防治与地质环境保护国家重点实验室(成都理工大学),四川 成都 610059)
为阐明沉积物磷赋存形态的空间分布特征及潜在释放风险,提供更准确合适的风险评估指标, 分析了沱江干流及其支流12个样点表层沉积物的磷赋存形态,测定了水溶性磷(WSP)及磷平衡浓度(EPC0),计算沉积物磷吸附指数(PSI)、磷吸附饱和度(DPS)及其衍生的磷释放风险指数(ERI).结果表明,沉积物5种形态磷含量顺序为:铁/铝结合磷(CDB-P,60.63%)>钙磷(Ca-P,30.84%)>有机磷(OP,3.92%)>亚铁磷(Fe(Ⅱ)-P,3.48%)>松散态磷(Loosely-P,1.13%).CDB-P是沉积物磷的主要存在形态(0.468~2.287mg/g),由上游至下游逐渐降低,这主要与上游工业污染有关.DPS、EPC0和PSI在空间分布上均呈现由上游至下游逐渐增大的趋势,变化范围分别为44.28%~80.39%、0.012~0.084mg/L和0.153~1.526L/g;上游大部分采样点ERI均超过了25%;各指标综合表明:上游存在较高的磷释放风险.回归分析与相关性表明,EPC0与上覆水磷、CDB-P、OP、有机质(OM)以及粒径均呈极显著相关性,且相关性远高于其他指标(ERI,DPS,PSI,WSP).因此,EPC0是评估沱江流域沉积物磷释放风险潜力更准确高效的指标,Fe/Al含量、粒径的增加以及有机质的减少会增加磷释放风险,因此应控制工业污染以及农业面源污染的输入.
磷形态;空间分布;磷平衡浓度;磷释放风险
沉积物是水生态系统中磷库的重要组成部分,其作为营养盐的“源”与“汇”[1],同时又是磷迁移转化、再生的主要场所.磷是水体富营养化的重要限制因子[2-3],当湖泊、河流等水体外源磷负荷减少,内源磷负荷可能阻止其水质好转[4],并且成为水质恢复延缓的重要原因之一[5].同时,沉积物中磷的不同形态影响磷的生物有效性[6],因此研究沉积物中磷形态含量和变化特征,有助于了解河流污染程度及地球化学信息[7].改进的SEDEX沉积物磷形态分离方法[8]将沉积物中的磷形态分为松散态磷(Loosely- P)、亚铁磷(Fe(II)-P)、铁/铝结合磷(CDB-P)和有机磷(OP)5种形态.该方法能将Fe(II)结合的磷单独提取,研究表明,缺氧沉积物结合磷的潜力归因于Fe(II)相的出现,它们与磷直接相互作用形成Fe(II)磷酸盐相,因此将Fe(II)-P分馏为一个独立的磷组分,对获取沉积物中磷的地球化学信息具有重要意义.
此外,国内外学者对沉积物中磷的污染分布及风险评价进行了大量的研究,而对于沉积物磷释放风险评价指标没有统一的体系标准[9].目前,磷吸附指数(PSI)和磷吸附饱和度(DPS)常被用来表征土壤磷吸附容量[10-11].除此之外,水溶性磷(WSP)因其测试方法简单快速也被用来评估土壤磷释放风险[12].磷平衡浓度(EPC0)是指沉积物固相与周边水溶液中的磷酸盐(SRP)达到吸附与解吸平衡时,水相中磷酸盐的浓度[13-14].EPC0值越高,沉积物向水柱释放磷的风险越大[13],广泛用于沉积物而日益受到大家的关注.研究表明,EPC0和生物有效磷存在明显的相关性,EPC0越高,往往生物有效磷也越高,对评价沉积物磷释放风险有一定的参考价值[15],因此沉积物充当水体磷“源”或“汇”的功能可由EPC0估计.
本研究以四川省沱江流域(绵远河新源大桥至流滩坝水电站,104°25′~105°23′E,28°55′~31°13′N)为研究对象,系统分析了沉积物的磷赋存形态及其含量的空间分布特征,分析了EPC0和ERI等指标,旨在深入揭示沉积物磷吸附行为的变化特征及其环境意义,阐明磷释放风险,为其提供最佳的沉积物磷释放风险评估指标.
1 材料与方法
1.1 样品采集与处理
根据沱江流域水系特点,选择了12个均匀分布于沱江上中下游具有代表性的点位(图1).采用彼得森抓斗式采泥器采取表层沉积物,采集后将样品置于密封的聚乙烯塑料袋中,一部分于4℃左右储存在实验室用于沉积物磷赋存形态及EPC0的测定,另一部分于-20℃下冷冻干燥研磨后储存于干燥器以待后续实验分析.

图1 采样点分布
1.2 实验方法
1.2.1 理化性质测定 上覆水理化指标,包括pH值、DO,在现场用YSI多参数水质分析仪测定,流速采用流速仪测定,其他指标低温保存带回实验室分析.沉积物pH值采用pH计测定,氧化还原电位(h)采用电极法测定;含水率(WC)于105℃下干燥测定[16];有机质(OM)采用烧矢重法测定[17];粒径采用激光粒度分析仪(Mastersizer 2000)测定,并将其分为3类:黏粒(0~0.002mm)、粉粒(0.002~0.02mm)和砂粒(0.02~2mm)[18].
1.2.2 沉积物磷赋存形态的测定 使用改进的SEDEX法[8]将沉积物中的磷分为:松散结合磷(Loosely-P)、亚铁磷(Fe(II)-P)、铁/铝结合磷(CDB-P)、钙磷(Ca-P)和有机磷(OP)5类(图2).提取液中溶解磷酸盐使用钼锑抗分光光度法测定[19].沉积物总磷(TPS)为5种形态磷之和.
1.2.3 等温吸附实验 EPC0的测定基于磷等温吸附线.约1g(按干重)样品分别与20mL含有浓度为0.0,0.5,1.0,5.0,10.0,15.0,25.0,50.0,75.0mg/L的磷酸盐标准溶液(如KH2PO4)一起放入50mL聚乙烯离心管中(用于测定EPC0的新鲜沉积物需保证在7d内分析,以减少样品变质[20])恒温[(25±1)℃]下振荡24h以达到平衡[21].通过测定滤液的磷浓度(EPC)与初始磷浓度的差值计算磷吸附量(SP).磷吸附等温线由SP和EPC作图得到.

图2 SEDEX法流程
1.2.4 水溶性磷(WSP)浓度测定 称取约1g(按干重)样品于50mL含有25mL蒸馏水的聚乙烯离心管中,恒温(25±1)℃下振荡24h,离心后取上清液,测定滤液中磷酸盐浓度,即为WSP[22].
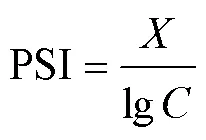
1.2.5 磷吸附指数(PSI)[23]磷吸附指数计算公式如下:

式中:PSI表示磷吸附指数,L/g;和分别表示1g沉积物于含有75mg P/L的20mL磷溶液在振荡24h达到平衡后溶液中磷的吸附量和磷平衡浓度, mg/g,mg/L.
1.2.6 磷吸附饱和度(DPS)[24]磷吸附饱和度计算公式如下:

式中:DPS表示磷吸附饱和度,%;TPS为沉积物总磷含量, mg/g;SPmax为沉积物最大磷吸附量, mg/g,由1.2.3得出.
1.2.7 磷释放风险指数(ERI) 用黄清辉等[25]提出的ERI来评估沉积物中磷的释放风险,计算公式如下:

式中: ERI为磷释放风险指数,%;DPS为磷吸附饱和度,%;PSI为磷吸附指数,L/g.
1.3 数据处理
运用Excel和Origin对数据进行处理和图表绘制,采用IBM SPSS Statistics22(IBM,USA)进行数据的Pearson相关性分析.
2 结果与讨论
2.1 上覆水与沉积物理化性质分析

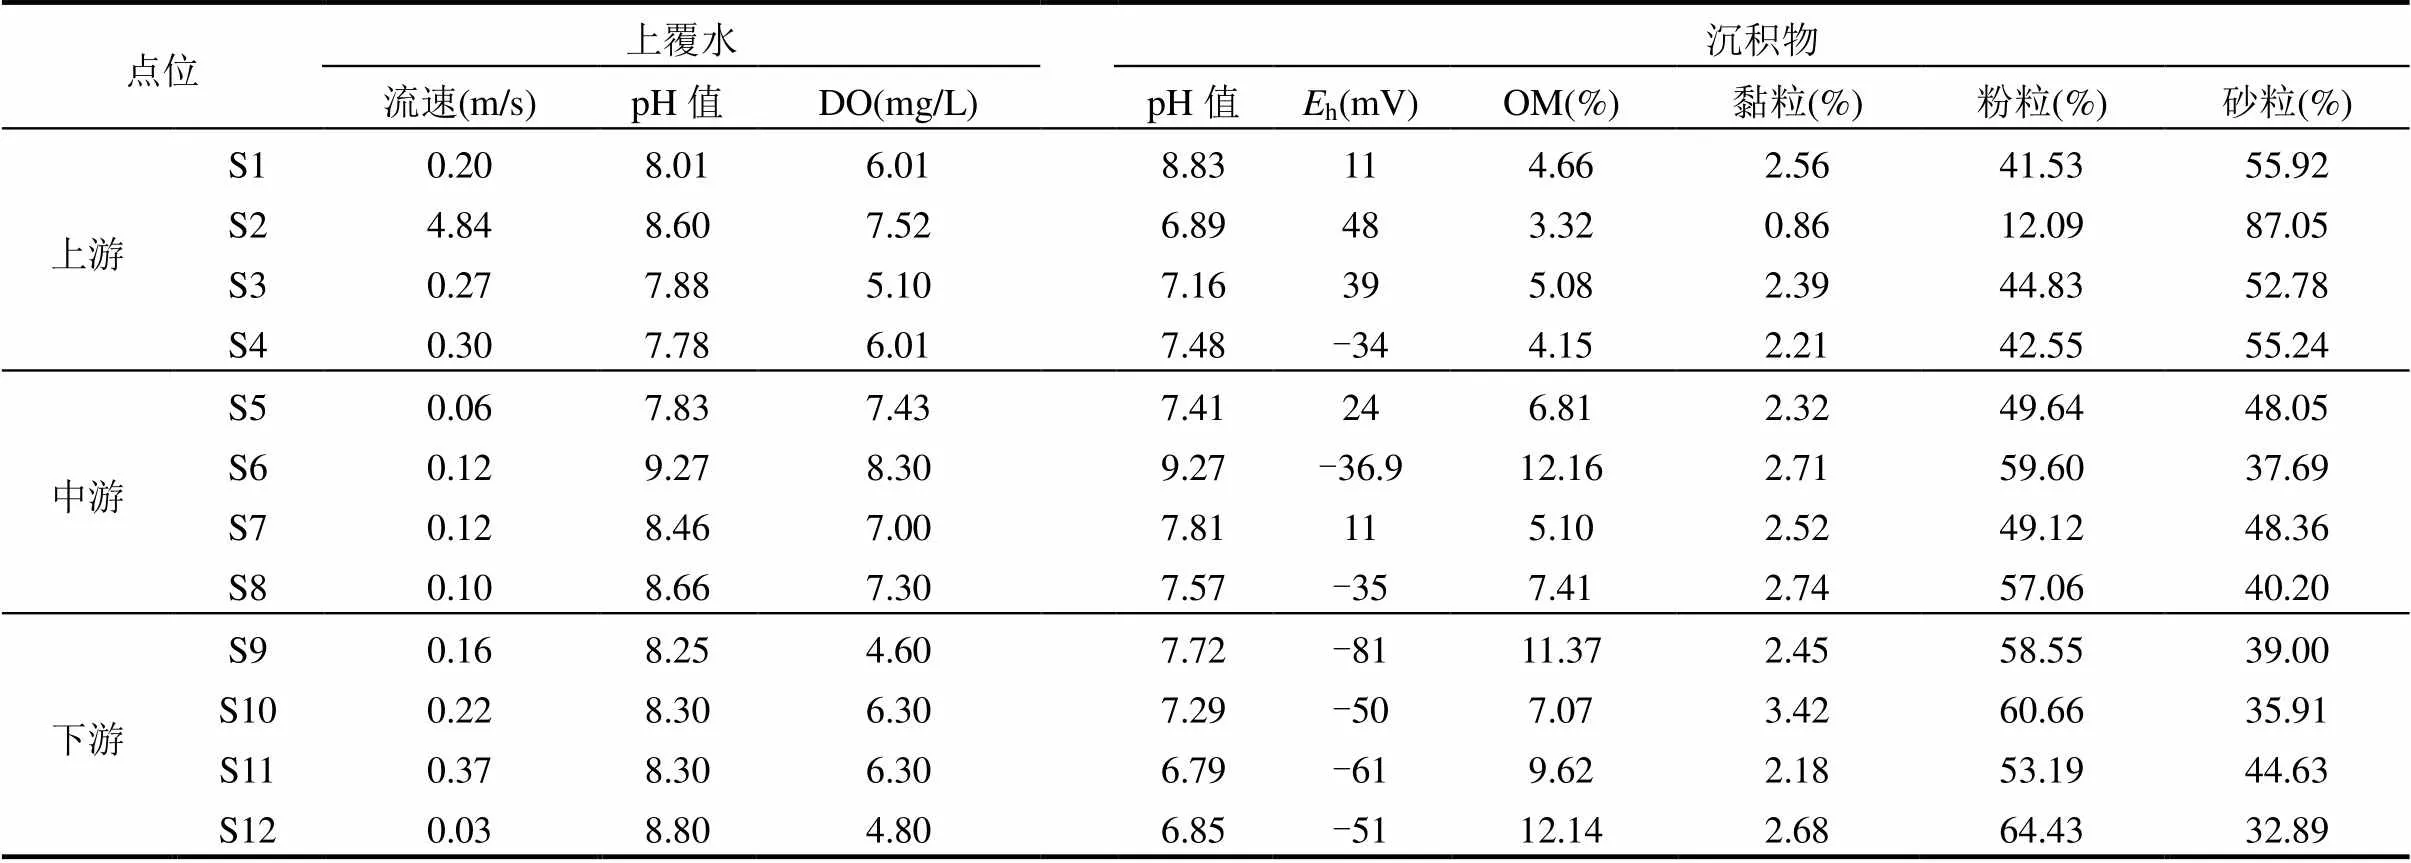
表1 上覆水和沉积物的理化性质
注:DO为溶解氧;h为氧化还原电位;OM为有机质.
由表1可知,流域上覆水的pH值呈中性偏碱(7.78~9.27).水体DO含量变化范围为4.60~8.30mg/ L.沉积物pH值整体呈中性偏弱碱性(6.79~9.27),氧化还原电位(h)变化范围为-81~48mV,沉积物呈现弱缺氧状态.从上游至下游沉积物细颗粒(黏粒+粉粒)呈现增加的趋势,其平均值分别为37.26%, 56.43%和61.89%,这可能因为上游流速(平均值为1.40m/s)比中下游(平均值分别为0.1, 0.19m/s)湍急.沉积物OM平均含量为7.41%(3.32%~12.16%),空间分布呈现:上游(4.3%)<中游(7.87%)<下游(10.05%).上游OM含量分布均匀(3.32%~5.08%),中游S6处于干流上游,地处成都-资阳市界处,导致其OM含量高达12.16%.下游S12处OM含量出现最大值,高达12.14%,该处水库水体流动性较差,为OM的沉降和富集创造了有利条件.OM在空间上呈现出高度的差异性,与不同区域的污染程度以及沿程筑坝对OM的滞留有关.
2.2 上覆水与沉积物磷形态空间分布特征
上覆水总磷(TPw)、溶解态总磷(DTP)和溶解反应磷(SRP)均表现为从上游至下游降低的趋势(图3),变化范围分别为0.08~0.23, 0.05~0.21和0.01~ 0.07mg/L.上游水体磷含量较高,与上游工业、城市点源污染以及农业面源污染有关,TPw最大值出现在上游S1点位,这可能是由于附近农田以及污水处理厂的排放.此外,一般认为,当TPw浓度达到0.02mg/L时,水体有可能会出现藻华[26].在本研究中,发现所有点位的TPw浓度均超过了这一临界浓度,因此需要相关的措施来改善水中磷污染情况.

图3 上覆水磷含量及空间分布
沉积物总磷(TPs)为1.84mg/g(0.84~2.85mg/g),空间上表现为:上游(2.45mg/g)>中游(1.12mg/g)>下游(1.12mg/g),TPs最大值出现在上游S1采样点,最小值出现在下游S9采样点(图4).由于流域上游土地利用类型以旱地、水田居多,沿河畜禽、水产养殖发达,农药化肥及饲料使用频繁,且污水收集处理设施不健全(如采样点S2与S4均处于城镇下游).与世界各地TPs含量(法国克鲁兹河[27]:0.51~2.29mg/g;美国卡莱尔湖[28]:0.14~1.60mg/g;黄河[29]:0.20~0.75mg/g)相比,沱江流域TPs含量均高于以上研究区域,特别是上游河段.同时,TPs浓度沿程降低,除河流水体磷的自然沉降过程外,梯级筑坝对水体磷污染物的拦截作用也不可忽略[30],Wang等[31]将沉积物的污染水平根据总磷的含量分为3级,重污染水平:TPs>1.3mg/g;中等污染水平:0.5mg/g£TPs£1.3mg/g,轻度污染水平:TPs<0.5mg/g.本研究中TPs平均含量为1.84mg/g,远超沉积物重污染1.3mg/g水平线,并且TPs与TPw的空间分布相似,这表明沉积物中的磷有向上覆水体二次释放的趋势.

图4 沉积物各形态磷的相对含量

图5 沉积物磷含量及空间分布

图6 各评价指标空间分布
沉积物各形态磷在采样点之间存在显著差异(图5),说明人类活动对流域的影响.各形态磷含量占总磷百分比为:CDB-P(60.63%)>Ca-P(30.84%)>OP (3.92%)>Fe(Ⅱ)-P(3.48%)>Loosely-P (1.13%).CDB- P是沉积物磷形态的主要组分,主要指由铁、铝等金属(氢)氧化物结合的磷,并能与OH-及有机配体进行交换.因此,CDB-P很容易在碱性条件或还原环境下转化为溶解态磷[32-33]而释放到上覆水中,最终使水质恶化.本研究中.CDB-P含量为0.468~2.287mg/g,从上游(1.648mg/g)至中游(1.268mg/g)、下游(0.557mg/g)平均含量逐渐降低,推测上游来水磷负荷输入(S2、S3和S4点处的工业和生活污水)是影响沱江沉积物CDB-P含量的主要原因.
Ca-P主要是由自生磷灰石或碎屑岩等陆源输入形成的一种稳定态磷,由沉积物向上覆水释放的可能性较小,受人类活动影响不大.沉积物Ca-P含量空间变化与TPs一致,由上游(0.688mg/g) 逐渐降低至下游(0.422mg/g).沱江水体pH值总体偏碱性(7.78~9.27),上覆水中钙离子容易吸附上覆水中的磷酸盐从而形成Ca-P[34],导致在外部磷输入较高的上中游沉积物中Ca-P含量比较高.
沉积物中的OP一般认为来自水生动植物残体和农业化肥,而其中一部分OP为不稳定磷,容易随沉积物有机物的分解矿化转化成无机磷向上覆水中释放.本研究沉积物OP含量变化范围为0.019~ 0.076mg/g,其空间变化与OM一致,这与水生植物及周边农作物残体冲入至中下游区域有关.
Fe(Ⅱ)-P指沉积物中与磷相互作用形成的Fe(II)磷酸盐相,是沉积物中重要的磷组分.沉积物中Fe(II)-P的稳定性对pH值、h、离子强度和天然配体等环境因素高度敏感[35-36].尽管沱江沉积物中Fe(Ⅱ)-P含量为0.034~0.111mg/g,在整个磷组分占比较低(3.48%),但随着pH值和h的降低,Fe(II)-P极易向上覆水中释放,特别是在表层沉积物中[37-38],因此它在沉积物当中也是一种不可忽略的磷组分.
Loosely-P作为无机磷重要的形态之一,用于浮游植物的消耗和生产循环,极易由沉积物向上覆水体释放,其释放量主要取决于沉积物中的环境条件(如pH值、温度、水动力学和h).Loosely-P是本研究中含量最低的磷组分,变化范围为0.007~ 0.030mg/g,在温度升高或扰动条件下容易向上覆水中释放.由于各种形态磷(Loosely-P、Fe(Ⅱ)-P、CDB-P)的生物不稳定性,因此需要高度关注这些形态的磷.
2.3 流域沉积物磷释放风险评估
当EPC0大于SRP时,沉积物表现出释放磷的趋势,反之为吸附磷[39].本研究EPC0含量为0.012~ 0.084mg/L,上中下游平均值依次为0.069, 0.033和0.024mg/L.从空间分布来看,上游EPC0较高(图6),并且其值均高于SRP,上游水体磷含量较高,导致沉积物-水界面达到磷吸附/解吸平衡时的EPC0值就越高.
ERI可将富营养化风险细分为高度风险(ERI>25%)、较高风险(20% 图7 上覆水磷含量与各指标线性回归分析(n=12) DPS是反映沉积物中磷吸附量占总磷吸附量百分比的指标,可用于评价沉积物对磷的吸附能力[42].一般认为,较低的DPS表明沉积物中的磷吸附位点尚未饱和,沉积物具有较高的磷吸附能力[43],同时表明沉积物作为“汇”的可能性较大.本研究沉积物的磷吸附饱和度(DPS)为44.28%~80.39%,平均值为上游(73.71%)>中游(63.92%)>下游(54.17%),最大值在S1,最小值在S11,从空间分布上来看,上游DPS高于中下游,是由于上游污染源较多,沉积物累积了大量的外源磷输入.其次,与我国闽江[41](7.30%~18.29%)相比,沱江流域DPS总体偏高,因此表明其沉积物具有较小的磷吸附能力和潜在的磷释放风险. PSI表示可溶性磷酸盐的固定能力,代表沉积物对磷的缓冲能力,一般随着沉积物含量的增加而增加[44-45].本研究中,沉积物PSI为0.153~1.526L/g,空间变化与DPS相反,由上游至下游依次增加(平均值分别为0.208, 0.389, 0.727L/g),最大值出现在S9,最小值出现在S2,这是由于上游细颗粒相对较少,对磷的吸附能力较弱.另一方面,上游OM含量相对较低,而OM在一定程度上能很好的与磷络合,并将其固定在沉积物中. WSP主要是用蒸馏水可提取的磷,其值越高,表明磷的释放风险就越高[46].已有研究将该指标运用于土壤磷的流失风险分析,对沉积物而言,WSP作为生物可利用磷而极易向上覆水中释放.本研究WSP含量为19.294mg/L(9.496~26.190mg/L),表现出上游 >中游>下游的空间分布特征.上游细颗粒和OM含量占比较低,导致沉积物吸附的磷呈弱吸附态[47],极易向上覆水体释放. 通过以上各指标的综合分析,表明沱江流上游沉积物具有较高的磷释放风险. 如图7所示,相比ERI、DPS、PSI和WSP,EPC0与水中各形态磷相关性均最好,且EPC0与SRP的相关性(2=0.918,<0.001)显著高于TPw(2=0.591,<0.05)和DTP(2=0.716,<0.05),表明EPC0能有效并准确地评估沱江流域沉积物-水界面磷吸附-解吸状态,而DPS、PSI由于从沉积物饱和度和吸附能力去表征,没有考虑磷的释放风险[48],并且ERI作为磷释放风险评价指标在国内外应用并不广泛.此外,通过比较EPC0和SRP,可以估算沉积物向水柱释放SRP的潜能,当水中SRP的浓度高于EPC0值时,沉积物表现出吸附磷的趋势,反之为释放磷.EPC0越大,则释放风险越高[49],进一步对比分析上覆水中的SRP和EPC0浓度(图8),上游EPC0均大于SRP,可能暗示上游沉积物磷释放风险更大. 图8 EPC0风险评估示意 黑色箭头表示沉积物向上覆水释放磷:EPC0>SRP,灰色箭头表示沉积物吸附磷: EPC0 如表2所示:EPC0与CDB-P、OP、OM、粉粒和砂粒均存在极显著的相关性,且相关性高于其他指标,表明沉积物磷释放行为与这些组分密切相关. EPC0与CDB-P的极显著正相关性(=0.78,<0.01)表明CDB-P是可能增加沉积物磷释放风险的主要磷组分.一般来说,(氢)氧化物对铁、铝有很强的吸附能力,CDB-P可与OH-及其他在碱性条件下可溶解的无机磷化合物交换.CDB-P为本研究主要的磷形态之一,因此很容易受到环境的改变向上覆水中释放.而铁结合磷会随着pH值的降低更多地向上覆水中释放,随后被初级生产者消耗[50].此外,当氧气充足时,磷会被三价铁吸收,但如果水处于缺氧状态,三价铁会还原为二价铁,导致磷和铁从沉积物中释放出来[38]. EPC0与OP、OM的极显著负相关性(分别为-0.803、-0.746,<0.01)表明,OM对沉积物OP的吸附释放有很大的影响.OP因分解缓慢而较为稳定,与大型植物、浮游植物和陆生有机碎屑的沉积关系更密切[51],OM中的腐殖质可以形成胶膜粘覆在粘土矿物、铁、铝氧化物以及碳酸钙等无机物内外表面,形成无机有机复合体,成为沉积物-水界面对磷迁移转化的重要自然胶体.此外,OM释放的氢离子可使矿物表面基团质子化而有利于磷的吸附,并且腐殖质能和铁/铝等矿物形成有机或无机复合体,提供了重要的磷吸附位点,从而增强了对磷的吸附[52],不易向上覆水中释放.综上表明:OM组分的增加将降低沱江沉积物OP的释放风险[53]. 此外,EPC0与粉粒、砂粒也呈极显著相关性(分别为-0.727、0.719,<0.01).粒径是影响沉积物磷释放的重要因素,砂粒具有典型的很低的磷吸附点位,因为它的非晶态铁和铝浓度较低[54],吸附在上面的磷也容易向上覆水中释放. 表2 理化参数间的相关性分析(n=12) 注:**在0.01级别(双尾),相关性显著;*在0.05级别(双尾),相关性显著. 3.1 研究区TPw、DTP和SRP含量为分别为0.08~ 0.23, 0.05~0.21和0.01~0.07mg/L.水体污染程度呈现上游>中游>下游的空间分布特征,这可能是由于上游污染源较多,外源磷输入导致水体总磷含量较高. 3.2 研究区TPs含量为0.84~2.85mg/g,空间分布呈现由上游向下游递减的趋势,上游TPs污染表现为重度污染(2.45mg/g).沉积物各形态磷含量为: CDB-P(60.63%)>Ca-P(30.84%)>OP(3.92%)>Fe (Ⅱ)-P(3.48%)>Loosely-P(1.13%),在水平空间分布上,CDB-P与TPs空间变化趋势一致,这主要与上游工业污染有关,表明沉积物吸附的磷主要以CDB-P的形式贮存在沉积物中,并且其含量越高,越容易向上覆水中释放. 3.3 由EPC0、ERI、DPS、PSI和WSP综合评估,沱江流域上游沉积物表现为较高的磷释放风险. EPC0与SRP、CDB-P、OP、OM以及粒径均呈极显著相关性(2分别为0.918, 0.780, -0.803, -0.746),且相关性远高于其他指标(ERI,DPS,PSI, WSP),因此,EPC0是评估沱江流域沉积物磷释放风险潜力更准确高效的指标.同时,EPC0与CDB-P、砂粒的极显著正相关性,并与OP、OM、砂粒的极显著负相关性表明了沱江流域沉积物磷主要受到Fe/Al金属(氢)氧化物、OM及粒径的控制.当Fe/Al含量和砂粒增加以及OM含量减少时,磷释放风险会显著增加,因此应控制工业污染以及农业面源污染的输入. [1] Sun C, Xiong W, Zhang W, et al. New insights into identifying sediment phosphorus sources in river-lake coupled system: A framework for optimizing microbial community fingerprints [J]. Environmental Research, 2022,209:112854. [2] Hamlin Q F, Kendall A D, Martin S L, et al. Quantifying landscape nutrient iinputs with spatially explicit nutrient source estimate maps [J]. Journal of Geophysical Research: Biogeosciences, 2020,125(2):5134. [3] Huang C, Lin Y, Hao Y, et al. Variation pattern of particulate organic carbon and nitrogen in oceans and inland waters [J]. Biogeosciences Discussions, 2018,15(6):1-34. [4] Tammeorg O, Nürnberg G K, Tõnno I, et al. Sediment phosphorus mobility in Võrtsjärv, a large shallow lake: Insights from phosphorus sorption experiments and long-term monitoring [J]. Science of the Total Environment, 2022,829:154572. [5] Kagalou I, Papastergiadou E, Leonardos I. Long term changes in the eutrophication process in a shallow Mediterranean lake ecosystem of W. Greece: response after the reduction of external load [J]. Journal of Environmental Management, 2008,87(3):497-506. [6] Bas V, Osté L, Schot P, et al. Forms of phosphorus in suspended particulate matter in agriculture-dominated lowland catchments: Iron as phosphorus carrier [J]. Science of the Total Environment, 2018, 631:115-129. [7] 余 成,陈 爽,张 路,等.坦噶尼喀湖东北部入湖河流表层沉积物中磷的形态和分布特征 [J]. 湖泊科学, 2017,29(2):9. Yu C, Chen S, Zhang L, et al. Phosphorus fractions and their spatial distribution in surface sediments of inflow rivers in the northeastern Lake Tanganyika [J]. Journal of Lake Sciences, 2017,29(2):9. [8] Gu S, Qian Y, Jiao Y, et al. An innovative approach for sequential extraction of phosphorus in sediments: Ferrous iron P as an independent P fraction [J]. Water Research, 2016,103(oct.15):352- 361. [9] 李文超,刘 申,刘宏斌,等.国内外磷指数评价指标体系研究进展[J]. 土壤通报, 2016,47(2):489-498. Li W C, Liu S, Liu H B, et al. Review on phosphorus indices as risk-assessment tools at home and abroad [J]. Chinese Journal of Soil Science, 2016,47(2):489-498. [10] Pan G, Krom M, Herut B. Adsorption desorption of phosphate on airborne dust and riverborne particulates in East Mediterranean Seawater [J]. Environmental Science Technology, 2002,36(16):3519- 3524. [11] Mcdowell R W, Sharpley A N. Phosphorus solubility and release kinetics as a function of soil test P concentration [J]. Geoderma, 2003,112(1):143-154. [12] Fischer P, Pöthig R, Gücker B, et al. Phosphorus saturation and superficial fertilizer application as key parameters to assess the risk of diffuse phosphorus losses from agricultural soils in Brazil [J]. Science of the Total Environment, 2018,630:1515-1527. [13] Taylor A W, Kunishi H M. Phosphate equilibria on stream sediment and soil in a watershed draining an agricultural region [J]. Journal of Agricultural Food Chemistry, 1971,19(5):827-831. [14] Barrow N J. A mechanistic model for describing the sorption and desorption of phosphate by soil [J]. Journal of Soil Science, 1983, 34(4):733-750. [15] Palmer-Felgate E J, Jarvie H P, Withers P, et al. Stream-bed phosphorus in paired catchments with different agricultural land use intensity [J]. Agriculture Ecosystems Environmental earth sciences, 2009,134(1/2):53-66. [16] Yin Y P, Zhang W, Tang J Y, et al. Impact of river dams on phosphorus migration: a case of the Pubugou Reservoir on the Dadu River in China [J]. Science of the Total Environment, 2022,809:151092. [17] 郑培儒,李春华,叶 春,等.镜泊湖沉积物各形态磷分布特征及释放贡献 [J]. 中国环境科学, 2021,41(2):883-890. Zheng P R, Li C H, Ye C, et al. Distribution characteristics and release contribution of different phosphorus forms in sediments of Jingpo Lake [J]. China Environmental Science, 2021,41(2):883-890. [18] Liao R, Hu J, Li Y, et al. Phosphorus transport in riverbed sediments and related adsorption and desorption characteristics in the Beiyun River, China [J]. Environmental Pollution, 2020,266:115153. [19] Watanabe F S. Test of an ascorbic acid method for determining phosphorus in water and NaHCO3extracts from soil [J]. Soil Science Society Proceedings, 1965,29(6):677-678. [20] Jarvie H P, Jürgens M, Williams R J, et al. Role of river bed sediments as sources and sinks of phosphorus across two major eutrophic UK river basins: the Hampshire Avon and Herefordshire Wye [J]. Journal of Hydrology, 2005,304(1-4):51-74. [21] Nair V D, Reddy K R. Phosphorus sorption and desorption in wetland soils [J]. Methods in Biogeochemistry of Wetlands, 2013,10:667-681. [22] Delgado A, Torrent J. Phosphorus forms and desorption patterns in heavily fertilized calcareous and limed acid soils [J]. Soil Science Society of America Journal, 2000,64(6):2031-2037. [23] Gao D, Chen G, Li X, et al. Reclamation culture alters sediment phosphorus speciation and ecological risk in coastal zone of Southeastern China [J]. Clean-Soil Air Water, 2018,46(11):1700495. [24] Pöthig R, Behrendt H, Opitz D, et al. A universal method to assess the potential of phosphorus loss from soil to aquatic ecosystems [J]. Environmental Science Pollution Research, 2010,17(2):497-504. [25] 黄清辉,王子健,王东红,等.太湖表层沉积物磷的吸附容量及其释放风险评估 [J]. 湖泊科学, 2004,16(2):97-104. Huang Q H, Wang Z J, Wang D H, et al. Phosphorus sorption capacity of the surface sediment in the Lake Taihu and risk assessment of phosphorus release [J]. Journal of Lake Sciences, 2004,16(2):97-104. [26] Sallade Y E, Sims J T. Phosphorus transformations in the sediments of Delaware's agricultural drainageways: I. Phosphorus Forms and Sorption [J]. Journal of Environmental Quality, 1997,26(6):1571- 1579. [27] Rapin A, Rabiet M, Mourier B, et al. Sedimentary phosphorus accumulation and distribution in the continuum of three cascade dams (Creuse River, France) [J]. Environmental Science Pollution Research, 2020,27(6):6526-6539. [28] Pearce A R, Chambers L G, Hasenmueller E. Characterizing nutrient distributions and fluxes in a eutrophic reservoir, Midwestern United States [J]. Science of the Total Environment, 2017,581:589-600. [29] Guan Q, Lei W, Wang F, et al. Phosphorus in the catchment of high sediment load river: A case of the Yellow River, China [J]. Science of the Total Environment, 2016,572:660-670. [30] Yin Y P, Zhang W, Tang J Y, et al. Impact of river dams on phosphorus migration: a case of the Pubugou Reservoir on the Dadu River in China [J]. Science of the Total Environment, 2022,809:151092. [31] Wang S, Jin X, Zhao H, et al. Phosphorus fractions and its release in the sediments from the shallow lakes in the middle and lower reaches of Yangtze River area in China [J]. Colloids Surfaces A Physicochemical Engineering Aspects, 2006,273(1-3):109-116. [32] Han H, Lu X, Burger D F, et al. Nitrogen dynamics at the sediment–water interface in a tropical reservoir [J]. Ecological Engineering, 2014,73:146-153. [33] Zhu Y, Wu F, He Z, et al. Characterization of organic phosphorus in lake sediments by sequential fractionation and enzymatic hydrolysis [J]. Environmental Science Technology, 2013,47(14):7679-7687. [34] 郑 煌,杨 丹,金梦云,等.洪湖沉积柱中磷形态的垂直分布及指示意义 [J]. 中国环境科学, 2017,37(4):1540-1547. Zheng H, Yang D, Jin M Y, et al. The vertical distribution of P forms and significance in a sediment core from Honghu Lake, China [J]. China Environmental Science, 2017,37(4):1540-1547. [35] Schultz C, Grundl T. pH Dependence of ferrous sorption onto two smectite clays [J]. Chemosphere, 2005,57(10):1301-1306. [36] Statham P J, Jacobson Y, Berg C. The measurement of organically complexed FeII in natural waters using competitive ligand reverse titration [J]. Analytica Chimica Acta, 2012,743:111-116. [37] Andrieux-Loyer F, Aminot A J E C, Science S. Phosphorus forms related to sediment grain size and geochemical characteristics in French Coastal Areas [J]. Estuarine, Coastal and Shelf Science, 2001, 52(5):617-629. [38] Duras J, Hejzlar J. The effect of outflow depth on phosphorus retention in a small, hypertrophic temperate reservoir with short hydraulic residence time [J]. International Review of Hydrobiology, 2001,86(6):585-601. [39] Froelich P. Kinetic control of dissolved phosphate in natural rivers and estuaries: A primer on the phosphate buffer mechanism [J]. Limnology Oceanography, 1988,33(4):649-668. [40] Xu G, Song J, Zhang Y, et al. Enhancement of phosphorus storage capacity of sediments by coastal wetland restoration, Yellow River Delta, China [J]. Marine Pollution Bulletin, 2020,150:110666. [41] Gao D, Chen G, Li X, et al. Reclamation culture alters sediment phosphorus speciation and ecological risk in coastal zone of Southeastern China [J]. Clean-Soil Air Water, 2018,46(11):1700495. [42] Sekhon B S, Bhumbla D K, Sencindiver J, et al. Using soil survey data for series-level environmental phosphorus risk assessment [J]. Environmental Earth Sciences, 2014,72(7):2345-2356. [43] Nair V D. Soil phosphorus saturation ratio for risk assessment in land use systems [J]. Frontiers in Environmental Science, 2014,2:6. [44] Lopez P, Lluch X, Vidal M, et al. Adsorption of phosphorus on sediments of the Balearic (Spain) related to their composition [J]. Estuarine Coastal Shelf Science, 1996,42(2):185-196. [45] Tang W, Shan B, Hong Z. Phosphorus buildup and release risk associated with agricultural intensification in the estuarine sediments of Chaohu Lake Valley, Eastern China [J]. Clean-Soil Air Water, 2010, 38(4):336-343. [46] Delgado A, Torrent J. Comparison of soil extraction procedures for estimating phosphorus release potential of agricultural soils [J]. Communications in Soil Science Plant Analysis, 2001,32(1/2):87-105. [47] Li Z, Wang S, Zhao H, et al. Using multiple combined analytical techniques to characterize water extractable organic nitrogen from Lake Erhai sediment [J]. Science of the Total Environment, 2016,542 (15):344-353. [48] Fischer P, Pöthig R, Venohr M. The degree of phosphorus saturation of agricultural soils in Germany: Current and future risk of diffuse P loss and implications for soil P management in Europe [J]. Science of the Total Environment, 2017,599:1130-1139. [49] Palmer- Fe Lgate E J, Bowes M J, Stratford C, et al. Phosphorus release from sediments in a treatment wetland: Contrast between DET and EPC0methodologies [J]. Ecological Engineering, 2011,37(6):826- 832. [50] Andrieux-Loyer F, Aminot A. Phosphorus forms related to sediment grain size and geochemical characteristics in French Coastal Areas [J]. Estuarine Coastal, 2001,52(5):617-629. [51] Vaalgamaa S. The effect of urbanisation on Laajalahti Bay, Helsinki City, as reflected by sediment geochemistry [J]. Marine Pollution Bulletin, 2004,48(7/8):650-662. [52] Gerke J, Hermann R, et al. Adsorption of orthophosphate to humic-Fe-complexes and to amorphous Fe-oxide [J]. Zeitschrift für Pflanzenernhrung und Bodenkunde, 1992,155(3):233-236. [53] Ni Z, Wang S, Yue W, et al. Response of phosphorus fractionation in lake sediments to anthropogenic activities in China [J]. Science of the Total Environment, 2020,(699):134242. [54] Bridgham S D, Johnston C A, Schubauer-Berigan J P, et al. Phosphorus sorption dynamics in soils and coupling with surface and pore water in riverine wetlands [J]. Soil Science Society of America Journal, 2001,65(2):577-588. Spatial distribution characteristics and release risk assessment of phosphorus forms in sediments: A case study of the Tuojiang River Basin. TANG Jin-yong1,2, YIN Yue-peng1,2, CAO Xi1,2, ZHANG Yu1,2, ZHANG Wen1,2,3* (1.College of Environment and Ecology, Chengdu University of Technology, Chengdu 610059, China;2.State Environmental Protection Key Laboratory of Synergetic Control and Joint Remediation for Soil and Water Pollution (SEKL-SW), Chengdu University of Technology, Chengdu 610059, China;3.State Key Laboratory of Geohazard Prevention and Geoenvironment Protection, Chengdu University of Technology, Chengdu 610059, China)., 2022,42(9):4264~4273 In order to clarify the spatial distribution characteristics of the phosphorus (P) in sediments and provide more accurate and suitable indicators for assessing P release risk, samples of surface sediments were taken from 12 sites in the main stream of the Tuojiang River and its tributaries for determining water-soluble phosphorus (WSP), equilibrium P concentration (EPC0), sediment P adsorption index (PSI) and adsorption saturation (DPS), and the derived P release risk index (ERI). The results show that the order of the P contents in the five forms of sediments is as follows: iron/aluminum combined P (CDB-P,60.63%) > calcium P (Ca-P, 30.84%) > organic P (OP, 3.92%) > ferrous P (Fe(Ⅱ)-P), 3.48%) > loosely P (Loosely-P, 1.13%). CDB-P is the main form of sediment P (0.468~2.287mg/g)and decreases gradually from the upstream to the downstream, which is mainly related to upstream industrial pollution. The spatial distribution of DPS, EPC0and PSI tends to gradually increase with downstream, varying from 44.28% to 80.39%, 0.012 to 0.084mg/L and 0.153 to 1.526L/g, respectively. ERI exceeded 25% at the most upstream sampling sites, indicating a higher risk of P release in the upstream. Regression analysis and correlation show that EPC0 and the overlying water P, CDB-P, OP, OM, and particle size were significantly correlated. Therefore, EPC0can be thought to be a more accurate and efficient indicator for assessing the potential of P release from sediments in the Tuojiang River Basin. An increase in Fe/Al content, particle size, and the reduction of organic matter will elevate the P release risk, so the input of industrial pollution and agricultural non-point source pollution should be controlled. phosphorus forms;spatial distribution;phosphorus equilibrium concentration;phosphorus release risk X171 A 1000-6923(2022)09-4264-10 2021-12-31 国家自然科学基金资助项目(42007148) *责任作者, 教授, zhangwen2014@cdut.edu.cn 唐金勇(1995-),男,四川南充人,成都理工大学硕士研究生,主要从事水体与沉积物磷污染治理的研究.发表论文2篇.

2.4 影响内源磷释放的沉积物组分

3 结论

