
Predictive index based on minimum corneal thickness and symmetry index back of Sirius for early diagnosis of keratoconus
2022-09-16 02:30YueXuYaRuRen1XinYuZhuang1XiaoFengZhang
国际眼科杂志 2022年9期
Yue Xu, Ya-Ru Ren1, Xin-Yu Zhuang1, Xiao-Feng Zhang
1Department of Ophthalmology, the First Affiliated Hospital of Soochow University, Suzhou 215000, Jiangsu Province, China; 2Department of Ophthalmology, Dushu Lake Hospital Affiliated to Soochow University, Suzhou 215000, Jiangsu Province, China
Abstract
•KEYWORDS: Sirius keratoconus index; early keratoconus; minimum corneal thickness; symmetry index back; Sirius
INTRODUCTION
Keratoconus (KC) is a progressive, bilateral and asymmetrical corneal ectatic disorder that may lead to severe visual impairment[1-3]. Early diagnosis of KC is important in corneal refractive surgery[4]. In general, early KC eyes lack the characteristic slit-lamp microscopy signs[5]. Previous studies suggest that abnormal posterior corneal surface and alteration in corneal thickness progression are necessary for early diagnosis of KC[6]. On the contrary, Reddyetal.[7]show that anterior curvature parameters, are better for distinguishing early KC from normal eyes. It is therefore, important to determine the efficacy of various parameters and construct an effective index for evaluation of early KC diagnosis.
Sirius (CSOInc, Florence, Italy), a combination of the Scheimpflug and Placido topography systems, provides a comprehensive evaluation of the anterior, posterior corneal surface and corneal thickness[8-9]. Although multiple parameters for evaluating the cornea and early diagnosing of KC have been proposed, a proper index for distinguishing early KC from the normal eyes remains unknown[10-12]. This study aimed at constructing an efficient formula and index for early diagnosis of KC. External validation was also performed; accuracy of the formula and index were further evaluated.
MATERIALS AND METHODS
EthicsApprovalProtocols in this retrospective study were approved by the ethics committee of the First Affiliated Hospital of Soochow University and they adhered to the tenets of the Declaration of Helsinki. Patient information was anonymized.
StudyCohortsKC group was diagnosed based on the combination of clinical and topographic examinations, including slit lamp, corneal topography and Sirius. Two criteria for evaluation of early KC diagnosis were set: The eyes can be diagnosed as early KC eyes according to corresponding corneal topographic features including local corneal steepening and asymmetric astigmatism, or the contralateral eye was diagnosed as KC and included as an early KC eye even in absence of any obvious KC-related corneal topographic changes and when the vision could still be corrected using frame glasses; Early KC eye was defined as per Amsler-Krumeich classification (stage 1: average K value <48D and corneal cylinder <5D)[5].
The normal group consisted of refractive surgery candidates with normal clinical and topographic features[11]. The right eye of each of the normal subjects was included in analyses for normal group.
The inclusion criteria for KC patients in the prediction cohort were as follows: 1) patients under the age of 60 who had visited the ophthalmology department of the First Affiliated Hospital of Soochow University between August 2016 and July 2020; 2) KC patients diagnosed for stage 1 KC according to Amsler-Krumeich classification; 3) absence of any other ocular diseases except keratoconus and refractive error; 4) no history of ocular surgeries. A total of 34 early KC patients (46 eyes) and 46 age- and gender-matched normal subjects (46 eyes) were thus enrolled in the prediction cohort.
The application cohort was an independent group for external validation of the diagnostic index, consisting of early KC eyes categorized as suspected KC cases by Sirius, and age-and gender-matched normal eyes.KC patients in the application cohort also conformed to the inclusion criteria as in the prediction cohort. A total of 23 early KC patients (23 eyes) and 23 age- and gender-matched normal subjects (23 eyes) were enrolled in the application cohort.
DataExtractionThere were 6 topographic parameters including steep K, flat K, the average K, cylinder, corneal surface regularity index (SRI) and corneal surface asymmetry index (SAI) extracted from the corneal topography measured by TMS-4 (Tomey, Japan). Using Sirius, the 20 parameters which were measured are as follows: 1) Pachymetric parameters: central corneal thickness (CCT), minimum corneal thickness (MCT), the difference between CCT and MCT (δCT), corneal volume, symmetry index front (SIf), which was the difference between the average anterior tangential curvature of the two circular zones (of radius 1.5mm) centered on the vertical axis in the inferior and superior hemispheres, and symmetry index back (SIb), which was the difference between the average posterior tangential curvature of the two circular zones (of radius 1.5mm) centered on the vertical axis in the inferior and superior hemispheres; 2) Aberrometry parameters: anterior zone of 6mm root mean square values per unit area (A6 RMS/A), posterior zone of 6mm root mean square values per unit area (P6 RMS/A), anterior zone of 8mm root mean square values per unit area (A8 RMS/A), posterior zone of 8mm root mean square values per unit area (P8 RMS/A), high order aberration (HOA), Baiocchi-Calossi-Versaci index (BCV), Baiocchi-Calossi-Versaci index front (BCVf), Baiocchi-Calossi-Versaci index back (BCVb), coma, vertical trefoil [Z (3, -3)], vertical coma [Z (3, -1)], horizontal coma [Z (3, 1)], oblique trefoil [Z (3, 3)] and spherical aberration [Z (4, 0)].
ROCCurveAnalysisReceiver operating characteristic (ROC) curve was used to determine the accuracy and predictive value of each parameter by comparing the area under the curve (AUC) for the KC group with the normal group in the prediction cohort. The optimal cut-off value for each parameter was estimated based on a uniform computing index (Youden index). The diagnosis probability as calculated using the formula of the prediction group was termed as “Sirius Keratoconus Index” (SKI). ROC curve analysis of SKI, and that of each of the parameters of SKI was performed and their AUCs were compared between the prediction and the application cohort. Sensitivity, specificity, positive and negative likelihood ratios, positive and negative predictive values were determined for the different parameters of the prediction cohort.
StatisticalAnalysisThe statistical analysis was performed using SPSS software (version 25.0; IBM Corp., New York, NY, USA). Normality of the data distribution was examined using the Kolmogorov-Smirnov test and compared using Student’st-test (normal distribution) or Mann-Whitney U test (for data not conforming to normal distribution). Pearson correlation coefficients (r) were used to determine the correlation between different parameters. Least Absolute Shrinkage and Selection Operator (LASSO) regression analysis was used for parameter selection for further analysis and regularization[13-14]. LASSO regression analysis was performed using glmnet package in R (Version 3.6.0) and RStudio (Version 1.2.1335)[15]. The Logistic regression analysis was performed for all the parameters that were selected as independent variables from LASSO analysis. The formula was then constructed and evaluated by calibration plot based on Hosmer-Lemeshow goodness-of-fit test. A calibration plot along the 45-degree line was suggestive of high consistency between the expected and observed results in the model. The rms package in R was used to visualize the nomogram of the model based on the independent variables selected from the prediction group. For all analyses, two-sidedP-values less than 0.05 were considered statistically significant.
RESULTS
This study was conducted in three stages; Depicts the flowchart of the construction and application of the formula for early diagnosis of keratoconus. First, the formula and SKI were determined using 25 keratoconus-related parameters; with LASSO regression and Logistic regression analyses, these parameters were calculated for the prediction group. ROC curve, calibration plot and nomogram of the formula were evaluated in the prediction group. External validation by ROC curve and calibration plot were analyzed for the application cohort (Figure 1).

Figure 1 Flowchart showing the construction and application of the formula for early diagnosis of keratoconus in this study.
OverallComparisonbetweenKeratoconusandNormalGroupsinthePredictionCohortThe demographic, topographic, pachymetric and aberrometry parameters of the prediction cohort (34 early KC patients (46 eyes) and 46 comparable normal subjects (46 eyes)) are presented in Table 1. The age (P=0.961) and gender (P=0.725) were comparable between the KC group and normal group. A total of 25 keratoconus-related parameters, except Z (3, 3), showed significant differences between the KC group and normal group by Student’st-test or Mann-Whitney U test (P<0.05). Correlation analysis of 28 keratoconus-related parameters was displayed for the KC group and normal group in the prediction cohort (Figure 2A-B). There were 16 parameters including 2 topographic (SRI and SAI), 3 pachymetric and 11 aberrometry parameters showed a significant positive correlation with other parameters (cor.>0.4,P<0.001) in the keratoconus group. In addition, Z (3, -1) showed a significant negative correlation with other parameters (cor.<-0.4,P<0.001) in keratoconus group. Few parameters showed significant correlation in normal group.
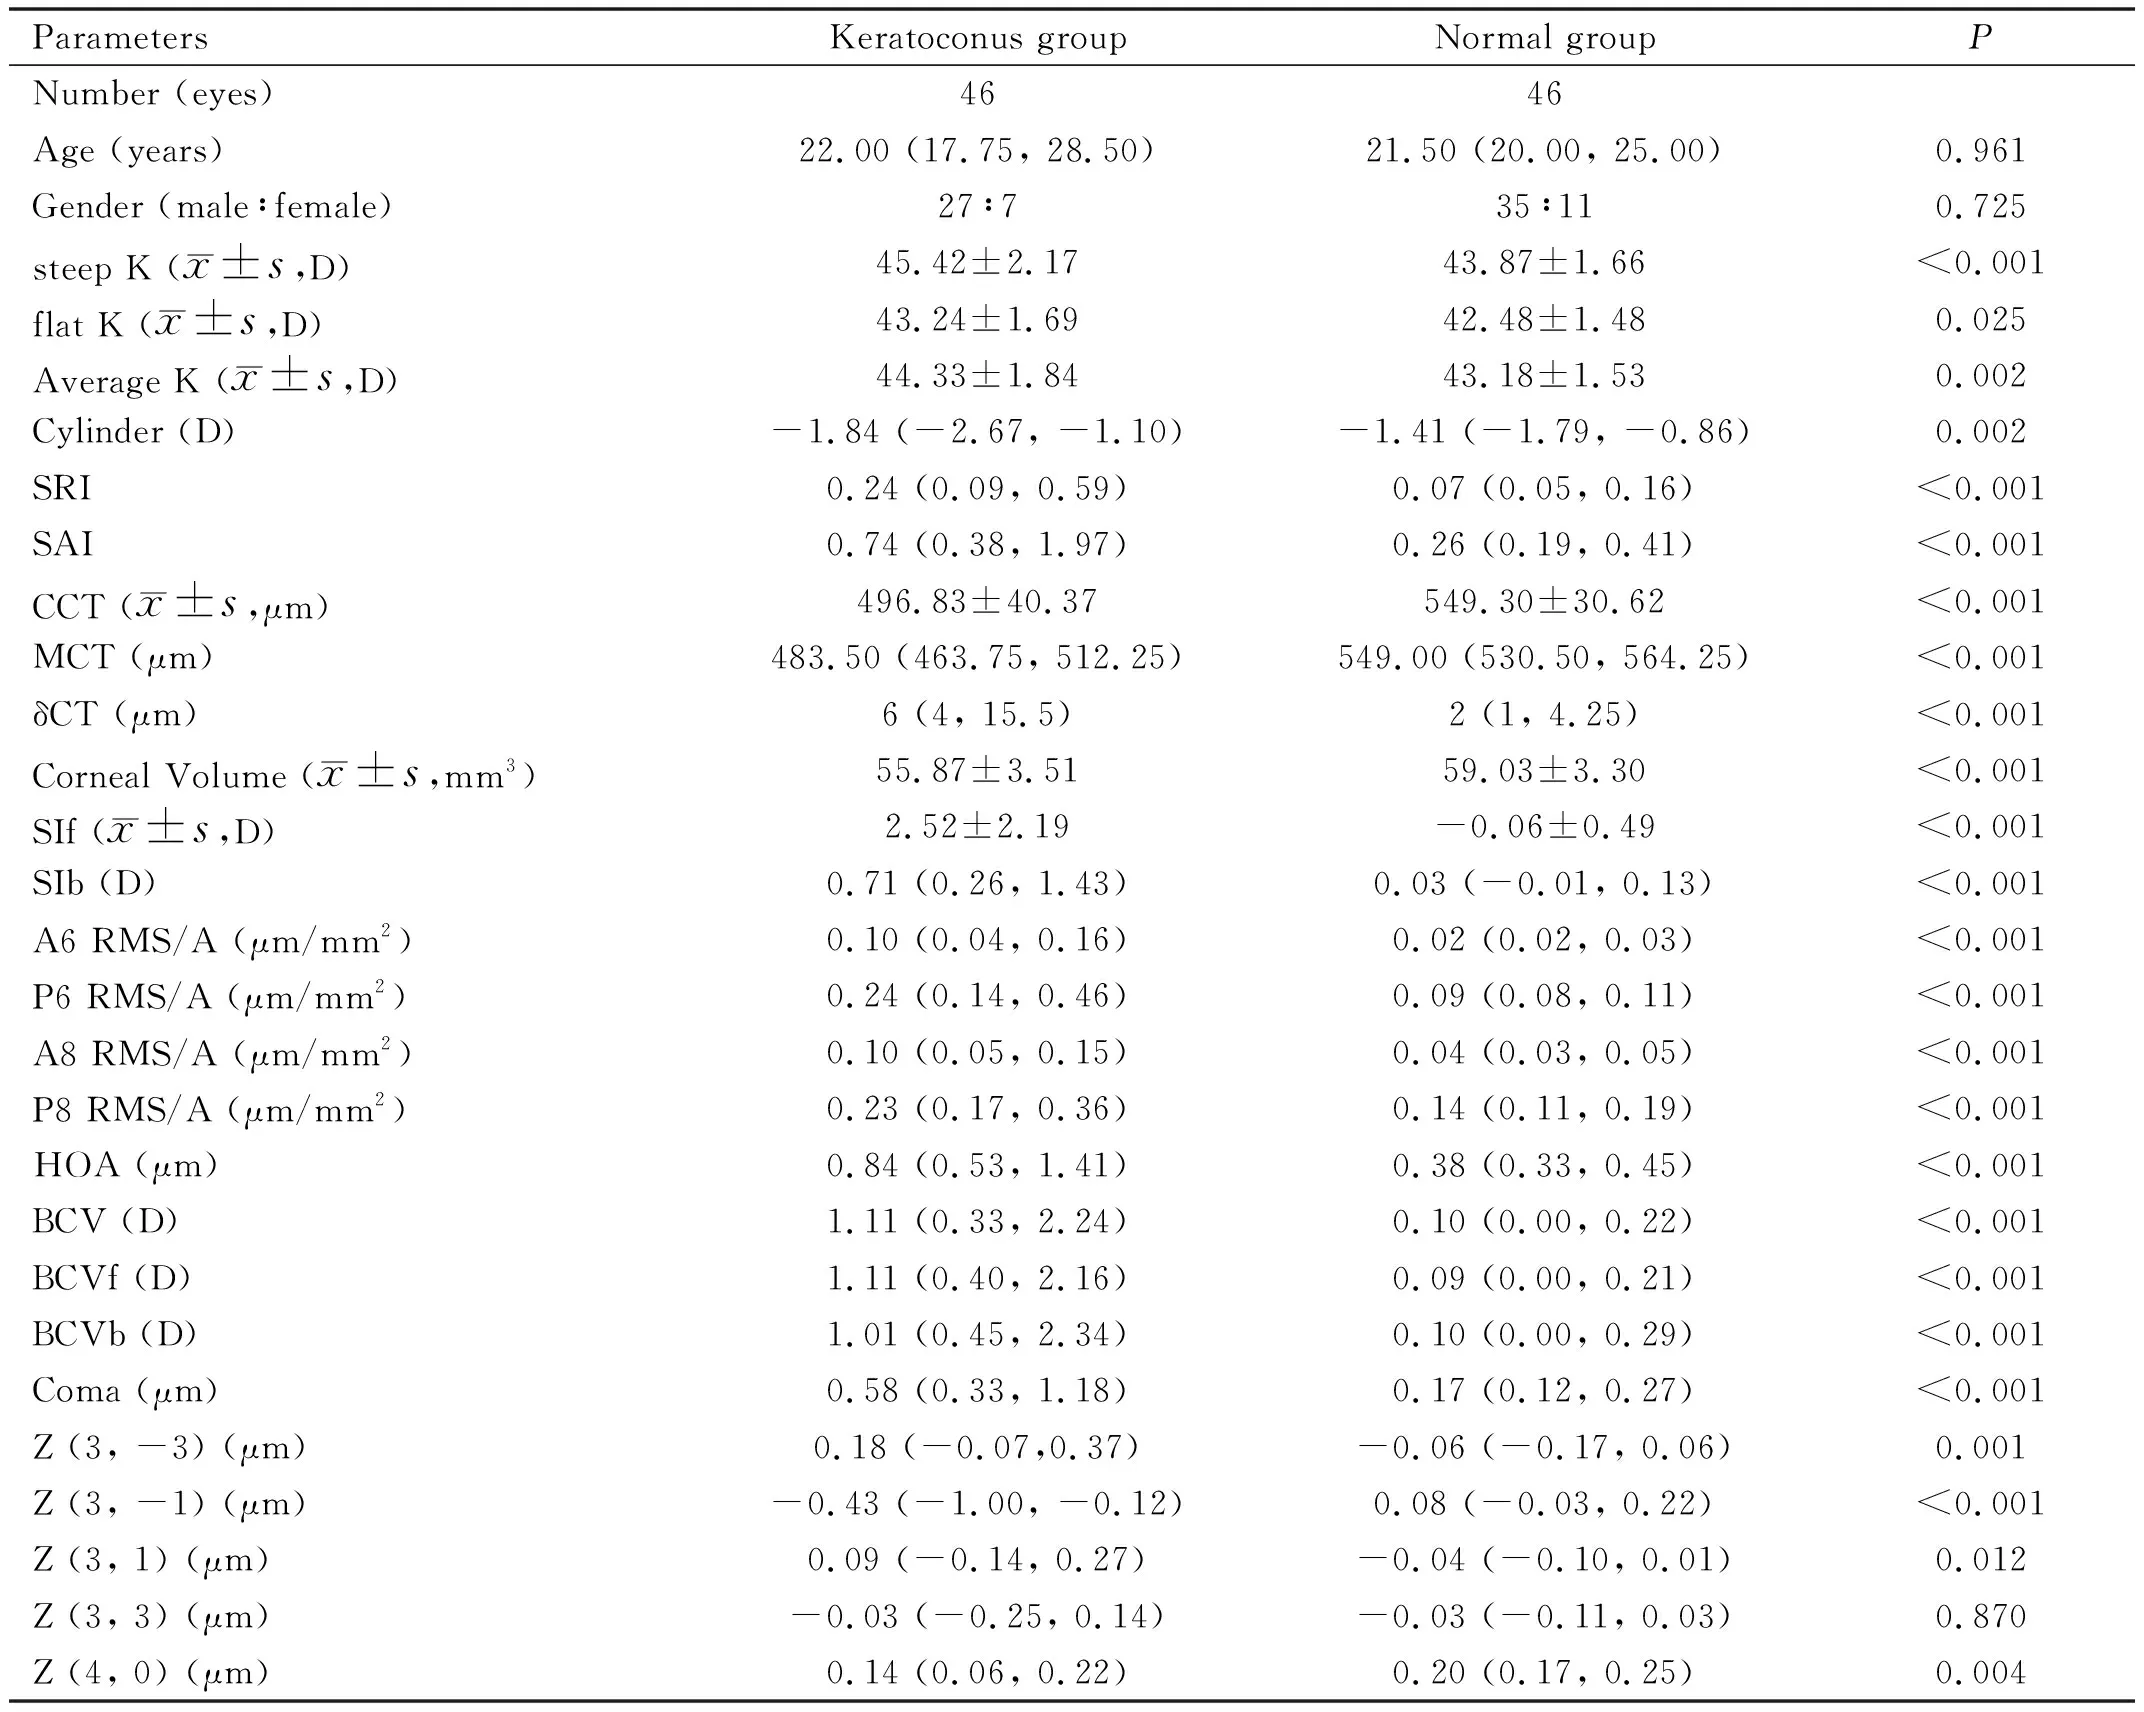
Table 1 Comparative demographic, topographic, pachymetric and aberrometry parameters in the prediction cohort
LASSORegressionAnalysisinthePredictionCohortLASSO regression analysis was performed for 25 significant parameters in prediction cohort. LASSO coefficient profile is shown in Figure 2C. The calculation of the tuning parameter (λ) in the LASSO model is shown in Figure 2D. The y-axis represents partial likelihood deviance; The lower x-axis, log (λ) and the upper x-axis, the average number of predictors. The red dots represent the average deviance values for each model with a given λ, where the model is the best fit to data. Thus, vital keratoconus-related parameters including SIb, SIf, and MCT were selected.

Figure 2 Correlation and LASSO regression analysis of keratoconus-related parameters in prediction cohort.
LASSO, Least Absolute Shrinkage and Selection Operator; SRI, surface regularity index; SAI, surface asymmetry index; δCT, the difference between CCT and MCT; SIf, symmetry index front; SIb, symmetry index back; A6 RMS/A, anterior 6mm zone root mean square values per unit area; P6 RMS/A, posterior 6mm zone root mean square values per unit area; A8 RMS/A, anterior 8mm zone root mean square values per unit area; P8 RMS/A, posterior 8mm zone root mean square values per unit area; HOA, high order aberration; BCV, Baiocchi-Calossi-Versaci index; BCVf, Baiocchi-Calossi-Versaci index front; BCVb, Baiocchi-Calossi-Versaci index back; Z (3, -3), vertical trefoil; Z (3, 1), horizontal coma; Z (3, -1), vertical coma; MCT, minimum corneal thickness.
Correlation analysis of 28 keratoconus-related parameters was displayed in keratoconus group and normal group of prediction cohort. 16 parameters, including 2 topographic (SRI and SAI), 3 pachymetric (δCT, SIf, and SIb) and 11 aberrometry parameters (A6 RMS/A, P6 RMS/A, A8 RMS/A, P8 RMS/A, HOA, BCV, BCVf, BCVb, Coma, Z (3, -3) and Z (3, 1)), showed positive correlation with other parameters(cor.>0.4,P<0.001) in keratoconus group. In addition, Z (3, -1) showed negative correlation with other parameters (cor.<-0.4,P<0.001) in keratoconus group. Few parameters showed significant correlation with others in normal group (Figure 2A-B). LASSO regression analysis was performed in 25 significant parameters selected by Student’sttest or Mann-Whitney U test in prediction group. LASSO coefficient profile was visualized (Figure 2C). The selection of the tuning parameter (λ) in the LASSO model was calculated, and 3 parameters (SIb, SIf, and MCT) were selected out for further analysis (Figure 2D).
MultivariateLogisticRegressionAnalysisinthePredictionCohortThe multivariate Logistic regression analysis was performed for the prediction group on the basis of SIb, SIf, and MCT (Table 2). SIb and MCT were selected as explanatory parameters to predict early KC in patients. The regression coefficients of SIb and MCT were 9.445 and -0.027, respectively. The prediction formula was calculated as follows: logit=12.051+9.445×SIb (D)-0.027×MCT(μm).

Table 2 Results of multivariate Logistic regression analysis

ROCCurve,CalibrationAnalysisandNomograminthePredictioncohortPresent ROC analysis, sensitivity, specificity, positive and negative likelihood ratios, positive and negative predictive values for 25 keratoconus-related parameters and SKI to differentiate the early KC from normal eyes in the prediction cohort were shown in Table 3 and supplementary Table 1. The ROC curve represents the relationship between sensitivity of the discriminant test and its false-positive rate (1-specificity). AUC and Youden’s index (J) were computed to evaluate the bias in these parameters. Markedly, the AUC of SKI (sensitivity=89% and specificity=98%, AUC=0.932) was the highest in the prediction cohort. The ROC curve plot delineated the sensitivity and specificity of the 3 parameters (SIb, SIf and MCT) after LASSO regression analysis and SKI (Figure 3A). SKI (AUC=0.932) was calculated on the basis of SIb (AUC=0.927) and MCT (AUC=0.879) after Logistic regression analysis. The cut-off value for SKI was determined at 0.44.

Table 3 ROC analysis, sensitivity and specificity for different parameters to differentiate early keratoconus from normal eyes in the prediction cohort
Calibration plot of SKI was constructed for the prediction cohort using Hosmer-Lemeshow goodness-of-fit test, with the red dotted line as the reference line. The curve of the prediction cohort deviated slightly from the reference line; A good calibration of SKI was estimated in 92% of cases (R2=0.9804) (Figure 3B).

Figure 3 ROC curve, calibration plot and nomogram of the formula in prediction cohort.
In addition, a nomogram was constructed based on SIb and MCT to predict the probability of early keratoconus (Figure 3C). A vertical line was drawn upward from each parameter and the corresponding points were recorded. The points at each of the parameters were summed up to calculate the total score which corresponded to the predicted probability of keratoconus at the bottom of the nomogram.
The ROC curve analysis delineated the sensitivity and specificity of 3 parameters (SIb, SIf, and MCT) after LASSO regression analysis and SKI. SKI was calculated on the basis of SIb and MCT byLogistic regression analysis and had the highest AUC among all the 25 parameters (Figure 3A). Calibration plot was constructed in prediction group, with the red dotted line as the reference line. The curve of the prediction group slightly deviated from the reference line and showed a good calibration of the formula (R2=0.9804) (Figure 3B). A nomogram was constructed based on the two parameters (SIb and MCT) in the formula. When using it, drawing a vertical line from each parameter upward to the points and then recording the corresponding points. The point of each parameter was then summed up to calculate a total score which corresponds to a predicted probability of keratoconus at the bottom of the nomogram (Figure 3C).
ROC curve: Receiver Operating Characteristic curve; SIb: Symmetry index back; SIf: Symmetry index front; MCT: Minimum corneal thickness; LASSO: Least Absolute Shrinkage and Selection Operator; SKI: Sirius Keratoconus Index; AUC: Area under curve.
OverallComparisonbetweenKeratoconusandNormalGroupsintheApplicationCohortThe accuracy of SKI was tested in the application group, which included 23 early KC patients (23 eyes) categorized as suspected KC by Sirius and 23 normal subjects (23 eyes). The demographic and formula-related information of the application group is presented in Table 4. The age (P=0.834), gender (P=1.000), average K (P=0.334) and cylinder (P=0.886) were comparable between the KC and normal groups. SIb, MCT and SKI showed significant differences between the two groups (P<0.05). The trends in differences in these parameters were similar in both the prediction and application groups.
ROCCurveandCalibrationAnalysesintheApplicationCohortThe ROC curve analysis delineated the sensitivity and specificity of the SIb and MCT in the formula and SKI (Figure 4A). The AUC of SKI (AUC=0.987) was the highest amongst the parameters in the application group. Additionally, calibration plot was constructed for the application group, using red dotted line as the reference (Figure 4B). The validation of SKI, by Hosmer-Lemeshow test and AUC, suggested a good calibration estimation in 94% of cases in the application group. The accuracy of SKI derived from prediction cohort was examined in the application cohort; the sensitivity was 91% (21/23) and the specificity was 96% (22/23).
The ROC curve analysis delineated the sensitivity and specificity of the 2 parameters (SIb and MCT) in the formula and SKI. SKI (AUC=0.987) had the highest AUC among these 3 parameters (Figure 4A). Calibration plot was also constructed in application group, with the red dotted line as the reference line. The curve of the application group slightly deviated from the reference line and showed a good calibration of SKI in 94% of cases (R2=0.9909) (Figure 4B) .

Table 4 Comparative demographic and formula-related information in the application cohort
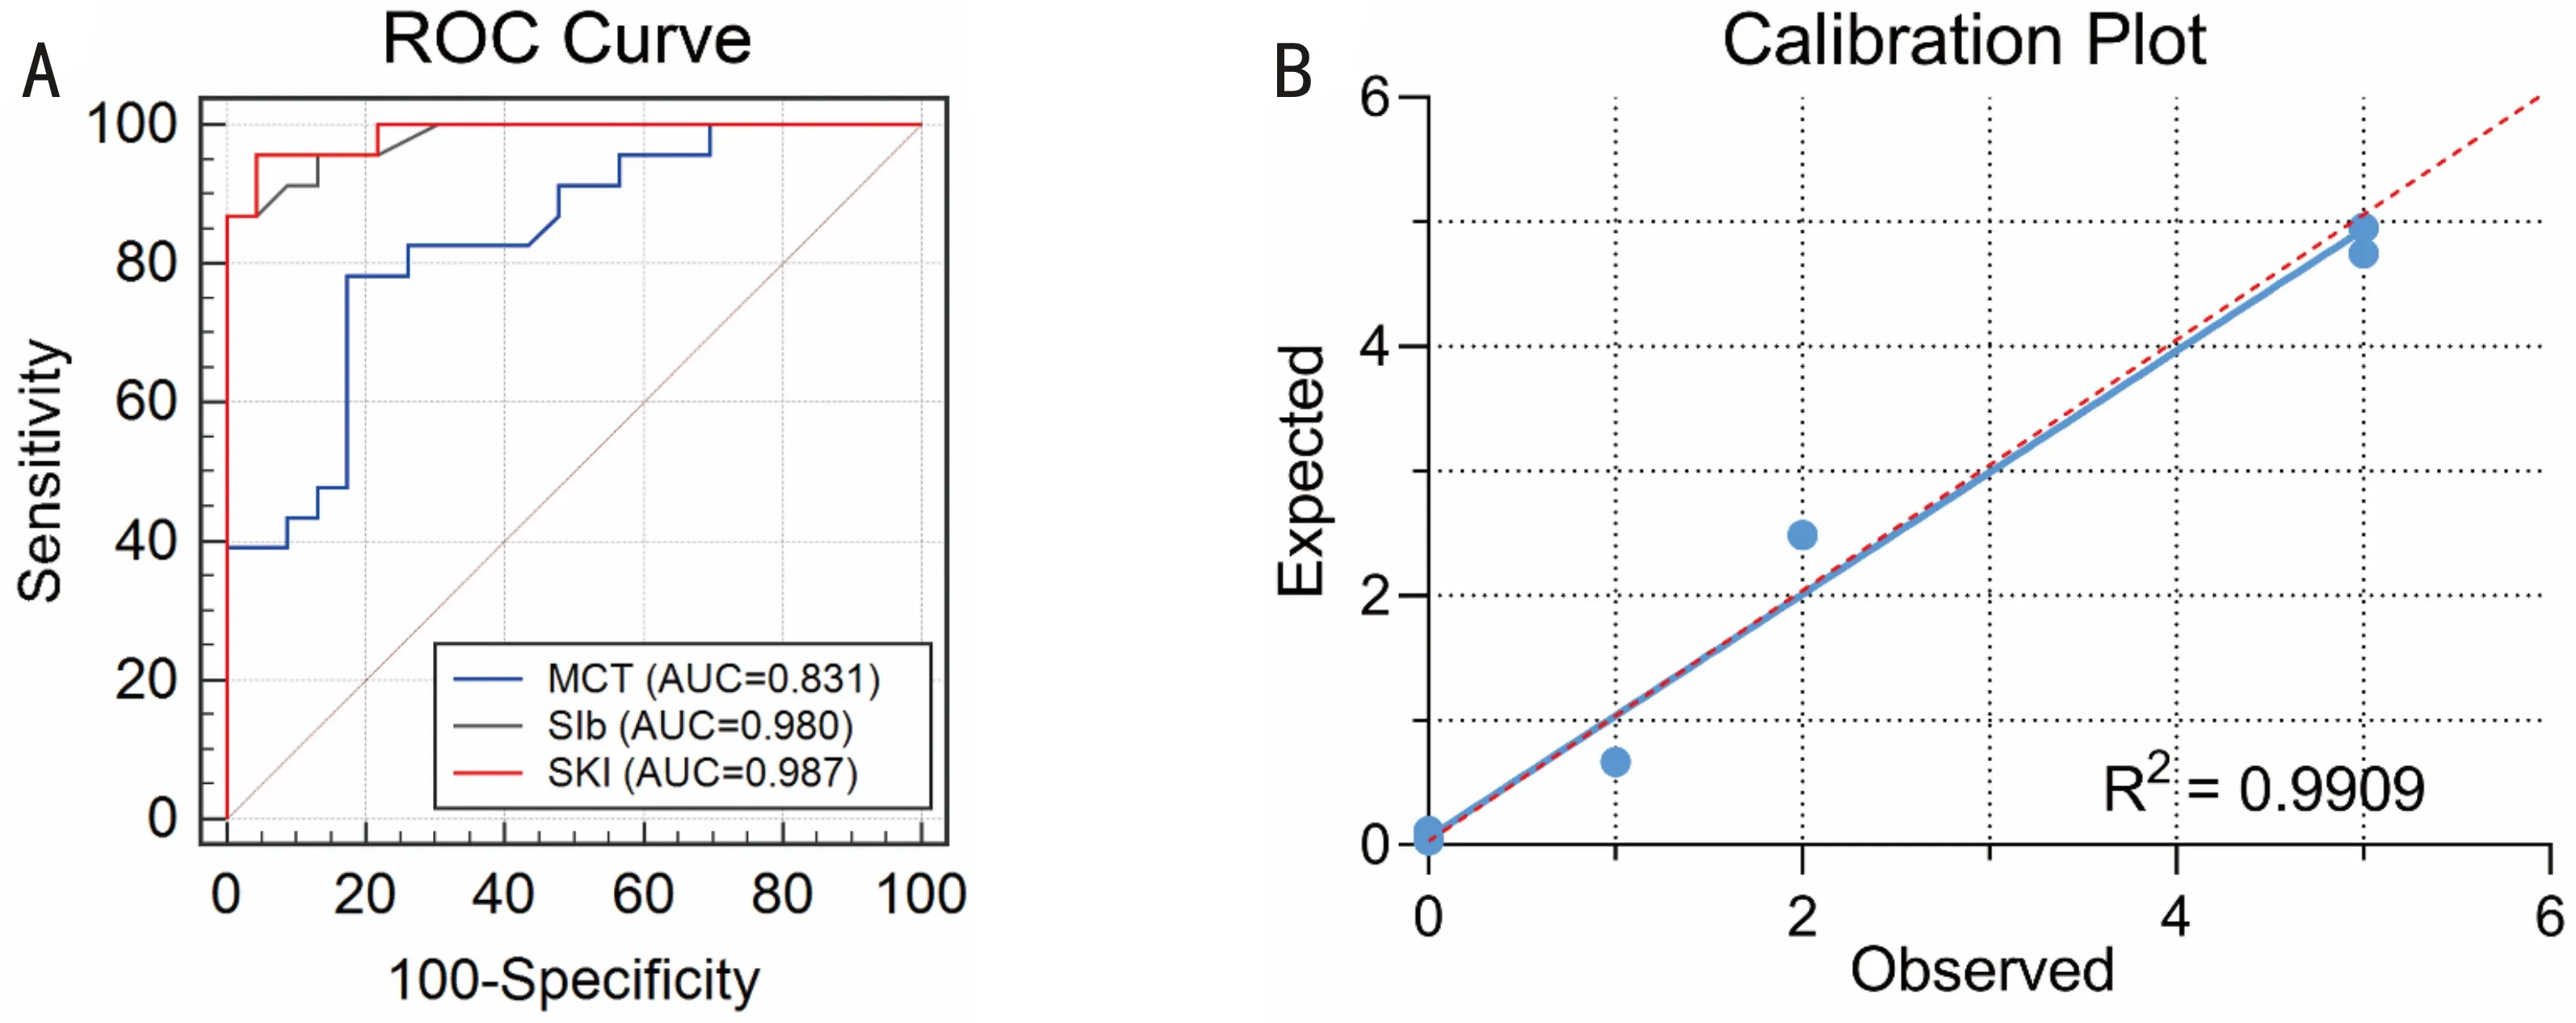
Figure 4 ROC curve and calibration plot of the formula in application cohort.
ROC curve: Receiver Operating Characteristic curve; SIb: Symmetry index back; MCT: Minimum corneal thickness; SKI: Sirius Keratoconus Index; AUC: Area under curve.
DISCUSSION
Diagnosis of early KC remains a challenge for ophthalmologists especially in patients with suspected KC. Early signs of KC include displacement of the thinnest corneal point from the center, changes in corneal thickness, distribution of epithelial cells, and anterior and posterior corneal astigmatism[16]. Consequently, technologies for detecting these early signs are crucial for early diagnosis of KC. Technologies for characterization, visualization and evaluation of anterior and posterior surfaces of the cornea are vital for early diagnosis of KC. Reflection-based topography and elevation-based systems should be used in combination with high-order aberration measurements to improve the diagnosis of early KC. Ultra-high resolution ultrasound can detect early KC based on the measurements of corneal epithelial and stromal thickness maps[17]. Optical coherence tomography used to measure corneal and epithelial thickness is considered as an advanced technique for early diagnosis of KC[18]. Corneal biomechanics should also be taken into consideration to evaluate the relationship between central corneal thickness and corneal hysteresis[19].
Sirius, a combination of reflection- and elevation-based systems, is a promising technology for early detection of KC[20]. Using maximal depth of focus and with minimal distortion of image, Sirius provides comprehensive information from the anterior corneal surface to the posterior lens surface[9-11,21]. Although Sirius provides several parameters for the evaluation of cornea, early diagnosis of KC still remains a challenge in pre-operative screening in refractive surgery[22]. In the present study, we constructed a prediction formula and evaluated the probability of KC using SKI based on measurements of posterior corneal surface and the thinnest corneal thickness using Sirius.
In previous reports, there is a significant difference in age[23]and gender[24]between KC patients and the healthy subjects; In this study, we addressed these differences by selecting age-and gender-matched normal groups for the corresponding KC groups[25]. There were no significant differences in age and gender between KC and normal group in prediction or application cohort, thus bias due age and gender was prevented. The average K (P=0.334) and cylinder (P=0.886) were also comparable between the two groups in application cohort. This indicated that early KC eyes categorized as suspected KC by Sirius had similar averages of K and cylinder as normal people. Thus, a sensitive index like SKI was needed to differentiate early KC from normal eyes.
In this study, we constructed a Logistic model and nomogram to distinguish the early KC from normal eyes. SIb and MCT were selected as explanatory parameters to predict the early KC eyes. SIb is the difference of average posterior tangential curvature between two rounded regions centered on the vertical axis in the inferior and superior hemispheres. A positive value indicates steepness in the inferior region, whereas a negative value indicates steepness in the superior region[26]. MCT is the thinnest value of corneal thickness calculated within an 8mm zone. Abnormal posterior corneal surface and alteration in corneal thickness are important for keratoconus diagnosis[6,27]. Previous studies suggest that posterior corneal parameter and minimum corneal thickness are the most distinguishing parameters for early KC and normal eyes and our results were in concordance with these studies[28-29].
The external validation of SKI, with ROC curve (AUC=0.987) and Hosmer-Lemeshow test (R2=0.9909), suggested a good calibration estimation in 94% of cases in application group. The accuracy of SKI derived from prediction cohort was examined using the external validation cohort with the cut-off of 0.44. The sensitivity was 91% (21/23) and the specificity was 96% (22/23). Shettyetal[20]suggest P8 RMS/A as the best parameter of Sirius to detect subclinical keratoconus (AUC=0.730). Heidarietal[11]suggest BCVf as the most accurate parameter in Sirius to diagnose subclinical KC (AUC=0.887). Martínez-Abadetal[30]suggest ocular residual astigmatism (AUC=0.727) and topography disparity (AUC=0.756) in Sirius as the promising parameters for diagnosis of subclinical keratoconus. However, our model with SKI based on both MCT and SIb (AUC=0.932 in prediction group and AUC=0.987 in application group) had greater efficacy and better performance. Additionally, we validated our method in a separate cohort. Arbelaezetal[26]constructed a support vector machine (SVM) classifier to analyze curvature, thickness and height data of both the anterior and posterior corneal surfaces and pachymetry in Sirius. The sensitivity and specificity of SVM was 92% and 98%, respectively. These values were similar to those obtained using SKI in the present study (sensitivity and specificity, 91% and 96%, respectively). Additionally, our results were also validated in an external validation cohort.
However, the present study has certain limitations. The sample size was limited as the number of early KC eyes was lesser than KC eyes. The early diagnostic parameters for KC differed significantly in the different devices and thus could not be used interchangeably for the diagnosis of early KC. However, SKI developed is efficient in differentiating early KC from normal eyes and, further studies are needed to validate this formula and the index in multi-center clinical studies.
CONCLUSION
In the present study, we constructed the diagnostic formula and SKI to differentiate early KC eyes from normal eyes in the prediction cohort. ROC curve, calibration plot and nomogram of the formula were systematically analyzed in the prediction cohort. Additionally, external validation of SKI was performed in application cohort. Our findings provide a simple and an effective index for early diagnosis of KC in preoperative screening for refractive surgery.
