Effect of astrocyte on synchronization of thermosensitive neuron–astrocyte minimum system
2022-08-31 09:54YiXuanShan单仪萱HuiLanYang杨惠兰HongBinWang王宏斌ShuaiZhang张帅YingLi李颖andGuiZhiXu徐桂芝
Chinese Physics B 2022年8期
Yi-Xuan Shan(单仪萱) Hui-Lan Yang(杨惠兰) Hong-Bin Wang(王宏斌)Shuai Zhang(张帅) Ying Li(李颖) and Gui-Zhi Xu(徐桂芝)
1State Key Laboratory of Reliability and Intelligence of Electrical Equipment,Hebei University of Technology,Tianjin 300130,China
2Hebei Key Laboratory of Bioelectromagnetics and Neural Engineering,Hebei University of Technology,Tianjin 300130,China
Keywords: astrocytes,synchronization,Hodgkin–Huxley model,thermosensitive neuron
1. Introduction
The brain contains copious and complex dynamic characteristics, and is the most significant information processing system. Synchronization of neuronal discharge activities is a typical dynamics phenomenon in complex systems,and plays an especially vital role in the brain function of information processing.[1,2]The complex network of the central nervous system (CNS) plays a critical role in the maintenance of many activities including cognition and memory,in which the hippocampus is a typical region including pyramidal cells(excitatory neurons),interneurons(inhibitory neurons)and astrocytes.[3]From the perspective of complex networks, the resting state of the brain is the stable equilibrium points of the system, and the firing activity of neurons with external stimulation is the limit cycles of the system.[2]By means of external stimulation,the interference of chaotic synchronization and regulation of the phase coordination between systems can improve cognitive function and treat nervous system diseases.[4–6]Obviously, the global dynamic behavior of the system is very complex,[7–11]and is subject to many factors,such as network scale,[12,13]initial value sensitivity,[14,15]and system noise.[16–19]Therefore,it is very difficult to regulate the complex network. Based on the medical significance and theoretical value of neural regulation,the study of nonlinear dynamic characteristics of neuronal discharge has attracted increasing attention recently.
In the past decade,it has been reported that astrocytes are the main cells in the hippocampus, which interact with pyramidal cells and interneurons to provide structural,trophic and metabolic support.[20]Due to the loss of a Na2+channel, astrocytes fail to generate action potential. Instead, astrocytes respond to neuronal activity by increasing the level of Ca2+in neurons.[21,22]When firing, neurons produce neurotransmitters,such as glutamate and adenosine triphosphate(ATP),which bind to the transmitter receptors on astrocytes.[23]In this process, the production of inositol triphosphate (IP3) is promoted with the release of Ca2+by activating astrocytes.[24]With the increase in intracellular Ca2+concentration, the astrocytes release glutamate, ATP and other glial transmitters back to the neurons.[24]These transmitters can regulate the information transmission and excitability of synapses.[25,26]In particular,Ca2+oscillation plays a central role in neurons with a close relationship of periodic bursting oscillation.[27]According to the bidirectional feedbacks of astrocytes and neurons, a tripartite synapse is conceptualized.[20]It is indicated that the connection between presynaptic and postsynaptic neurons is regulated by astrocytes.[28]
Astrocytes can dynamically regulate neuronal excitability and synaptic plasticity. It is reported that astrocytes with the best coupling strength significantly improve the weak signal detection performance of neurons.[29]In addition, astrocytes are confirmed to have significant consequences for synchronization. For example, it is found that healthy astrocytes may cause two neurons to lose synchronization.[22]Hence, astrocytes display an obvious function of regulating synapses, which can trigger neuronal desynchronization to a certain extent. Moreover, a recent study indicated that overactive astrocytes can produce a large amount of Ca2+, leading to high-frequency discharge of neurons.[29]In this context,Øyehaug[30]revealed that the local uptake of astrocytes is an important factor in inducing epileptic discharge. In particular, it is observed that glial networks exhibit strong synchronization with high activity over long distances before epileptic seizures, rather than neurons with a small amount of synchronous activity locally.[31]Considering the above results of astrocytes, we establish a neuron–astrocyte minimum model to study the characteristics of neuronal discharge in this paper.
On the other hand, temperature (T) is a non-negligible factor in the nervous system. It has been shown that an increase in temperature increases the intrinsic excitability of excitatory pyramidal cells and inhibitory interneurons in the hippocampus.[32]With increasing temperature, the nervous system changes from a conventional spike discharge state to a chaotic burst state, and finally stabilizes to a conventional burst state.[33]Hence, it is obvious that the pyramidal cells and interneurons in the hippocampus are thermosensitive. At low temperature, with an increase in temperature, the neuronal clusters show the transition of desynchronization and burst synchronization, as well as promoting an in-phase synchronous state.[34]At high temperature,the low variability of burst intervals of neurons results in synchronization of phase.If it further increases,an over level temperature leads to spike synchronization.[35]In addition,temperature affects the action potential of neurons by regulating the conductance and gating kinetics of ion channels.[36–38]The experimental results show that alterations to the gating kinetics of ion channels are associated with temperature,which leads to changes in the inherent membrane excitability.[39]It has been experimentally verified that the input resistance of pyramidal cells and interneurons decreases with an increase in temperature.[32]Based on neural computing, temperature can affect the conductance of ion channels. Moreover, ion channel current can regulate the excitability of neurons.[36]Therefore,we establish a thermosensitive coupling model of pyramidal cells and interneurons for dynamics analysis.
Temperature not only affects the function of neurons,but can also cause changes in the activation intensity for astrocytes.[40]Experiments have shown that astrocytes have a slow increase in transient Ca2+at warming temperature.[41]In addition, the metabolic cycle and activation degree of astrocytes are inhibited by lowering the temperature.[40]Hence,temperature variation can influence neural activities in brain,especially in the CNS with many astrocytes. Recently it was revealed that the ion channels associated with calcium are temperature sensitive in astrocytes, e.g., the TRP channel[42]and Kir.4.1 channel.[43]In addition, Zhang[42]showed that the calcium flow through IP3receptor channels in astrocytes is strongly dependent on temperature. Therefore,the IP3receptor channel is affected by temperature.
In this paper, we establish a thermosensitive neuron–astrocyte minimum system based on the Hodgkin–Huxley model. We focus on the inference of astrocyte parameters and temperature in the synchronization behavior by using the maximum synchronization error and phase difference. The results indicate that the production rate of IP3and feedback intensities of astrocytes induce the periodic oscillatory activity of IP3and Ca2+concentration envelope curves. The synchronous phenomenon and asynchronous state between firing neurons at the temperature of weak synchronization is also explained.
The paper is organized as follows. In Section 2, we describe the details of the neuron–astrocyte minimum system based on the Hodgkin–Huxley neuron model with major parameters,which is indispensable in neuron dynamics and synchronization quantifications. In Section 3, we analyze the effects of positive and negative feedback intensities of astrocytes on neuronal synchronization,and the production rate of IP3on neuronal synchronization. We study the relationship between concentration of Ca2+and synchronization further. Finally,the discussion and conclusion are presented in Section 4.
2. Model and methods
Based on the hippocampal CA1 neuron–astrocyte network structure, we establish the neuron–astrocyte minimum system shown in Fig.1,which consists of a pyramidal cell,an interneuron and an astrocyte.[20]With regard to computation,we select a modified version of the Hodgkin–Huxley model[44]and Li–Rinzel calcium model[25]to apply to the minimum model. Moreover,it is reported that excitatory pyramidal cells and inhibitory interneurons in the hippocampus are sensitive to temperature.[32,45,46]Additionally,Stephan’s experiment verified that astrocytes are temperature dependent.[41]Thus, we introduce a temperature factor into the minimum model reference to Ref. [47]. Based on the thermosensitive neuron–astrocyte minimum model, we study the synchronous regulation mechanism for the connection of pyramidal cells and interneurons through astrocytes.[48]The mathematical description of the improved neuron model is illustrated below.
The dynamics of the pyramidal cell are as follows:


wheregNa= 120 ms·cm−2,gK= 36 ms·cm−2andgL=0.3 ms·cm−2are the maximum conductance of the sodium channel,potassium channel and leakage channel,respectively,ENa= 50 mV,EK=−77 mV, andEL=−54.5 mV are recorded as the sodium ion balance voltage,potassium ion balance voltage and leakage balance voltage,respectively. In addition,it is verified that temperature can affect the ion conductance and ion gate channel variable in neurons.[36,45–47]According to Ref.[47],the parameterρdenotes the temperature scale factor of ion conductance in Eq. (3), for which the expression is shown below:

According to the results of experiments,T0is selected at 25◦C in Eqs.(4)and(6).[47]Specifically,the expressions of activation variables and inactivation variables in Eq. (5) are shown as follows:

wheregsiandgseare the inhibitory and excitatory coupling intensities, andVsiandVseare the inhibitory and excitatory synaptic reversible potentials,respectively.[A]PYand[A]INare the respective concentrations of neurotransmitters released by the pyramidal cell and interneuron,depending on their respective membrane potentials. The synaptic variablessPYandsINreflect the effect of neurotransmitters that activate the neuron to release.

Fig.1. Illustration of the neuron–astrocyte minimum system. The model includes a pyramidal cell(PY),interneuron(IN)and astrocyte(AS).The purple arrow represents the inhibitory coupling and the pink arrow represents the excitatory coupling between the pyramidal cell and interneuron. After the neurons have stimulated the astrocyte, the astrocyte feeds back to the pyramidal cell and the interneuron as currents,in which the red arrow represents the positive feedback to the inhibitory interneuron and the green arrow represents the negative feedback to the excitatory pyramidal cell.
When activated, the neuron releases a certain amount of neurotransmitters into the synaptic gap. The main neurotransmitters bind to the postsynaptic membrane. Other neurotransmitters can bind to astrocytes, resulting in the release of IP3.The regulation of IP3in astrocytes can be expressed by the equation below:

whereΘ(x) is the Heaviside ladder function,kis the scale factor,andτCa2+is the relaxation time constant. When the calcium concentration of astrocytes exceeds [Ca2+]th, the feedback current of astrocytes to neurons can be activated.ε1andε2represent the proportional coefficients of feedback currents of astrocytes, which are used to simulate the regulation of synaptic plasticity of neurons under the influence of astrocytes. Whenε1=ε2=0, astrocytes do not play a role in the synaptic plasticity of neurons.
According to Refs. [51,52], all necessary parameters in this paper are listed in Table 1.

Table 1. Parameters of the neuron–astrocyte minimum system.
A major goal of this paper is to study the temperature affecting the synchronization between pyramidal cells and interneurons under the regulation of astrocytes. For illustrative purposes, we use the maximum synchronization error[53]of the neuron membrane potential max(|e|)defined as

wheret1andt2are the corresponding times of the adjacent peak action potentials in the pyramidal cell.tsis the time corresponding to the peak action potential of the interneuron. ∆ϕis bounded between 0 and 2π.When the fixed phase difference is not completely 0 or 2π,the neuron is in the out-of-phase synchronization state. For states with in-phase synchronization,∆ϕ=0 or 2π. When the two neurons are in an asynchronous state, the phase difference presents a disordered state. In calculation,ordinary differential equations were solved using the Euler algorithm with a time step of 0.01 ms.
3. Results
3.1. Effect of rIP3 on the electrical activity of thermosensitiv e n eu rons
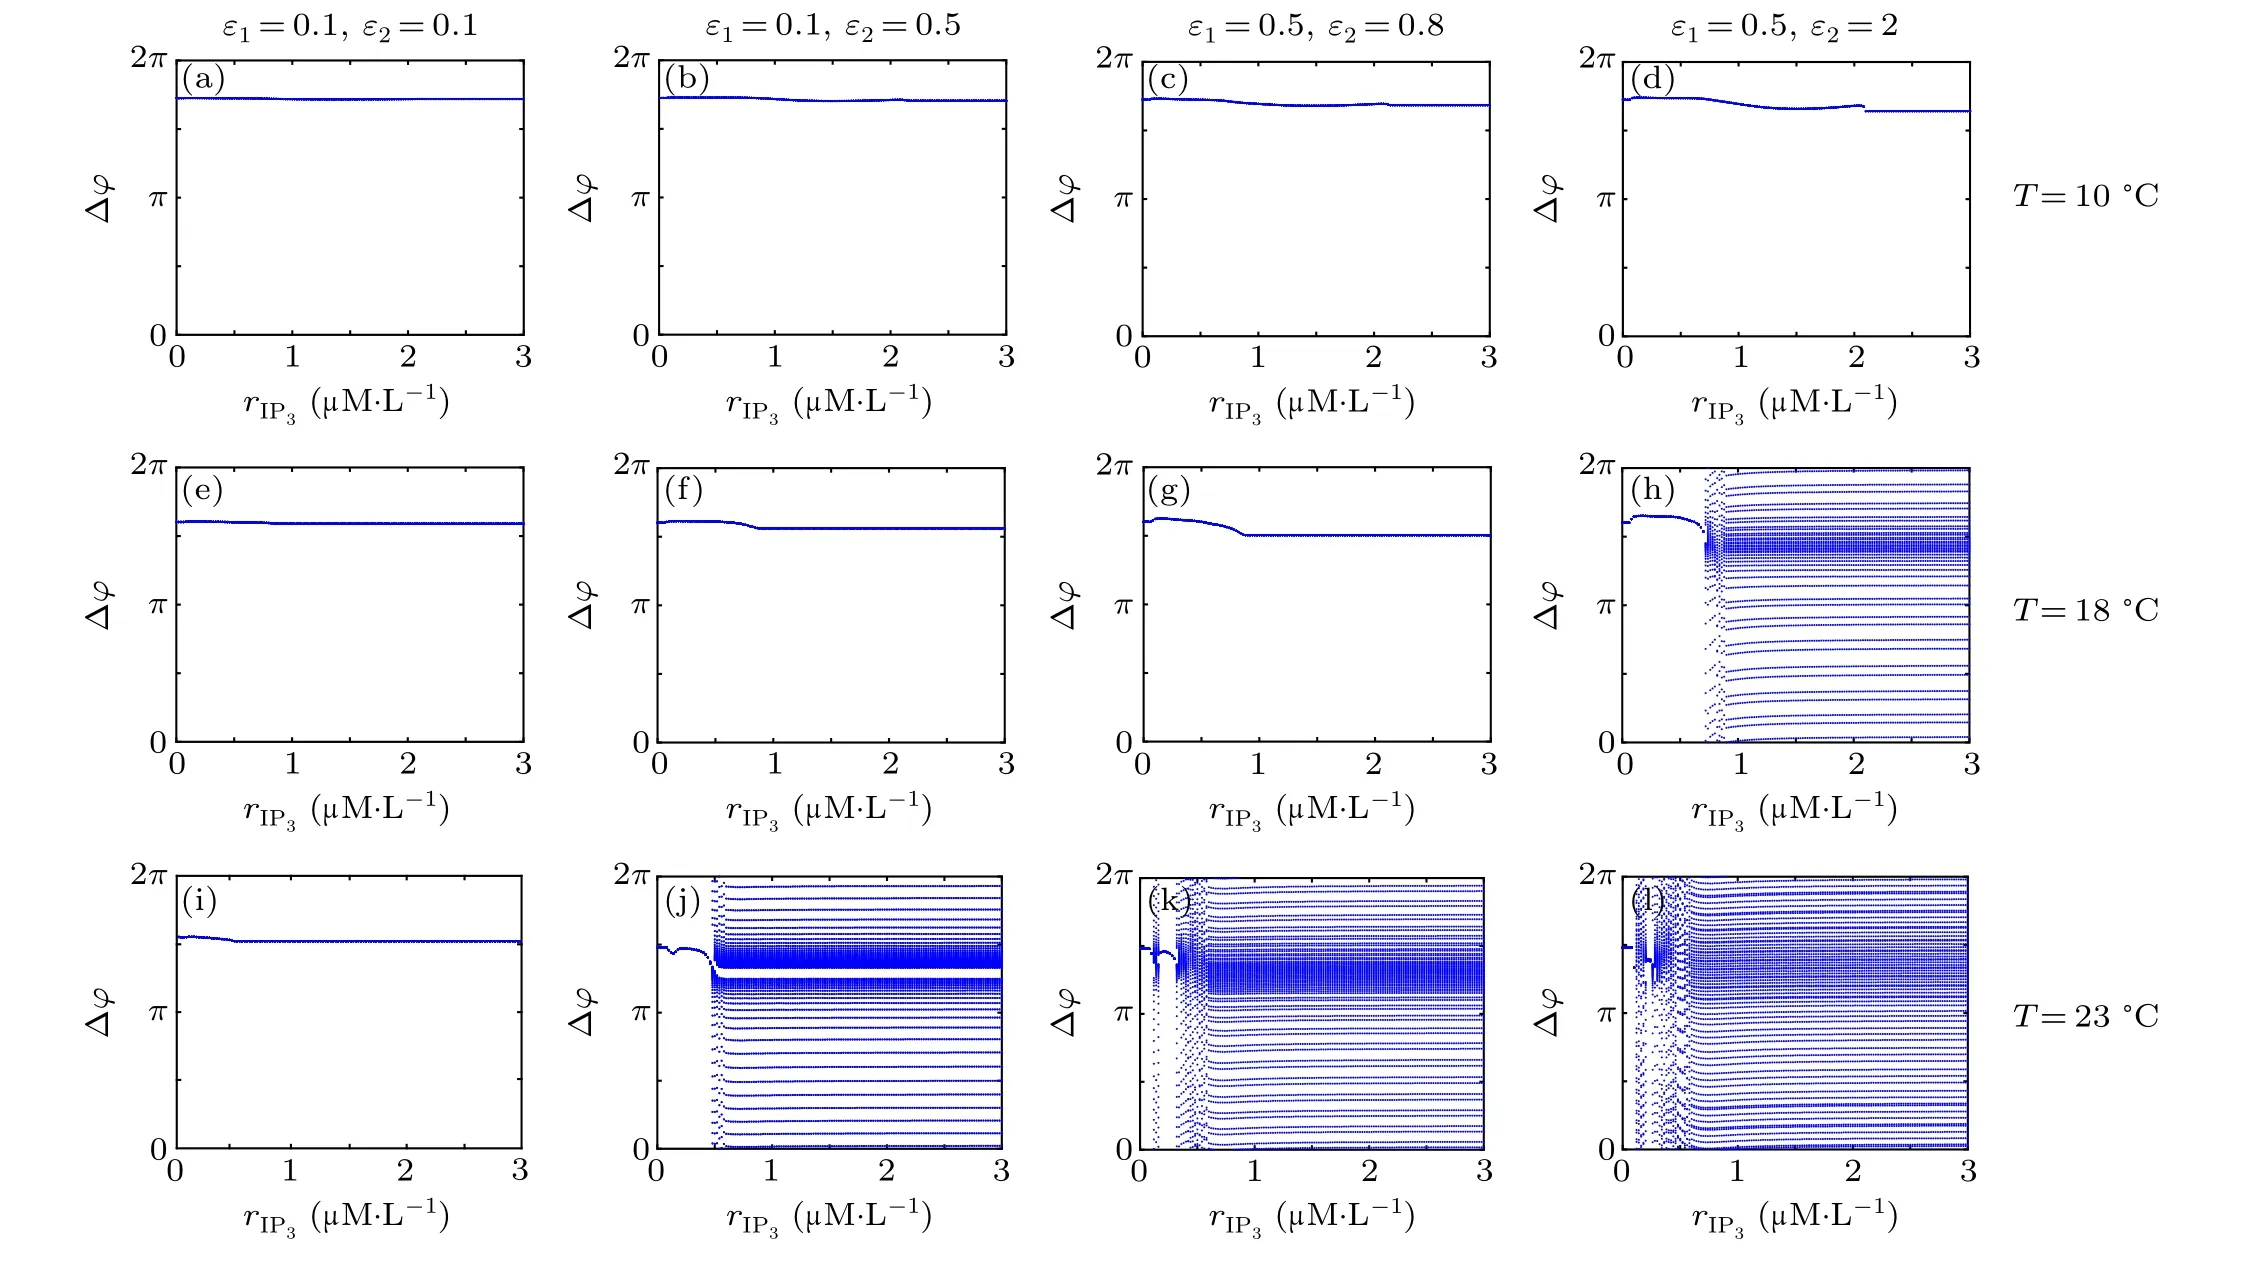
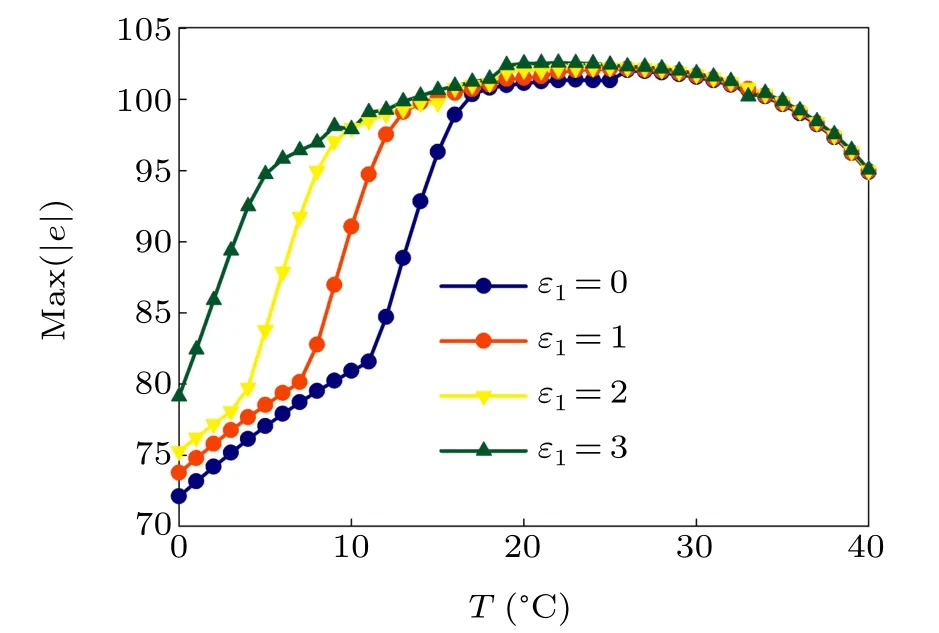
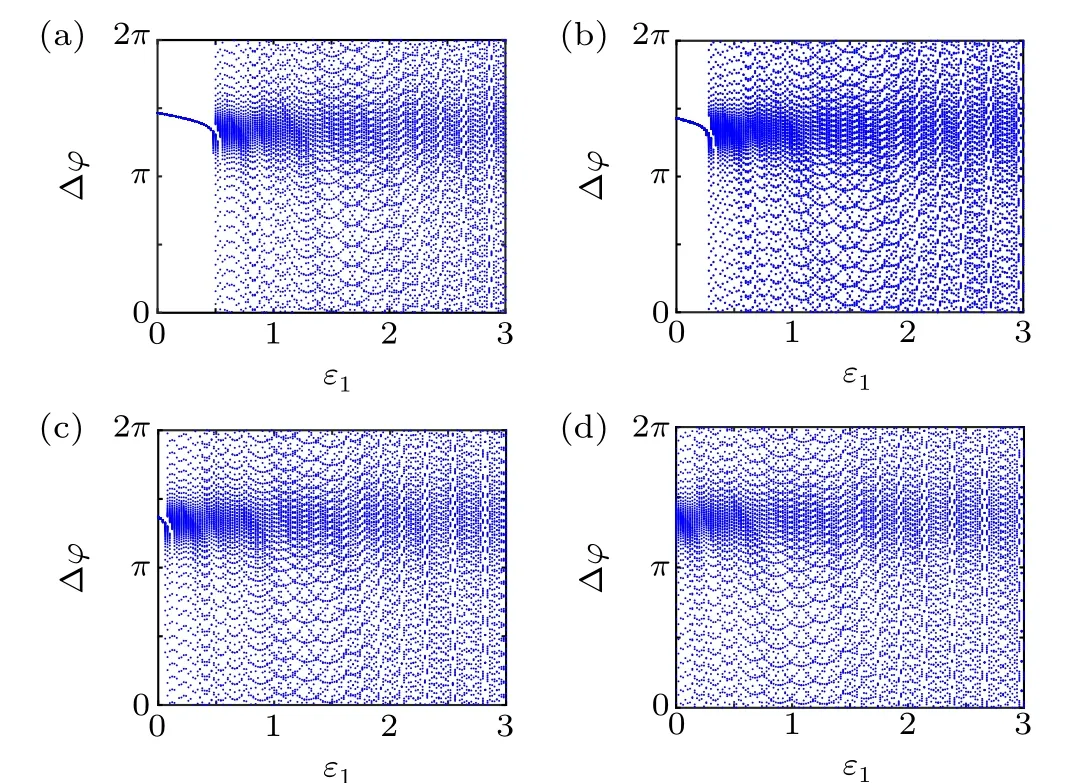
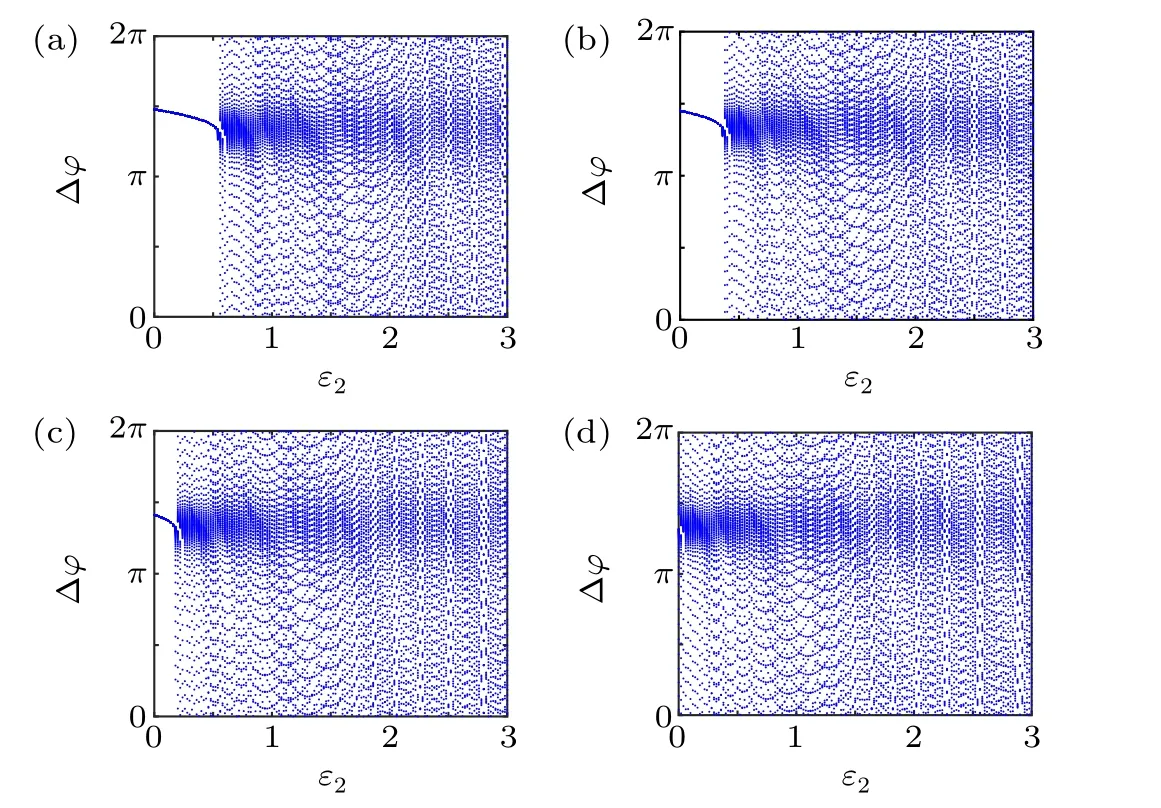
First,we study the effect of IP3production rate on the discharge synchronization in thermosensitive neurons. Max(|e|)was calculated between a pyramidal cell and an interneuron depending on the temperatureT(0◦C Fig. 2. Maximum synchronization error of neurons (max(|e|)) with astrocytes depending on the temperature(T)for various IP3 production rates(rIP3)(ε1=1,ε2=1,0 ◦C According to Fig. 2, the variation of max(|e|) is related to temperature. Specifically,a range of temperature,approximately 18◦C In order to obtain more details about the effects ofTandrIP3on the synchronization of two neurons, we calculate the maximum synchronization error max(|e|)of two neurons in a wide range ofT(T=0◦C–40◦C)andrIP3(rIP3=0µM·s−1–3 µM·s−1). The results are presented inT–rIP3parameter space in Fig.3. In Fig. 3, a certain region constraint byrIP3andTrepresents weak synchronization,and max(|e|)reaches the maximum at about 23◦C. The trend of max(|e|)is consistent with that reflected in Fig.2. There is a triangular region of weak irregular variation with an increase ofrIP3at 0◦C Fig.3. Contour map of max(|e|)depending on the IP3 production rate(rIP3)and the temperature(T)(ε1=1,ε2=1,0 ◦C To quantify the phase synchronization of two neurons at a certain temperature,the phase difference(∆ϕ)as a function of IP3production rate is shown in Fig.4. In Fig.3,the different synchronization state features under different temperatures are obvious. In order to study the typical synchronization situation,we select the temperature values of 10◦C,18◦C,and 23◦C to analyze the relationship between phase synchronization and the astrocyte parameters. WhenT=10◦C,the neurons are in an out-of-phase synchronization state, and the astrocytes have no effect on the phase synchronization of the neurons within the set parameter range in Figs. 4(a)–4(d). AtT=18◦C, when the feedback intensity of the astrocytes is sufficiently large,the phase of the neurons can shift from out-of-phase synchronization to an asynchronous state in Figs. 4(e)–4(h). For example, the neurons enter the asynchronous state whenrIP3exceeds 0.7 in Fig.4(h). AtT=23◦C,the neurons are under weak synchronization in Figs.4(i)–4(l). When the feedback intensity of the astrocytes is small,the two neurons tend to stay in an out-ofphase synchronization state. Under this condition,rIP3does not change the phase synchronization state of the two neurons as the feedback intensity is too low to induce the asynchronous state. According to Figs. 4(j)–4(l), in the range of 0 µM·s−1 In order to investigate the interaction mechanism between IP3concentration, Ca2+concentration and neuronal synchronization, the time series of IP3, Ca2+concentration and two neuron membrane potentials are shown in Fig.5. Fig.4. Three row pictures represented by the phase difference with the action of different rIP3 with T =10 ◦C,T =18 ◦C,and T =23 ◦C from top to bottom. Fig.5. Three rows of images representing the time series of neuronal membrane potential, IP3 concentration and Ca2+ concentration from top to bottom. (ε1=0.5,ε2=2,T =23 ◦C). It is shown that the two neurons are in the state of peak firing with several values ofrIP3atT=23◦C under weak synchronization in Figs. 5(a)–5(c). The state of the neurons in Fig. 5(a) is out-of-phase synchronous. The state of the neurons in Figs.5(b)and 5(c)is asynchronous,with another representation of the characteristics of intermittent synchronization.Comparing the results in Figs. 5(d) and 5(g), Figs. 5(e) and 5(h)to Figs.5(f)and 5(i),respectively,the envelope curves of IP3and Ca2+concentration oscillate. In addition, the oscillation frequency increases with an increase inrIP3. Thus, the high oscillation frequency of the envelope curves is accompanied by the asynchronous phenomenon of neurons. Moreover,at the peak of the envelope curves of IP3and Ca2+concentration, the neuronal discharges are in synchronization. Therefore,the spiking synchronization is related to the peaks of the envelope curves of IP3and Ca2+concentration. Theε1is one of the important coefficients of negative feedback in the communication between an astrocyte and a pyramidal cell. Indeed, the parameterε1can reflect the inactivation intensity of ATP concentration produced by the astrocyte to the excitatory pyramidal cell. For the purpose of investigating the role of the negative feedback coefficient of astrocytes on the synchronization of thermosensitive neurons, we calculate max(|e|) with different values ofε1(ε1= 0,1,2,3) in the temperature range 0◦C Fig. 6. Maximum synchronization error of neurons (max(|e|)) with astrocytes depending on the temperature(T)for various negative feedback coefficients(ε1)(rIP3 =0.8µM·s−1,ε2=0.1,0 ◦C As shown in Fig. 6, with an increase in temperature,max(|e|)first rises sharply and then decreases. When the temperature is varied over the range 0◦C–18◦C, max(|e|) increases with an increase inε1. This trend of max(|e|) means that the increase in the negative feedback coefficient plays a role in the weak synchronization of neurons. In addition,when 27◦C To investigate the phenomenon in more detail,we calculate the maximum synchronization error max(|e|) in a wide range of negative feedback coefficientε1(ε1=0–3)and temperatureT(T=0◦C–40◦C). The obtained results are presented inT–ε1parameter space in Fig.7. Fig.7. Contour plot of max(|e|)depending on negative feedback coefficient(ε1)of astrocytes to pyramidal cells and temperature(T)(rIP3 =0.8µM·s−1,ε2=0.1,0 ◦C Fig. 8. Phase difference with the action of different ε1 with (a) rIP3 =0.8 µM·s−1, ε2 = 0.1, (b) rIP3 = 0.8 µM·s−1, ε2 = 0.3, (c) rIP3 =0.8µM·s−1,ε2=0.5,(d)rIP3 =0.8µM·s−1,ε2=0.7(T =23 ◦C). It is obvious that the oscillation behavior of neurons appears with the change in temperature and feedback coefficient for max(|e|) intuitively shown in Fig. 7. The maximal region of max(|e|) (red irregular area in Fig. 7) results from a range ofTandε1, which are selected at 19◦C In addition, for temperature (T= 23◦C) under weak synchronization, the phase synchronization of neurons with changing negative feedback coefficient(0<ε1<3)is shown in Fig.8. As shown in Fig. 8(a), whenε2=0.1, the two neurons are in a state of out-of-phase synchronization, and the phase differences are between 0 and 2π. Asε1exceeds 0.5, the phase differences become chaotic,and their values are irregular between 0 and 2π. In this state,the two neurons fire asynchronously. In Fig.8(b), whenε2=0.3, the two neurons are in a state of out-of-phase synchronization. Asε1exceeds 0.25,the phase differences become chaotic,and the two neurons become asynchronous. In Figs. 8(c) and 8(d), the neurons remain almost asynchronous with a change inε1. Thus,the synchronous state of the neurons transits from out-of-phase synchronization to asynchronous with an increase inε1. Through comparison of Figs. 8(a)–8(d), it can be seen that the threshold ofε1for the neuron transition to the asynchronous state decreases gradually with an increase inε2. Significantly, the negative feedback overactivation of astrocytes to neurons leads to an asynchronous state in the neuron–astrocyte system. It is speculated that the increase in negative feedback intensity may promote confusion of pyramidal cell discharge and the asynchronous state of neurons. In some cases,the Ca2+concentration is possibly associated with the two neurons’synchronization. To investigate the relationship between the synchronization and the concentration changes of IP3and Ca2+,figure 9 depicts the time series of IP3, Ca2+concentration and the two neurons’ membrane potentials under variousε1(ε1=0.3,1.3,2.3). Fig.9. Three rows of images representing the time series of neuronal membrane potential,IP3 and Ca2+ concentration from top to bottom(rIP3 =0.8µM·s−1,ε2=0.1)(T =23 ◦C). In order to study the dynamic mechanism of the effects of IP3and Ca2+concentration on the neuronal membrane potential, we take the temperature under weak synchronization(T= 23◦C). It is shown that the two neurons are in the state of peak firing under weak synchronization in Figs.9(a)–9(c). Specifically,figure 9(a)illustrates the out-of-phase synchronous state, and figures 9(b) and 9(c) illustrate the asynchronous state. Meanwhile, the wave crest spacing of envelope curves of IP3and Ca2+concentration decreases gradually with an increase inε1. In other words,with an increase inε1,the oscillation frequency of the IP3and Ca2+concentration envelope curves increases. The above analysis clearly shows that the asynchronous phenomenon of neurons is related to the high-frequency oscillation of the IP3and Ca2+concentration envelope curves. Finally, the parameterε2can reflect the activation intensity of the glutamate concentration produced by astrocytes to inhibitory interneurons. We discuss the effect of a positive feedback coefficient of an astrocyte on the maximum synchronization error in the neuron–astrocyte minimum system. The curves of max(|e|) depending onTare shown in Fig. 10 for different feedback coefficients(ε2=0,1,2,3). Fig. 10. Maximum synchronization error of neurons (max(|e|)) with astrocytes depending on the temperature(T)for various positive feedback coefficients(ε2)(rIP3 =0.8µM·s−1,ε1=0.1,0 ◦C According to Fig. 10, the maximum synchronization error max(|e|)first increases withTand then decreases after exceeding 26◦C. When the temperature is below 18◦C, the curves of max(|e|) slightly decrease asε2increases. This means that the increase inε2promotes the synchronization level of neurons. The results of Fig. 10 show the opposite characteristics toε1(Fig.6). This discrepancy may be due to the different feedback characteristics of astrocytes to pyramidal cells and interneurons. In order to obtain detailed information on the synchronization of neurons affected by the variation in bothε2andT, we select a wide range ofε2(0<ε2<3) andT(0◦C Fig.11. Contour plot of max(|e|)depending on positive feedback coefficient(ε2) of astrocytes to interneurons and temperature (T) (rIP3 =0.8 µM·s−1,ε1=0.1,0 ◦C In Fig.11,the region in red represents almost weak synchronization of neurons,which is probably the maximal value of max(|e|)in the range ofε2(0<ε2<3,20◦C Figure 12 depicts the change in phase synchronization of neurons under the influence ofε2(0<ε2<3)at temperature(T=23◦C)under weak synchronization. Fig. 12. Phase difference with the action of different ε2 with (a) rIP3 =0.8 µM·s−1, ε1 = 0.01, (b) rIP3 = 0.8 µM·s−1, ε1 = 0.2, (c) rIP3 =0.8µM·s−1,ε1=0.4,(d)rIP3 =0.8µM·s−1,ε1=0.6(T =23 ◦C). As shown in Fig.12(a),whenε1=0.01,the two neurons are in a state of out-of-phase synchronization in the range of 0<ε2<0.55, and the phase differences are between 0 and 2π. Asε2exceeds 0.55,the phase differences become chaotic,and their values are irregular between 0 and 2π. In this state,the two neurons fire asynchronously. Whenε1=0.2,the two neurons are in a state of out-of-phase synchronization in the range 0<ε2< 0.4 in Fig. 12(b). Asε2exceeds 0.4, the phase differences become chaotic, and the two neurons become asynchronous. Similarly,whenε1=0.4 andε2exceeds 0.2,the two neurons transit from out-of-phase synchronization to asynchronization in Fig.12(c). Whenε1=0.6,ε2can only cause the asynchronous phenomenon of neurons as shown in Fig. 12(d). As with the regulation ofε1, the phase synchronization of two neurons transits from the out-of-phase synchronization to the asynchronous state when the strength of positive feedback(ε2)reaches a certain threshold. According to Figs. 12(a)–12(d), an increase inε1promotes the critical value of the neuron synchronization state transition to become smaller. It is indicated that the negative feedback of astrocytes to excitatory pyramidal cells and the positive feedback to inhibitory interneurons have the same effect on the phase transition between neurons. In order to further investigate the effect on network synchronization development by gliotransmitter diffusion,we discuss the relations between the concentrations of IP3and Ca2+and synchronization with variousε2(ε2=0.5,1.5,2.5)at the temperature of weak synchronization(T=23◦C)in Fig.13. Figures 13(a)–13(c)show the membrane potential of two neurons, which are in a state of peak firing. Atε2=0.5, the neurons are in an out-of-phase synchronous state in Fig.13(a).Atε2=1.5 in Fig.13(b)andε2=2.5 in Fig.13(c), the neurons are in an asynchronous state.Compared with Figs.13(d)–13(f), the peak-to-peak spacing of the IP3concentration envelope curves gradually decreases. Likewise, compared with Figs. 13(g)–13(i), the peak-to-peak spacing of the Ca2+concentration envelope curves decreases. Moreover,the envelope curve peaks of IP3and Ca2+concentration correspond to the spiking synchronization of neuronal membrane potential. The results are the same as the characteristics ofε1. Fig. 13. Three rows of images representing the time series of neuronal membrane potential, IP3 and Ca2+ concentration from top to bottom.(rIP3 =0.8µM·s−1,ε1=0.01)(T =23 ◦C). It has been widely verified that temperature plays an important role in neuronal discharge and astrocyte function by many experiments. Hence, we studied and analyzed the dynamic mechanism of a temperature-dependent neuron–astrocyte coupling system in this paper. We focused on the synchronization in the thermosensitive neuron–astrocyte minimum system. Firstly,it is indicated that the synchronization of neurons under the influence of temperature can be nonlinearly regulated by the IP3production rate in astrocytes and the feedback coefficients of astrocytes to pyramidal cells and interneurons.Recently, experiments have shown that the apoptosis and activation of astrocytes are inhibited by low temperature.[40]In this paper,we also observed that neuronal synchronization was strongly regulated by the presence of astrocytes at low temperature(probably 0◦C In addition, it is revealed that the synchronization between pyramidal cells and interneurons can be prominently decreased by the temperature at a range of IP3production rates(0.2µM·s−1 Then,we studied the effect of a change in IP3production rate and the feedback coefficients of astrocytes on the phase synchronization of two neurons at temperature (T=23◦C).The two neurons can be in weak synchronization at 23◦C.According to the phase diagrams of Figs. 4, 8 and 12, with an increase of IP3production rate and feedback intensities for astrocytes,two neurons transit from out-of-phase synchronization to an asynchronous state at the temperature of weak synchronization. Finally, we studied the interaction mechanism between synchronization and the concentrations of IP3and Ca2+at a temperature under weak synchronization (T=23◦C). With increases inrIP3,ε1, andε2, the oscillation frequency of the IP3and Ca2+concentration envelope curves increases,and the peak-to-peak distance of the envelope curves decreases. Note that we have previously analyzed that an increase in astrocyte parameters promoted the phase transition of neurons.The phase transition of neurons is closely related to the oscillation frequency and peak-to-peak distance of the envelope curves of IP3and Ca2+concentration.Furthermore,we found that intermittent synchronization occurs when neurons are in an asynchronous state. This result is consistent with the finding that astrocytes can induce intermittent synchronization of neurons in Ref.[26]. In particular, Makovkin[26]showed that the frequency of calcium oscillations in astrocytes was not sensitive to the synchronization between neurons. However, we found that the frequency of the Ca2+concentration envelope was related to the phase synchronization of neurons. Analyzing the results of the neuronal membrane potential and the Ca2+concentration, it was observed that the envelope curve peaks of Ca2+concentration corresponded to the spiking synchronization state of neurons. This difference in results may be due to the temperature fact. In summary, it is interpreted that the neuronal discharge activity is regulated by Ca2+,a result that is consistent with Ref.[50]. When the synchronization level of neurons is very weak,cognitive function is impeded. In this paper,we have studied a synchronous regulation mechanism based on a thermosensitive neuron–astrocyte minimum system model in the hippocampus,especially under the temperature of weak synchronization. These results can provide a helpful basis to understanding cognitive impairment and treating nervous system diseases. In future work, we will consider a complex model more approximate to a realistic brain, including more functional neurons, e.g., dopaminergic neurons, medial septum neurons and guardian neurons in the preoptic area of the hypothalamus. We hope to contribute to the exploration of the mechanism of cognitive dysfunction and neurological disorders such as epilepsy. Acknowledgments Project supported by the National Natural Science Foundation of China (Grant Nos. 51607056, 51737003, and 51877069)and State Key Laboratory of Reliability and Intelligence of Electrical Equipment,Hebei University of Technology(Grant No.EERI PI2020006).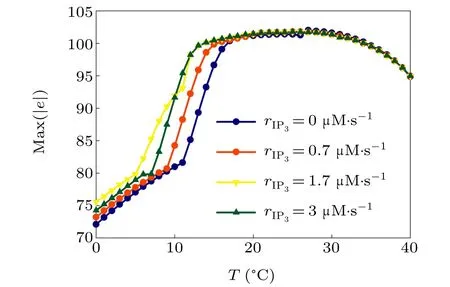


3.2. Effect of ε1 on the electrical activity of thermosensitive neurons


3.3. Effect of ε2 on the electrical activity of thermosensitive neurons


4. Discussion and conclusion
猜你喜欢
火花(2022年6期)2022-06-16Plasma Science and Technology(2021年6期)2021-11-30考试与评价·七年级版(2021年3期)2021-08-14Plasma Science and Technology(2021年6期)2021-06-21歌海(2021年6期)2021-02-01青年生活(2019年3期)2019-09-10美与时代·美术学刊(2018年4期)2018-06-21小学生必读(中年级版)(2018年3期)2018-06-05小说月刊(2017年8期)2017-08-16美与时代·城市版(2017年4期)2017-06-09