TMEM16F may be a new therapeutic target for Alzheimer’s disease
Zhi-Qiang Cui, Xiao-Ying Hu, Tuo Yang, Jing-Wei Guan, Ying Gu, Hui-Yuan Li, Hui-Yu Zhang, Qing-Huan Xiao , Xiao-Hong Sun,
Abstract TMEM16F is involved in many physiological processes such as blood coagulation, cell membrane fusion and bone mineralization. Activation of TMEM16F has been studied in various central nervous system diseases. High TMEM16F level has been also found to participate in microglial phagocytosis and transformation. Microglia-mediated neuroinflammation is a key factor in promoting the progression of Alzheimer’s disease. However, few studies have examined the effects of TMEM16F on neuroinflammation in Alzheimer’s disease. In this study, we established TMEM16F-knockdown AD model in vitro and in vivo to investigate the underlying regulatory mechanism about TMEM16F-mediated neuroinflammation in AD. We performed a Morris water maze test to evaluate the spatial memory ability of animals and detected markers for the microglia M1/M2 phenotype and NLRP3 inflammasome. Our results showed that TMEM16F was elevated in 9-month-old APP/PS1 mice. After TMEM16F knockdown in mice, spatial memory ability was improved, microglia polarization to the M2 phenotype was promoted, NLRP3 inflammasome activation was inhibited, cell apoptosis and Aβ plaque deposition in brain tissue were reduced, and brain injury was alleviated. We used amyloid-beta (Aβ25‒35) to stimulate human microglia to construct microglia models of Alzheimer’s disease. The levels of TMEM16F, inducible nitric oxide synthase (iNOS), proinflammatory cytokines and NLRP3 inflammasome-associated biomarkers were higher in Aβ25‒35 treated group compared with that in the control group. TMEM16F knockdown enhanced the expression of the M2 phenotype biomarkers Arg1 and Socs3, reduced the release of proinflammatory factors interleukin-1, interleukin-6 and tumor necrosis factor-α, and inhibited NLRP3 inflammasome activation through reducing downstream proinflammatory factors interleukin-1β and interleukin-18. This inhibitory effect of TMEM16F knockdown on M1 microglia was partially reversed by the NLRP3 agonist Nigericin. Our findings suggest that TMEM16F participates in neuroinflammation in Alzheimer’s disease through participating in polarization of microglia and activation of the NLRP3 inflammasome. These results indicate that TMEM16F inhibition may be a potential therapeutic approach for Alzheimer’s disease treatment.
Key Words: Alzheimer’s disease; Aβ plaque; inflammatory cytokines; M1 phenotype; M2 phenotype; microglia polarization; neuroinflammation; NLRP3 inflammasome; siRNA; TMEM16F 1Department of Neurology, The Fourth Affiliated Hospital of China Medical University, Shenyang, Liaoning Province, China; 2Department of Ion Channel Pharmacology, School of Pharmacy, China Medical University, Shenyang, Liaoning Province, China
Introduction 643 Methods 644 Results 645 Discussion 648

Introduction
Alzheimer’s disease (AD) is a progressive neurodegenerative disease that is characterized by the presence of senile plaques and neurofibrillary tangles composed of amyloid-β (Aβ) peptides and phosphorylated tau protein (DeTure and Dickson, 2019). Increasing evidence has suggested that neuroinflammation promotes the progression of AD (Wang et al., 2019; Leng and Edison, 2021). Microglia are the major components of immune outposts in the central nervous system. Activated microglia are classified into two subtypes: the pro-inflammatory M1 phenotype, known as the classical activated state, and the anti-inflammatory M2 phenotype, known as the alternative/selective activated state (Xie et al., 2021). In AD, M1 type microglia produce numerous proinflammatory cytokines leading to rapid aggregations of misfolding Aβ peptides and production of massively neurotoxic substances. M2 type microglia secrete various anti-inflammatory cytokines, including interleukin (IL)-4, IL-10 and transforming growth factor-β, and exhibit a neuroprotective role in the progression of AD, leading to reduced spread of Aβ peptides and reduction of phosphorylated tau protein (Gray et al., 2020; Wang et al., 2021).NOD-like receptor protein 3 (NLRP3) inflammasomes, consisting of the NLRP3 protein, the adaptor apoptosis-related speck-like protein with a caspase enrollment domain (ASC) and caspase-1 precursor proteins, participate in the innate immune process, triggering the secretion of various pro-inflammatory factors in various neurodegenerative diseases (Kelley et al., 2019; Wang et al., 2022). Evidence has shown a connection between NLRP3 inflammasomes and AD. NLRP3 inflammasomes are widely expressed on microglia and reduce the phagocytosis of Aβ by microglia (Liu et al., 2020). In addition, during NLRP3 inflammasome-mediated neuroinflammation, the formation of neurofibrillary tangles by phosphorylated tau protein is increased and proinflammatory mature IL-1β is produced, causing neurotoxic effects (Feng et al., 2020; Hanslik and Ulland, 2020).
Transmembrane 16F (TMEM16F), also known as ANO6, is a member of the anoctamin (ANO) family and functions as a calcium-activated nonselective ion channel and a Ca-dependent phosphatidylserine (PS) scramblase (Pedemonte and Galietta, 2014; Kunzelmann et al., 2019). Scott syndrome is a rare disorder of blood system with an inherited defect of the procoagulant activity of platelets, caused by a deficiency of TMEM16F (Millington-Burgess and Harper, 2020). TMEM16F acts as the crucial contributor in various central nervous system diseases such as ischemic stroke, amyotrophic lateral sclerosis (ALS) and spinal cord injury through the activity of calcium-activated nonselective ion channel or PS scramblase (Zhao and Gao, 2019; Soulard et al., 2020; Zhang et al., 2020). High TMEM16F level was also found in microglia and participated in microglial phagocytosis and the transforming phenotype (Batti et al., 2016; Zhao and Gao, 2019). However, no study has examined the role of TMEM16F on the pathogenesis of AD.
In this study, we examined the potential role of TMEM16F in AD-related neuroinflammation using an AD microglia model and APP/PS1 transgenic mice.
Methods
Animals
For decreasing the influence of the neuroprotective effect from estrogen (Lai et al., 2017), male mice were used in this study. We obtained 70 male (APP/PS1 transgenic mice 15‒30 g; aged 3‒12 months) and 50 male C57BL/6 mice (15‒30 g, aged 3‒12 months) from SPF Biotechnology Co., Ltd. (Beijing, China; license No. SCXK (Jing) 2019-0010). The animals were housed in specific-pathogenfree conditions at the Experimental Animal Center, China Medical University; animal were kept on a 12-hour light/dark cycle in a climate-regulated room at 12‒24°C and 60% humidity, with free access to food and water. The animal protocols were approved by the Animal Welfare and Ethics Committee, China Medical University Laboratory, China and authorized by the Institutional Animal Care and Application Commission (IACUC approval No. CMU2020096, approval date: July 21, 2020). All experiments were designed and reported according to the Animal Research: Reporting ofIn Vivo
Experiments (ARRIVE) guidelines (Percie du Sert et al., 2020).In one experiment, 3 month APP/PS1 (n
= 10), 6 month APP/PS1 (n
= 10), 9 month APP/PS1 (n
= 10), and 12 month APP/PS1 groups (n
= 10) and agematched wild type (WT,n
= 40) were used to evaluate the changes in the expression of TMEM16F. In a second experiment, 9-month-old mice were divided into four groups: WT (n
= 10), APP/PS1 (n
= 10), APP/PS1-NC (n
= 10), and APP/PS1-siRNA TMEM16F groups (n
= 10). Groups were treated as described in the following section. A schematic diagram of the experiments is shown inAdditional Figure 1
.Stereotactic injection of siRNA into mouse brain
TMEM16F siRNA (forward primer: 5′-GAA GAG GUA UUG AAU GCU A-3′; reverse primer: 5′-UAG CAU UCA AUA CCU CUU C-3′) was obtained from RiboBio (Guangzhou, China). siRNA was transfected into the brain of mice using Entranster-in-vivo
(Cat# 18668-11-1, Engreen Biosystem, Beijing, China), following the company instructions. Briefly, siRNA-Negative Control (siRNA-NC) or siRNA-TMEM16F (5 µg) were dissolved in 5 µL RNase-free water with 10 µL transfection reagent (Shen et al., 2021). The mice were anesthetized with 2% phenobarbital (Cat# 128946, J&K Scientific, Beijing, China) via intraperitoneal injection at a dosage of 45 mg/kg. Using a stereotactic locator (RWD Life Science, Shenzhen, China), the 5 µL mixture was injected at a rate of 0.2 µL/min into the bilateral hippocampus using the following coordinates (with the bregma as the center):X
axis: ±2 mm,Y
axis: ‒2.4 mm, andZ
axis: ‒1.7 mm (Li et al., 2017). After stereotactic injection, the mice from APP/PS1-NC groups and APP/PS1-siRNA TMEM16F groups received subcutaneous injection of penicillin-streptomycin solution (Cat# C0222, Beyotime, Shanghai, China) and the mice received stereotactic injection with siRNA again on days 3 and 6 after the first injection. On day 7, the behavioral experiment was performed.Morris water maze test
The Morris water maze test, a classic approach for assessing spatial memory in mice, is composed of three trials: a visible platform trial, a hidden platform trial, and a probe trial (Reiserer et al., 2007). After a sufficient acclimation period, each mouse was placed in a circular pool 1.2 m in diameter, and the mice then searched for a circular platform for 60 seconds from three quadrants. During the visible platform trial, mice searched for a platform that was 1 cm above the surface of water. If mice could not locate the platform during the 1-minute period, they were placed on the platform for 30 seconds. After the 1-day hidden platform trial, the mice that never located the platform or that jumped from the platform many times were excluded from the experiment. Six mice from each group were selected for the hidden platform trial. For the 5-day hidden platform trial, the daily test steps were the same as that in the visible platform trial, except that the platform was submerged 1 cm below the surface of water. On the 7day, the mice swam above the water face without the platform from the same starting point and we recorded the numbers of mice crossing over the target platform and the time spent in the target quadrant in each trial. The water maze system and system for analyzing recorded data were supplied by Beijing ShuoLinYuan Instruments Inc. (Beijing, China).
Immunohistochemistry assay
Six mice from each group were anesthetized by 2% phenobarbital via intraperitoneal injection and then transcardially perfused with normal saline and 4% paraformaldehyde. After paraffin-embedding, brain tissues were cut into slices at 5 µm thickness. Endogenous peroxidase activity was blocked by a 30-minute incubation with 3% HO. After washing in phosphate buffered saline (PBS; Cat# ST448, Beyotime), sections were blocked in 5% bovine serum albumin (Cat# ST025, Beyotime) for 30 minutes and then probed with a rabbit anti-TMEM16F polyclonal antibody (1:50, Proteintech, Wuhan, China, Cat# 20784-1-AP, RRID: AB_2878737), rabbit anti-Aβ (1:300, Wanleibio, Shenyang, China, Cat# WL01427) and rabbit anti-caspase-3 (1:100, Wanleibio, Cat# WL02117) overnight at 4°C, followed by a 30-minute incubation with the biotinylated anti-rabbit secondary antibody (1:100, Zhongshan Inc, Beijing, China, Cat# SP-9002-1) at room temperature. After a 5-minute incubation with diaminobenzidine (Cat# P0202, Beyotime), the sections were treated with hematoxylin to stain the nuclei. Finally, sections were observed by optical microscopy (Olympus Corporation, Tokyo, Japan). TMEM16F, Aβ and caspase-3 were quantified by measuring the immunostained areas on the sections. The Aipathwell digital pathological image analysis software from Servicebio (Wuhan, China) was used for automatic image analysis. Analysis was divided into four steps: tracing, color selection, calculation, and analysis. The positive cell ratio (number of positive cells/total number of cells) was used for quantification (Benonisson et al., 2019).
Immunofluorescence assay
Brain tissue sections were incubated with 0.1% Triton X-100 for 2 hours and blocked with 5% bovine serum albumin. After washes with PBS, sections were incubated with the following primary antibodies: rabbit anti-inducible nitric oxide synthase (iNOS, 1:100, Proteintech, Cat# 18985, RRID: AB_2782960), rabbit anti-NLRP3 (1:100, Proteintech, Cat# 19771, RRID: AB_2881528) and goat anti-ionized calcium binding adapter molecule 1 (Iba-1, 1:100, Novus, Littleton, CO, USA, Cat# NB100-1028, RRID: AB_521594) overnight at 4°C. Sections were then incubated with Cy3 rabbit anti-goat IgG (H+L) (1:100, APExBIO, Houston, TX, USA, Cat# K1215) and fluoresceine isothiocyanate (FITC) goat anti-rabbit IgG (H+L) (1:100, APExBIO, Cat#K1203) for 1 hour at room temperature. Sections were then stained with 4,6-diamino-2-phenyl indole (Beyotime, Cat# C1002). The sections were then observed with a fluorescence microscope (Hitachi Co., Tokyo, Japan).
Hematoxylin and eosin staining
After paraffin embedding of brain tissue sections, a series of graded alcohol was used to deparaffinize and rehydrate the sections. Sections were rinsed in water for 10 minutes, followed by staining with hematoxylin for 2 minutes at room temperature and a 10-minute wash with tap water. The sections were then soaked in 1% hydrochloric alcohol for 3 seconds, followed by eosin staining for 1 minute at room temperature. After dehydration with 95% ethanol and anhydrous ethanol, sections were immersed in xylene changes for 5 minutes each. A light microscope (Olympus Corporation, Tokyo, Japan) with a magnification of 400× was used to examine the sections.
Transmission electron microscopy
The brains of mice were quickly removed after mice were anesthetized with pentobarbital sodium. The hippocampus was sliced into 1 mm thick blocks, and the separated tissues were fixed for 2 hours in a transmission electron microscopy (TEM)-specific fix solution (Cat#G1102, Servicebio) and then washed twice in PBS. Osmic acid was used to stain the tissues, and alcohol and acetone were used to dehydrate the samples. The brain tissues were embedded in resin and then stained with acetic acid uranium and lead before being examined by TEM (Hitachi Co.).
Enzyme-linked immunosorbent assay
Brain tissues were lysed and homogenized in immunoprecipitation assay buffer (Beyotime, Cat# P0013D) with protease inhibitor (BB-3301, Bestbio, Nanjing, China). Sections were then analyzed using kits for mouse IL-18 (Andy Gene, Beijing, China, Cat# AD1905Mo), mouse IL-1β (Andy Gene, Cat# AD3364Mo), mouse IL-6 (Jiangsu Meibiao Biotechnology Co., Ltd., Nanjing, China, Cat# MB-2899A) and mouse IL-4 (Jiangsu Meibiao Biotechnology Co., Ltd., Cat# MB-3400A) following the manufacturer’s instruction.
Measurement of caspase-1 activity
A caspase-1 activity assay kit (Beyotime, Cat# C1101) was used to measure the activity of caspase-1 following the manufacturer’s protocol. The tissues from cortex and hippocampus were homogenized. After centrifugation, the supernatants were divided into two parts. One part was used for measuring protein concentration using the Bradford assay kit (Cat# BL524A, Biosharp, Hefei, China) and the other part was treated with Ac-YVAD-pNA (Beyotime, Cat# C1101) in the dark. A microplate reader was used to measure absorbance values at 405 nm. A p-nitroaniline (pNA) standard curve was used to estimate caspase-1 activity (Zhong et al., 2019). Caspase-1 activity was determined as a ratio to that of the wild-type group.
Cell culture
Human microglia clones 3 (HMC3)cells (Procell, Wuhan, China, Cat# CL-0620) were established through immortalization of a human primary microglia culture (Janabi et al., 1995). The detailed information about cell morphology, antigenic profile and functional properties of HMC3 were described previously (Dello Russo et al., 2018). HMC3 cells were cultured in modification of Eagle’s medium (MEM, Procell, Cat# PM150410) supplemented with 10% fetal bovine serum (Procell, Cat# 164210) at 37°C in a humidified atmosphere with 95% air and 5% CO. Every 3 days, the culture medium was replaced or cells were passaged. A schematic diagram of the cell experiment is shown inAdditional Figure 2
.Cell transfection
Control siRNA and TMEM16F siRNA (RiboBio) were transfected into HMC3 cells using Lipo8000Transfection Reagent (Beyotime, Cat# C0533) following the manufacturer’s protocol. Nigericin (Topscience, Shanghai, China, Cat# T16323) is an agonist of NLRP3. Cells were divided into five groups: Control group (untreated), Aβ(Cat#A1039, APExBIO)-treated group (treated with 20 µM Aβfor 24 hours), siRNA-NC group (transfected with siRNA negative control for 48 hours and then treated with 20 µM Aβfor 24 hours), siRNATMEM16F group (transfected with TMEM16F siRNA for 48 hours and then treated with 20 µM Aβfor 24 hours) and siRNA-TMEM16F + Nigericin group (transfected with TMEM16F siRNA for 48 hours and then cultured in 5 µM Nigericin for 1 hour and 20 µM Aβfor 24 hours). After 24 hours of incubation, the supernatants and cells were harvested for enzyme-linked immunosorbent assay, PCR and western blot analyses. The sequences of siRNA-TMEM16Fin vitro
are shown inTable 1
.
Table 1 |Pirmers sequences of siRNA-TMEM16F used in the cell transfection
Western blot assay
Frozen hippocampal tissue or HMC3 cells were homogenized and lysed, and protein contents were measured with a BCA kit (Bestbio, Cat# BB-3401). Protein samples were separated on SDS-polyacrylamide gels, followed by transfer to a PVDF membrane. The membrane was immersed in QuickBlock™ Blocking Buffer for Western Blot (Beyotime, Cat# P0252) for 15 minutes and then incubated with the following primary antibodies overnight at 4°C: rabbit anti-TMEM16F (1:500, Proteintech, Cat# 20784-1-AP, RRID: AB_2878737), rabbit anti-iNOS (1:100, Proteintech, Cat# 18985-1-AP, RRID: AB_2782960), mouse anti-arginase 1 (Arg1; 1:2000, Proteintech, Cat# 66129-1-Ig, RRID: AB_2881528), rabbit anti-NLRP3 (1:500, Proteintech, Cat# 19771-1-AP, RRID: AB_2881528), rabbit anti-pro-caspase 1 (1:1000, Proteintech, Cat# 22915-1-AP, RRID: AB_2876874), rabbit anti-cyclo-oxygenase 2 (Cox 2; 1:1000, Wanleibio, Cat# WL01750), rabbit anti-suppressor of cytokine signaling 3 (Socs 3; 1:1000, Wanleibio, Cat# WL01364), rabbit anti-ASC (1:500, Wanleibio, Cat# WL02462), rabbit anti-B-cell lymphoma-2 (Bcl2, 1:1000, Wanleibio, Cat# WL01556), rabbit anti-caspase-3 (1:1000, Cell Signaling Technology, Cat# 9662, RRID: AB_331439), rabbit anti-BCL-2-associated X (Bax, 1:1000, Cell Signaling Technology, Cat# 5023, RRID: AB_10557411) and rabbit antiβ-actin (1:2000, Biogot, Nanjing, China, Cat# AP0060, RRID: AB_2797445). Membranes were washed in Tris-buffered saline Tween and incubated for 1 hour in goat anti-rabbit IgG (H+L)-horseradish peroxidase-labeled antibody (1:2000, Biogot, Cat# BS13278, RRID: AB_2773728) at room temperature. After washing the membrane in Tris-buffered saline Tween, the ECL Chemiluminescent Substrate Reagent (Tannon, Shanghai, China, Cat# 180-5001) was used to visualize the immunoreactive bands. Band densities were evaluated with ImageJ Software version 1.8.0 (National Institutes of Health, Bethesda, MD, USA) (Schneider et al., 2012). The band densities of protein expression were normalized to β-actin as an internal reference.
Real-time polymerase chain reaction analysis
RNA was extracted from HMC3 cells using TRIzol Reagent (Invitrogen, Carlsbad, CA, USA, Cat# 15596026) and then reverse transcribed to complementary DNA using the Evo M-MLV RT Kit for qPCR (Accurate Biology, Dalian, China, Cat#AG11711). Quantitative real-time PCR was performed with SYBR® Green (Accurate Biology, Cat# AG11702) following the manufacturer’s directions. The reaction conditions were as follow: 30 seconds at 95°C for pre-denaturation, followed by 40 cycles of 15 seconds at 95°C and 1 minute at 60°C. Primer sequences are shown inTable 2
. GAPDH mRNA was used as an internal control for target mRNA expression analysis. We used the 2method (Livak and Schmittgen, 2001) for quantification to analyze the results.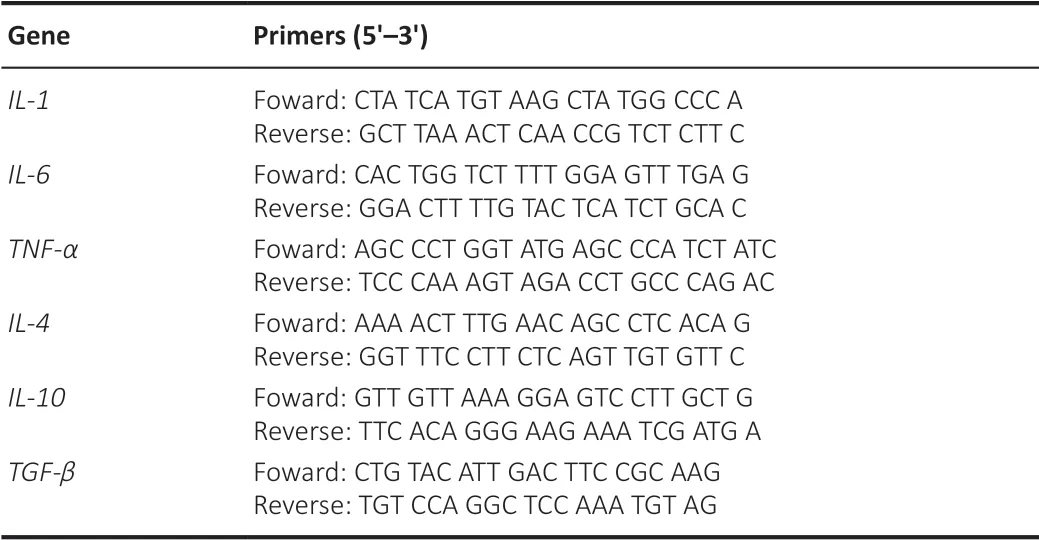
Table 2 | Pirmers sequences used in the PCR experiment
Neuron-microglia coculture system
SH-SY5Y cells (National Collection of Authenticated Cell Cultures, Beijing, China, Cat# SCSP-5014) were plated in 6-well plates at a density of 1 × 10cells per well in Dulbecco’s modified Eagle’s medium (DMEM/F12, Procell, Cat# PM150251) containing 10% fetal bovine serum and cultured for 24 hours. The medium was then replaced by the microglial conditioned medium (CM, supernatant of HMC3 cells) for an additional 24 hours. The neuronmicroglia coculture system was divided into four groups: Control-CM group (SH-SY5Y cells treated with supernatant of HMC3 cells from Control group), Aβ-treated-CM (SH-SY5Y cells treated with supernatant of HMC3 cells from Aβ-treated group), siRNA-NC-CM (SH-SY5Y cells treated with supernatant of HMC3 cells from siRNA-NC group) and siRNA-TMEM16F-CM (SH-SY5Y cells treated with supernatant of HMC3 cells from siRNA-TMEM16F group) groups.
Flow cytometry assay
Flow cytometry assay was performed to evaluate the influence of microglial conditioned medium on the apoptosis of neuron. SH-SY5Y cells from the above coculture system were harvested and washed with cold PBS, and then 195 µL binding buffer was added. Cells were incubated with 5 µL Annexin V‒fluoresceine isothiocyanate (FITC) (Bestbio, Cat# BB-41033) for 10 minutes, followed by incubation with 10 µL propidium iodide (PI) for 5 minutes at room temperature in the dark. Flow cytometry (BD, Franklin Lakes, NJ, USA) was used to immediately analyze the stained cells.
Measurement of caspase-3 activity
A caspase-3 assay kit (Beyotime, Cat# C1116) was used to measure the activity of caspase-3. SH-SY5Y cells from the coculture system were homogenized or lysed in ice-cold lysis buffer and samples were incubated with 2 mM Ac-DEVD-pNA (Beyotime, Cat# P9710) for 1 hour at 37°C. A microplate spectrophotometer (BioTek, Santa Clara, VT, USA) was used to evaluate readings at 405 nm (Bai et al., 2020).
Statistical analysis
No statistical methods were used to predetermine sample sizes; however, our sample sizes are similar to those reported in previous publications (Deng et al., 2016; Chang et al., 2018). Data were analyzed using GraphPad Prism 9.0.0 software (GraphPad, San Diego, CA, USA, www.graphpad.com) and shown as means ± standard deviation (SD). Changes among various groups were explored by applying one-way analysis of variance followed by Tukey’spost hoc
test for pairwise contrasts. AP
-value of less than 0.05 was of statistical significance.Results
TMEM16F is upregulated in the brains of APP/PS1 mice
We examined TMEM16F expression in the brains of APP/PS1 mice to choose APP/PS1 mice for further behavioral tests and detection of biological indicators. We performed western blot analysis of brain samples from 3-, 6-, 9-, and 12-month-old APP/PS1 mice and age-matched wild-type mice. We found that 6-, 9-, and 12-month-old APP/PS1 mice exhibited high expression of TMEM16F and 9-month-old APP/PS1 mice displayed greatly upregulated TMEM16F levels compared with age-matched wild-type mice (P
< 0.01 orP
< 0.05;Figure 1A
andB
). Immunohistochemistry results further displayed the enhanced immunopositivity of TMEM16F in the brains of 9-month-old APP/PS1 mice compared with that of wild-type mice (Figure 1C
andD
).TMEM16F knockdown alleviates spatial memory deficits in 9-month-old APP/PS1 mice
Our results indicated that TMEM16F is highly expressed in 9-month-old AD mice. Therefore, we next investigated the roles of TMEM16F in cognitive function by silencing TMEM16F using siRNA-TMEM16F injection into the bilateral hippocampus of 9-month-old APP/PS1 mice and performing Morris water maze tests. Compared with mice in the APP/PS1-NC group, the mice from APP/PS1 siRNA-TMEM16F group exhibited shorter escape latency, more time spent in the target quadrant, and more times of crossing the platform (P
< 0.01 orP
< 0.05;Figures 1E–H
).TMEM16F knockdown promotes microglial polarization towards M2 phenotype in APP/PS1 mice
As microglial polarization was closely connected with AD-related neuroinflammation, we next examined the expression of markers related to microglial polarization. Western blot assay revealed that the expression of iNOS, an M1 microglia marker (Yu et al., 2022), was higher in the APP/PS1 group compared with that in the WT group and iNOS was lower in the APP/PS1 siRNA-TMEM16F group, while expression of Arg1, an M2 microglia marker (Yu et al., 2022) was higher compared with those in the APP/PS1-NC group (P
< 0.05;Figure 2A
andB
). Immunofluorescence staining was performed to detect the expression of iNOS in the microglia. The results showed that the number of Iba1and iNOScells in the APP/PS1 siRNA-TMEM16F group was higher compared with that in the APP/PS1-NC group (Figure 2C
andD
).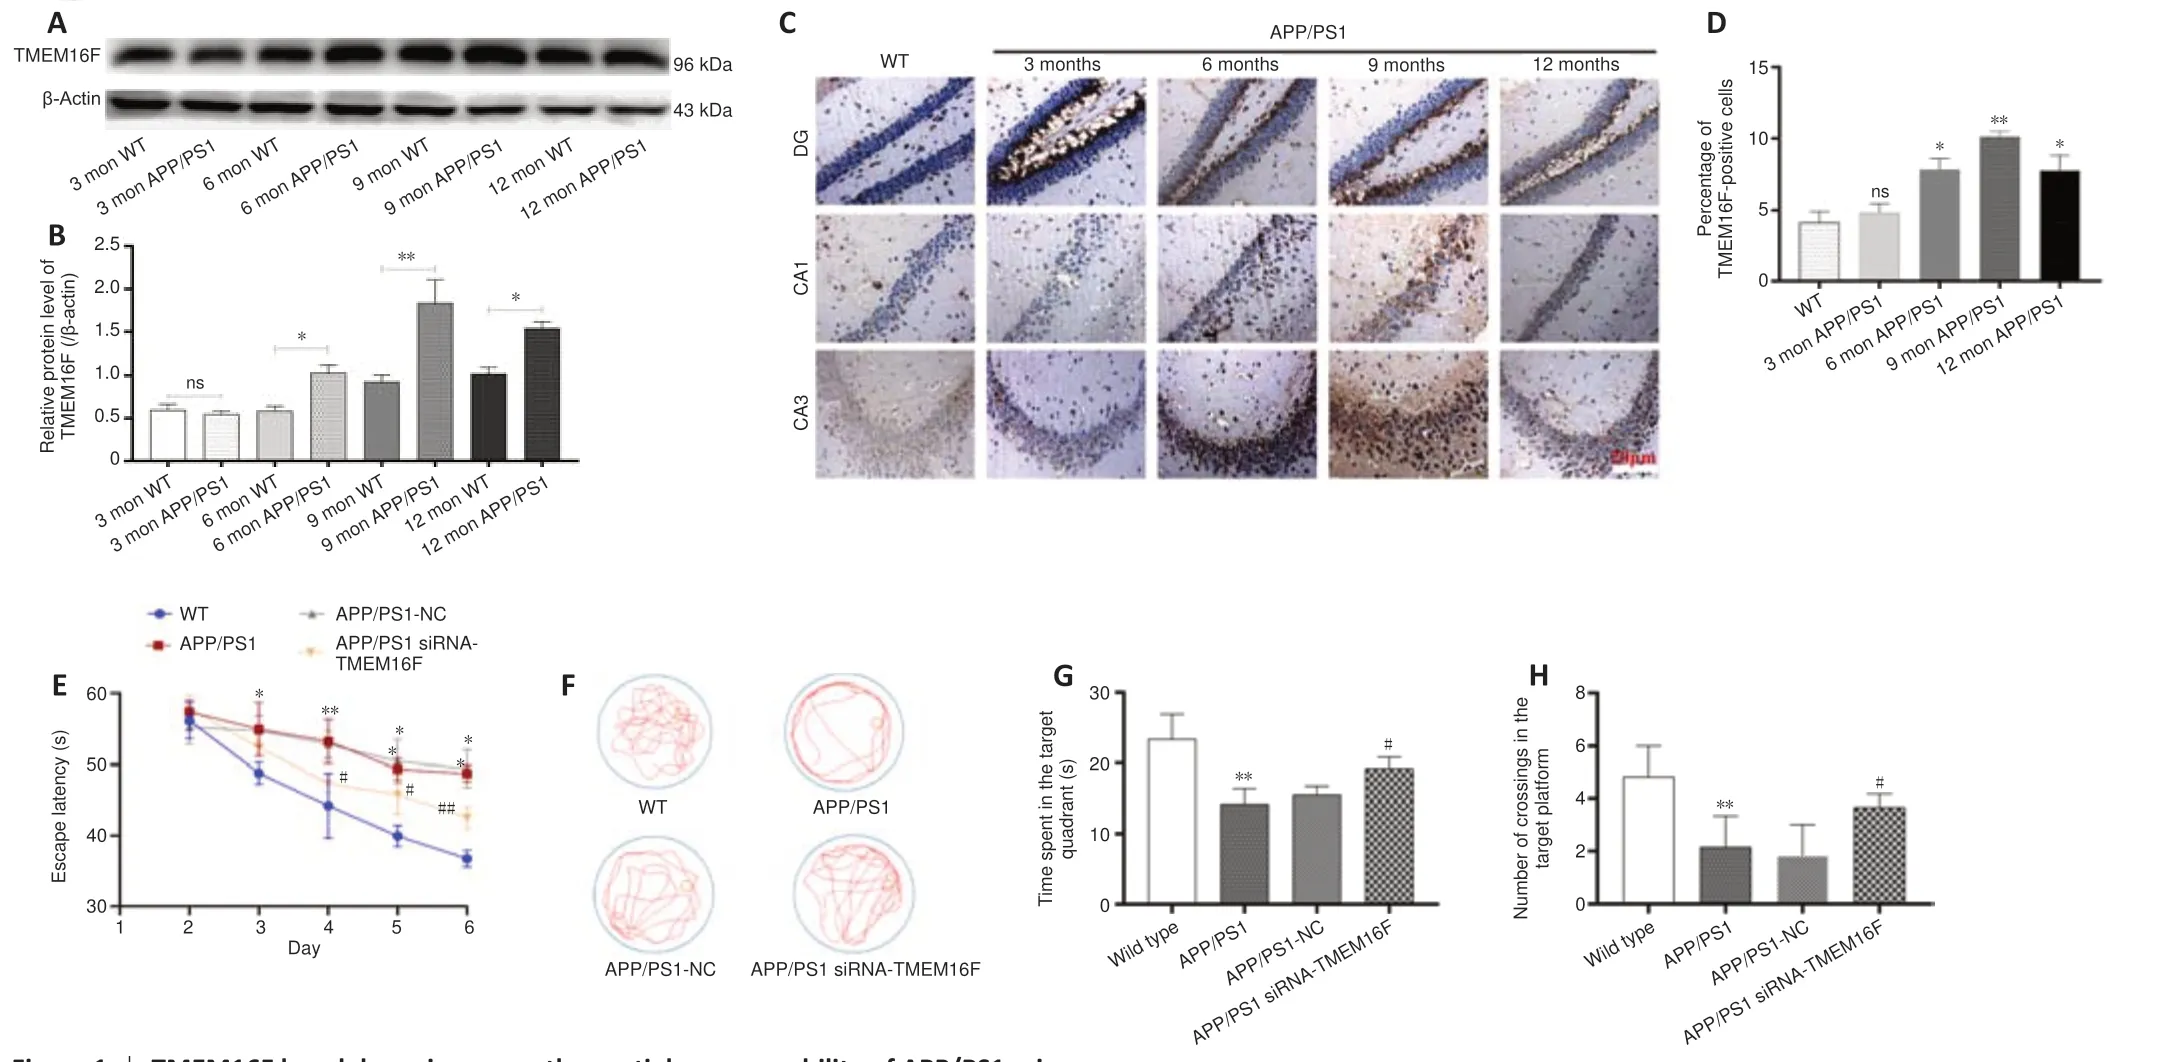
Figure 1 |TMEM16F knockdown improves the spatial memory ability of APP/PS1 mice.(A‒D) The expression levels of TMEM16F in the hippocampus of APP/PS1 mice aged 3, 6, 9 and 12 months were measured by western blot assay (A, B) and immunohistochemistry (C, D). Compared with age-matched wild type mice, 9-month-old APP/PS1 mice displayed greatly upregulated immunopositivity of TMEM16F. Scale bar: 20 µm. (E‒H) Effects of TMEM16F knockdown on spatial memory deficits in 9-month-old APP/PS1 mice were evaluated by the Morris water maze test. (E) Escape latency during the hidden platform trial from day 2 to day 6. (F) The probe trial was performed on day 7. Representative images of mouse tracks. Compared with mice from the APP/PS1-NC group, the mice from the APP/PS1 siRNATMEM16F group crossed the platform more times. (G) Time spent in the target quadrant. (H) Frequency of crossing the platform. Data are shown as the mean ± SD. The experiments were carried using three (A) or six (C, E, G, H) separate samples. *P < 0.05, **P < 0.01, vs. WT group; #P < 0.05, ##P < 0.01, vs. APP/PS1-NC group (one-way analysis of variance followed by Tukey’s post hoc test). APP/PS1: Amyloid precursor protein/presenilin-1; CA: cornu ammonis; DG: dentate gyrus; ns: not significant; WT: wild type.

Figure 2 |TMEM16F knockdown promotes microglial polarization towards M2 phenotype in APP/PS1 mice. The WT group was 9-month-old wild-type mice without treatment. The APP/PS1 group was 9-month-old APP/PS1 mice without treatment. The APP/PS1 group was 9-month-old APP/PS1 mice with stereotactic injection of siRNA-NC into brain hippocampus. The APP/PS1 group was 9-month-old APP/PS1 mice with stereotactic injection of siRNA-TMEM16F into brain hippocampus. (A) Representative immunoblots of TMEM16F, iNOS (M1 microglia marker) and Arg1 (M2 microglia marker) in brain tissues of four animal groups. (B) Quantification of expressions of TMEM16F, iNOS and Arg1. (C, D) Representative immunofluorescence photomicrographs of microglial iNOS in the hippocampus (C) and cortex (D) regions of four animal groups. Compared with mice from the APP/PS1-NC group, the APP/PS1 siRNA-TMEM16F group showed decreased numbers of Iba1+ and iNOS+ cells. Brain sections were stained for iNOS (green, FITC) and the microglial marker Iba-1 (red, Cy3); nuclei were stained by DAPI (blue). The white arrows indicated instances of iNOS co-expression with Iba-1. Scale bars: 20 µm. Data are shown as the mean ± SD. The experiments were carried out using three separate samples. **P < 0.01, vs. WT group; #P < 0.05, vs. APP/PS1-NC group (one-way analysis of variance followed by Tukey’s post hoc test). APP/PS1: Amyloid precursor protein/presenilin-1; Arg1: arginase 1. DAPI: 4,6-diamino-2-phenyl indole; Iba-1: ionized calcium binding adapter molecule 1; iNOS: inducible nitric oxide synthase; WT: wild type.
TMEM16F knockdown reduces activation of the microglial NLRP3 inflammasome in APP/PS1 mice
As activation of microglial NLRP3 inflammasome occurred during the progression of AD, we examined the influence of TMEM16F on the expression of microglial NLRP3 inflammasome. Western blot assay showed that NLRP3 inflammasome was activated in APP/PS1 mice with the upregulation of NLRP3, ASC, and pro-caspase1 compared with the WT group. NLRP3, ASC, and pro-caspase1 expressions were decreased in the APP/PS1 siRNATMEM16F group compared with those in the APP/PS1-NC group (P
< 0.05;Figure 3A
andB
). Furthermore, caspase-1 activity was higher in the APP/PS1 group compared with the WT group, and it was greatly inhibited in the APP/PS1 siRNA-TMEM16F group compared with that in the APP/PS1-NC group (P
< 0.01 orP
< 0.05;Figure 3C
andD
). Immunofluorescence staining showed that the proportion of Iba1and NLRP3cells in the hippocampus and cortex decreased (Figure 3E
andF
). These outcomes showed that TMEM16F knockdown prevents NLRP3 inflammasome activation.TMEM16F knockdown decreases the secretion of pro-inflammatory cytokines and repairs morphological injury of microglia
Because the secretory patterns of inflammatory cytokines will change according to microglial phenotype, we further examined the secretion of inflammatory cytokines. ELISA results showed that secretion of proinflammatory IL-6, IL-1β, and IL-18 from brain tissue in the APP/PS1 was increased compared with the WT group, and the secretory level of IL-6, IL-1β, and IL-18 in the APP/PS1 siRNA-TMEM16F group was decreased compared with the APP/PS1-NC group, while the level of anti-inflammatory IL-4 increased (P
< 0.01 orP
< 0.05;Figure 4A–D
). TEM was performed to observe the ultrastructure of hippocampal tissue. TEM revealed that microglia from the APP/PS1 and APP/PS1-NC groups demonstrated ruptured cell membranes with irregular shapes and exhibited concentrated chromatin with the secretion of cytoplasmic content, which was partially reversed after TMEM16F knockdown by the injection of siRNA-TMEM16F (Figure 4E
).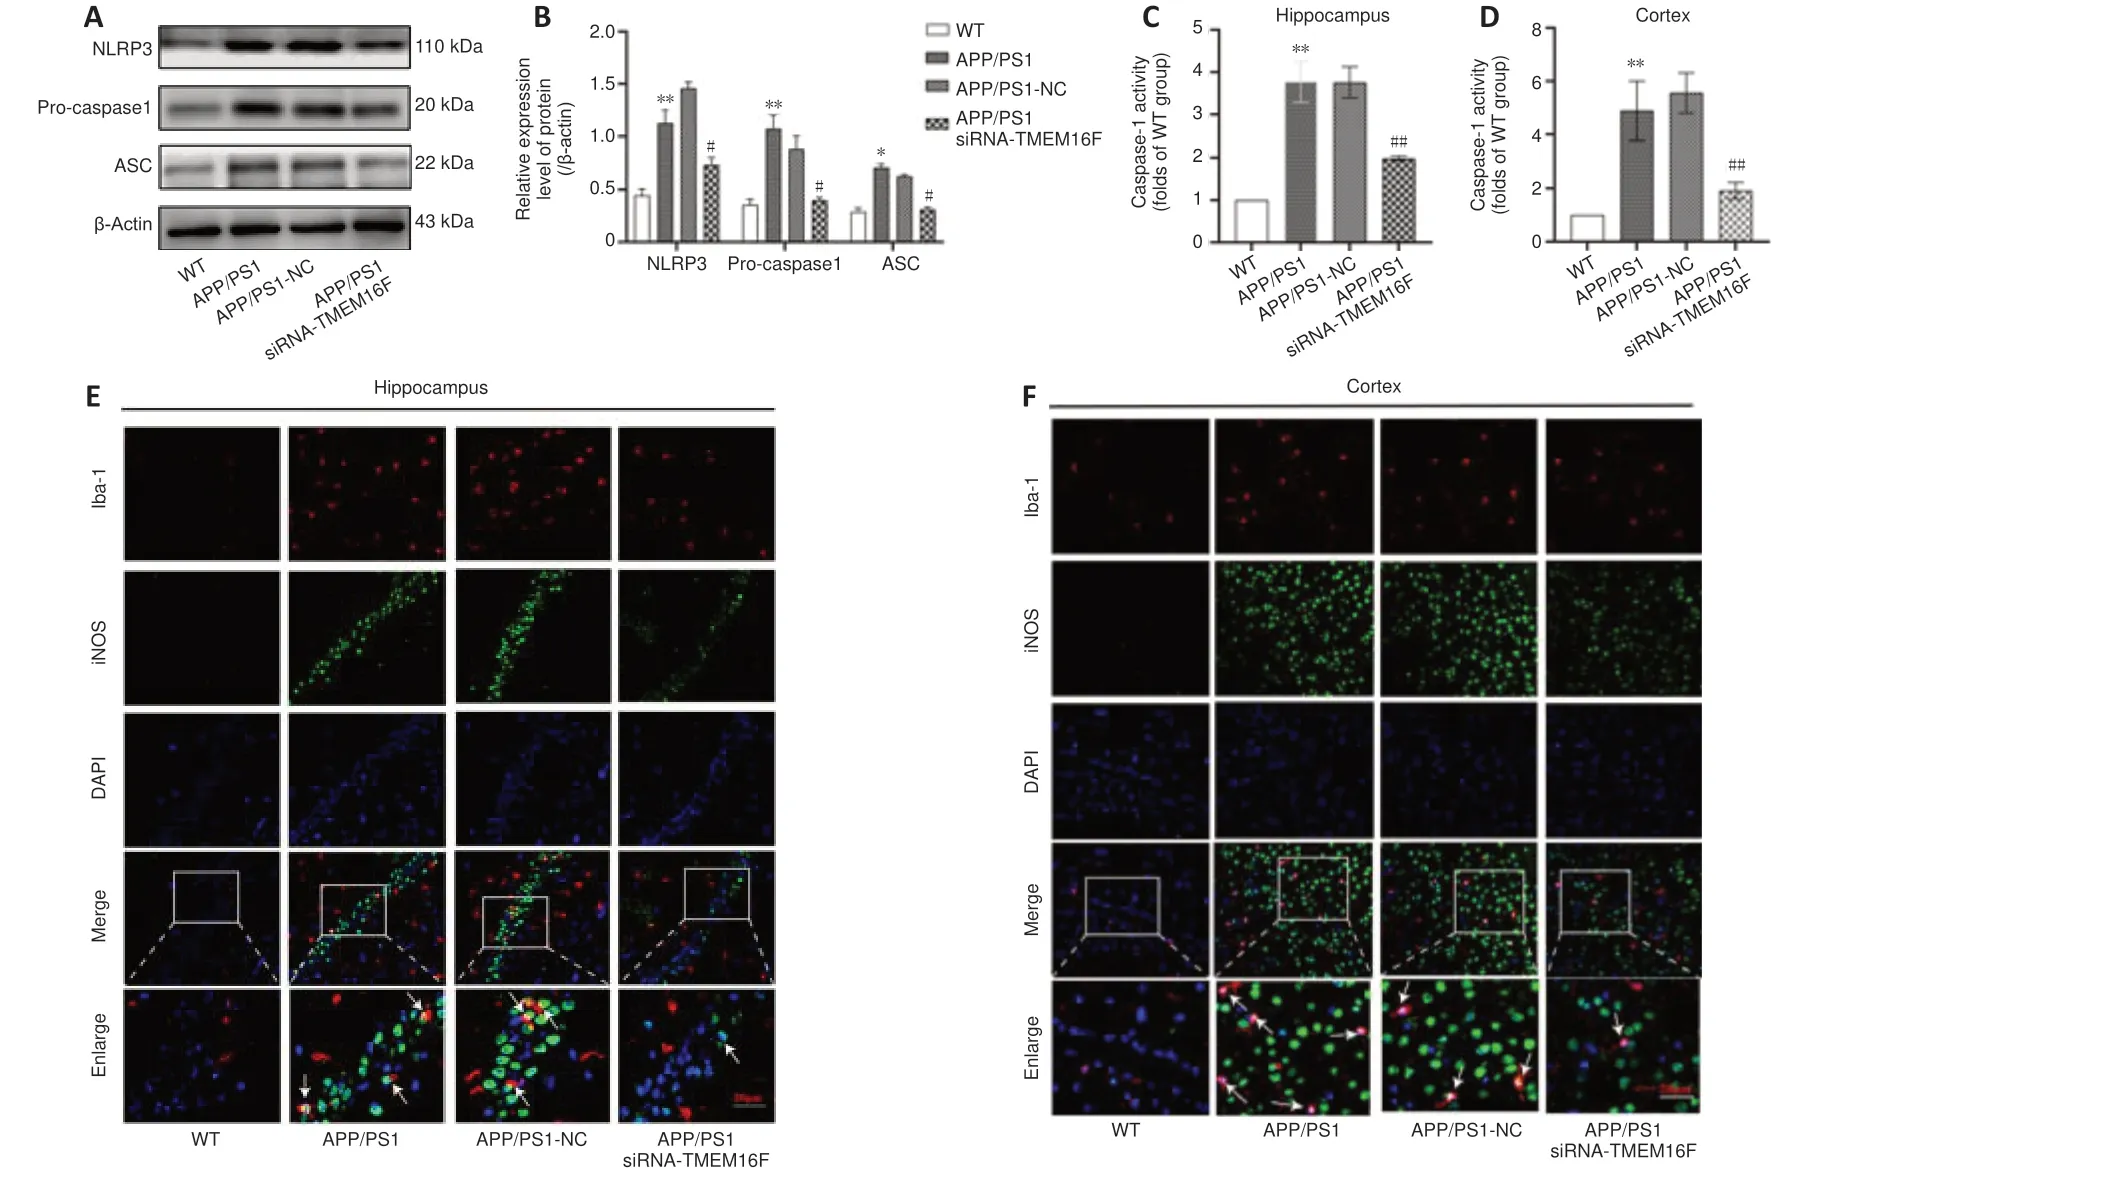
Figure 3 |TMEM16F knockdown inhibits the activation of the microglial NLRP3 inflammasome in APP/PS1 mice.The WT group was 9-month-old wild-type mice without treatment. The APP/PS1 group was 9-month-old APP/PS1 mice without treatment. The APP/PS1 group was 9-month-old APP/PS1 mice with stereotactic injection of siRNA-NC into brain hippocampus. The APP/PS1 group was 9-month-old APP/PS1 mice with stereotactic injection of siRNA-TMEM16F into brain hippocampus. (A) Representative immunoblots of NLRP3, pro-caspase1 and ASC in brain tissues of four animal groups. (B) Quantification of the expressions of NLRP3, pro-caspase1 and ASC. (C, D) Quantification of the level of caspase-1 activity in brain tissues from hippocampus (C) and cortex (D) of four animal groups. (E, F) Representative immunofluorescence photomicrographs of microglial NLRP3 in the hippocampus (E) and cortex (F) of four animal groups. The proportion of Iba1+ and NLRP3+ cells in the hippocampus and cortex was decreased compared with cells in the mice of the APP/PS1-NC group. Brain sections were stained for NLRP3 (green, FITC) and microglial marker Iba-1 (red, Cy3); nuclei were stained by DAPI (blue). The white arrows indicate instances of NLRP3 co-expressed with Iba-1. Scale bars: 20 µm. Data are shown as the mean ± SD. The experiments were carried out on three separate samples *P < 0.05, **P < 0.01, vs. WT group; #P < 0.05, ##P < 0.01, vs. APP/PS1-NC group (one-way analysis of variance followed by Tukey’s post hoc test). APP/PS1: Amyloid precursor protein/presenilin-1; ASC: apoptosis associated speck like protein containing a CARD; DAPI: 4,6-diamino-2-phenyl indole; Iba-1: ionized calcium binding adapter molecule 1; NLRP3: NOD-like receptor protein 3; WT: wild type.
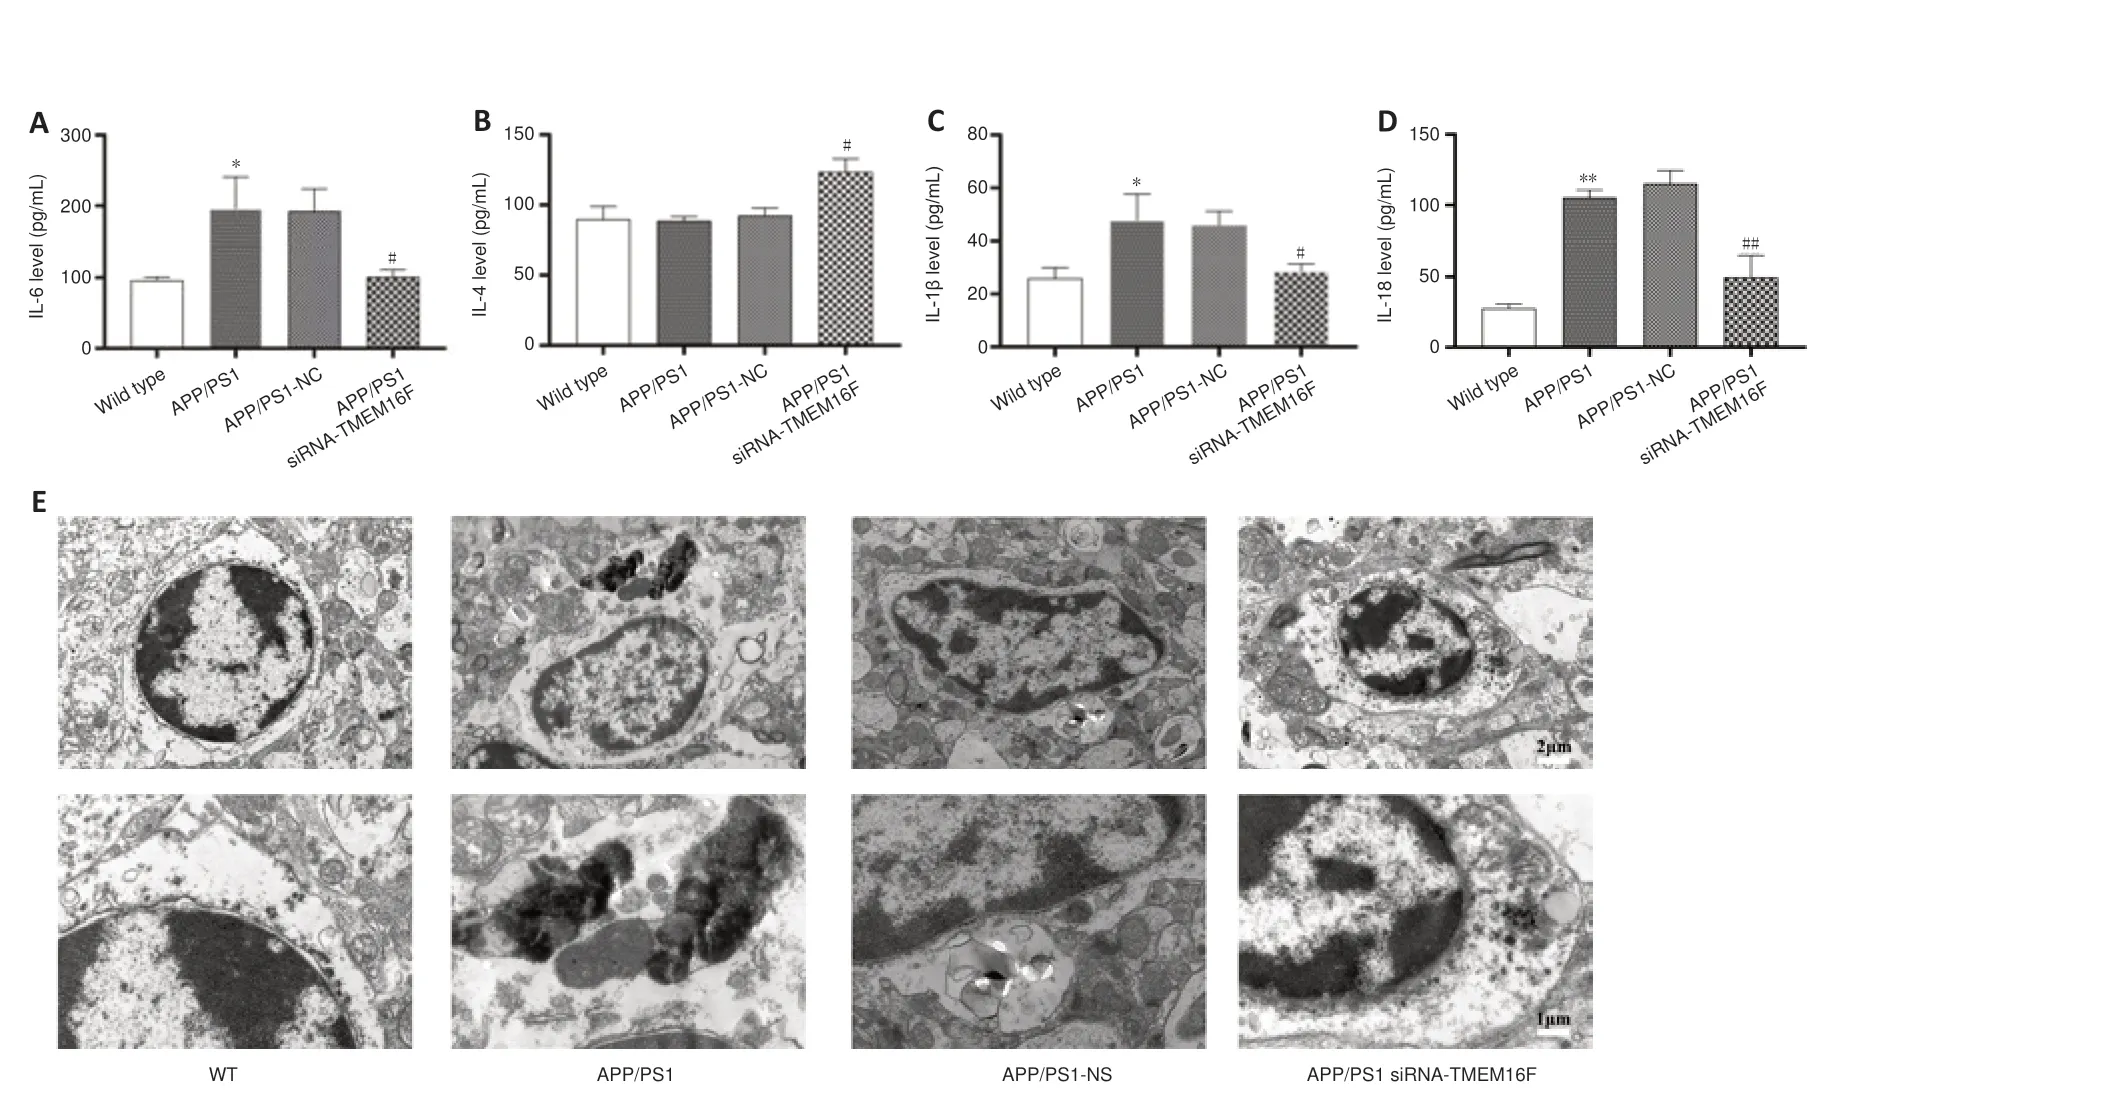
Figure 4 |TMEM16F knockdown decreases the secretion of pro-inflammatory cytokines and repairs morphological injury of microglia. The WT group was 9-month-old wild-type mice without treatment. The APP/PS1 group was 9-month-old APP/PS1 mice without treatment. The APP/PS1 group was 9-month-old APP/PS1 mice with stereotactic injection of siRNA-NC into brain hippocampus. The APP/PS1 group was 9-month-old APP/PS1 mice with stereotactic injection of siRNA-TMEM16F into brain hippocampus. (A‒D) Quantification of expression levels of IL-6 (A), IL-4 (B), IL-1β (C) and IL-18 (D) in brain tissues of four animal groups detected by ELISA. Data are shown as the mean ± SD. The experiments were carried out on three separate samples. *P < 0.05, **P < 0.01, vs. WT group; #P < 0.05, ##P < 0.01, vs. APP/PS1-NC group (one-way analysis of variance followed by Tukey’s post hoc test). (E) Representative transmission electron microscopy photomicrographs of microglia morphology in brain hippocampus tissues of four animal groups. Scale bars: 2 µm (top), 1 µm (bottom). APP/PS1: Amyloid precursor protein/presenilin-1; IL: interleukin; WT: wild type.
TMEM16F knockdown attenuates neuronal apoptosis and pathological injuries in APP/PS1 mice
Western blot assays were performed to evaluate the level of apoptosisrelated proteins in the brain tissue of APP/PS1 mice. Bax, bcl-2, and cleavedcaspase-3 expressions were greatly in tissues with downregulated expression of TMEM16F (P
< 0.01 orP
< 0.05;Figure 5A–D
). Immunohistochemistry revealed decreased expression of caspase-3 in cortex and hippocampus regions of brains in APP/PS1 siRNA-TMEM16F mice. The deposition of Aβ plaque can reflect the degree of pathological injuries. Immunohistochemistry results revealed that the deposition of Aβ plaque was greatly increased in the APP/PS1 and APP/PS1-NC groups, and these levels were decreased by siRNA-TMEM16F injection (P
< 0.01 orP
< 0.05;Figure 5E
andF
). Finally, hematoxylin and eosin staining was performed to determine pathological changes of neurons in brain tissue samples,. The results showed sparse and disorganized neurons with pyknotic blue nuclei in the 9-month-old APP/PS1 and APP/PS1-NC groups. In comparison, the morphology of neurons in the APP/PS1 siRNA-TMEM16F group was improved (Figure 5G
).TMEM16F knockdown regulates microglia polarization via mitigating the activation of NLRP3 inflammasome in Aβ
-treated HMC3 cells
Consistent with ourin vivo
experimental results, we found that TMEM16F knockdown exerted an inhibitory effect on the activation of NLRP3 inflammasome of Aβ-treated HMC3 cells, with a decreased expression of NLRP3, ASC, and pro-caspase1 (P
< 0.05;Figure 7A
andB
). ELISA findings revealed decreased secretion of IL-1β and IL-18 after siRNA-TMEM16F transfection in Aβ-treated HMC3 cells. Moreover, Nigericin, the agonist of NLRP3, was used. We found that Nigericin abolished the downregulation of IL-1β and IL-18 triggered by siRNA-TMEM16F (P
< 0.05;Figure 7C
andD
). Furthermore, in cells treated with Nigericin for 24-hour, the expression level of iNOS and Cox2 was upregulated and Arg1 was downregulated (P
< 0.01 orP
< 0.05;Figure 7E
andF
).TMEM16F knockdown facilitates microglial conversion into M2 phenotype with reduction of pro-inflammatory cytokines in Aβ
-treated HMC3 cells
We designed three siRNA-TMEM16F sequences and confirmed siRNA3 that exhibited the most potent knockdown effects (Figure 6A
andB
). We therefore used siRNA3 to construct TMEM16F knockdown HMC3 cells. Western blot revealed that the expression of TMEM16F was increased in response to Aβ.To explore the effect of downregulating TMEM16F on the microglia phenotype, western blot was used to measure M1 microglia biomarkers (iNOS, Cox2) and M2 microglia biomarkers (Arg1, Socs3) (Figure 6C
). The levels of iNOS and Cox2 were enhanced in Aβ-treated HMC3 cells, which was partially reversed by siRNA-TMEM16F transfection. Conversely, TMEM16F knockdown resulted in increased expression level of Arg1 and Socs3 (P
< 0.01 orP
< 0.05;Figure 6D
). Real-time PCR was used to measure concentrations of secreted inflammatory cytokines. Transfection of siRNA-TMEM16F resulted in increased secretion of anti-inflammatory cytokines (IL-4, IL-10, and transforming growth factor-β) in Aβ-treated HMC3 cells. The expression of pro-inflammatory cytokines (IL-1, IL-6, and TNF-α) was reduced in the siRNA-TMEM16F group compared with levels in the siRNA-NC group (Figure
6E
andF
).Conditioned medium from the siRNA-TMEM16F group exerts a protective effect on SH-SY5Y cells via inhibiting cell apoptosis
To further elucidate the impact of TMEM16F on neuronal viability, we collected the conditioned medium (CM) from four groups of HMC3 cells and then added them to SH-SY5Y cells for a 24-hour culturing period. Compared with CM from the control group, CM from the Aβ-treated group increased the apoptosis of SH-SY5Y cells and enhanced the activity of caspase-3. Compared with CM from the siRNA-NC group, CM from the siRNA-TMEM16F group alleviated the apoptosis of SH-SY5Y cells (P
< 0.01;Figure 8A
andB
) and effectively inhibited the activity of caspase-3 (P
< 0.01;Figure 8C
).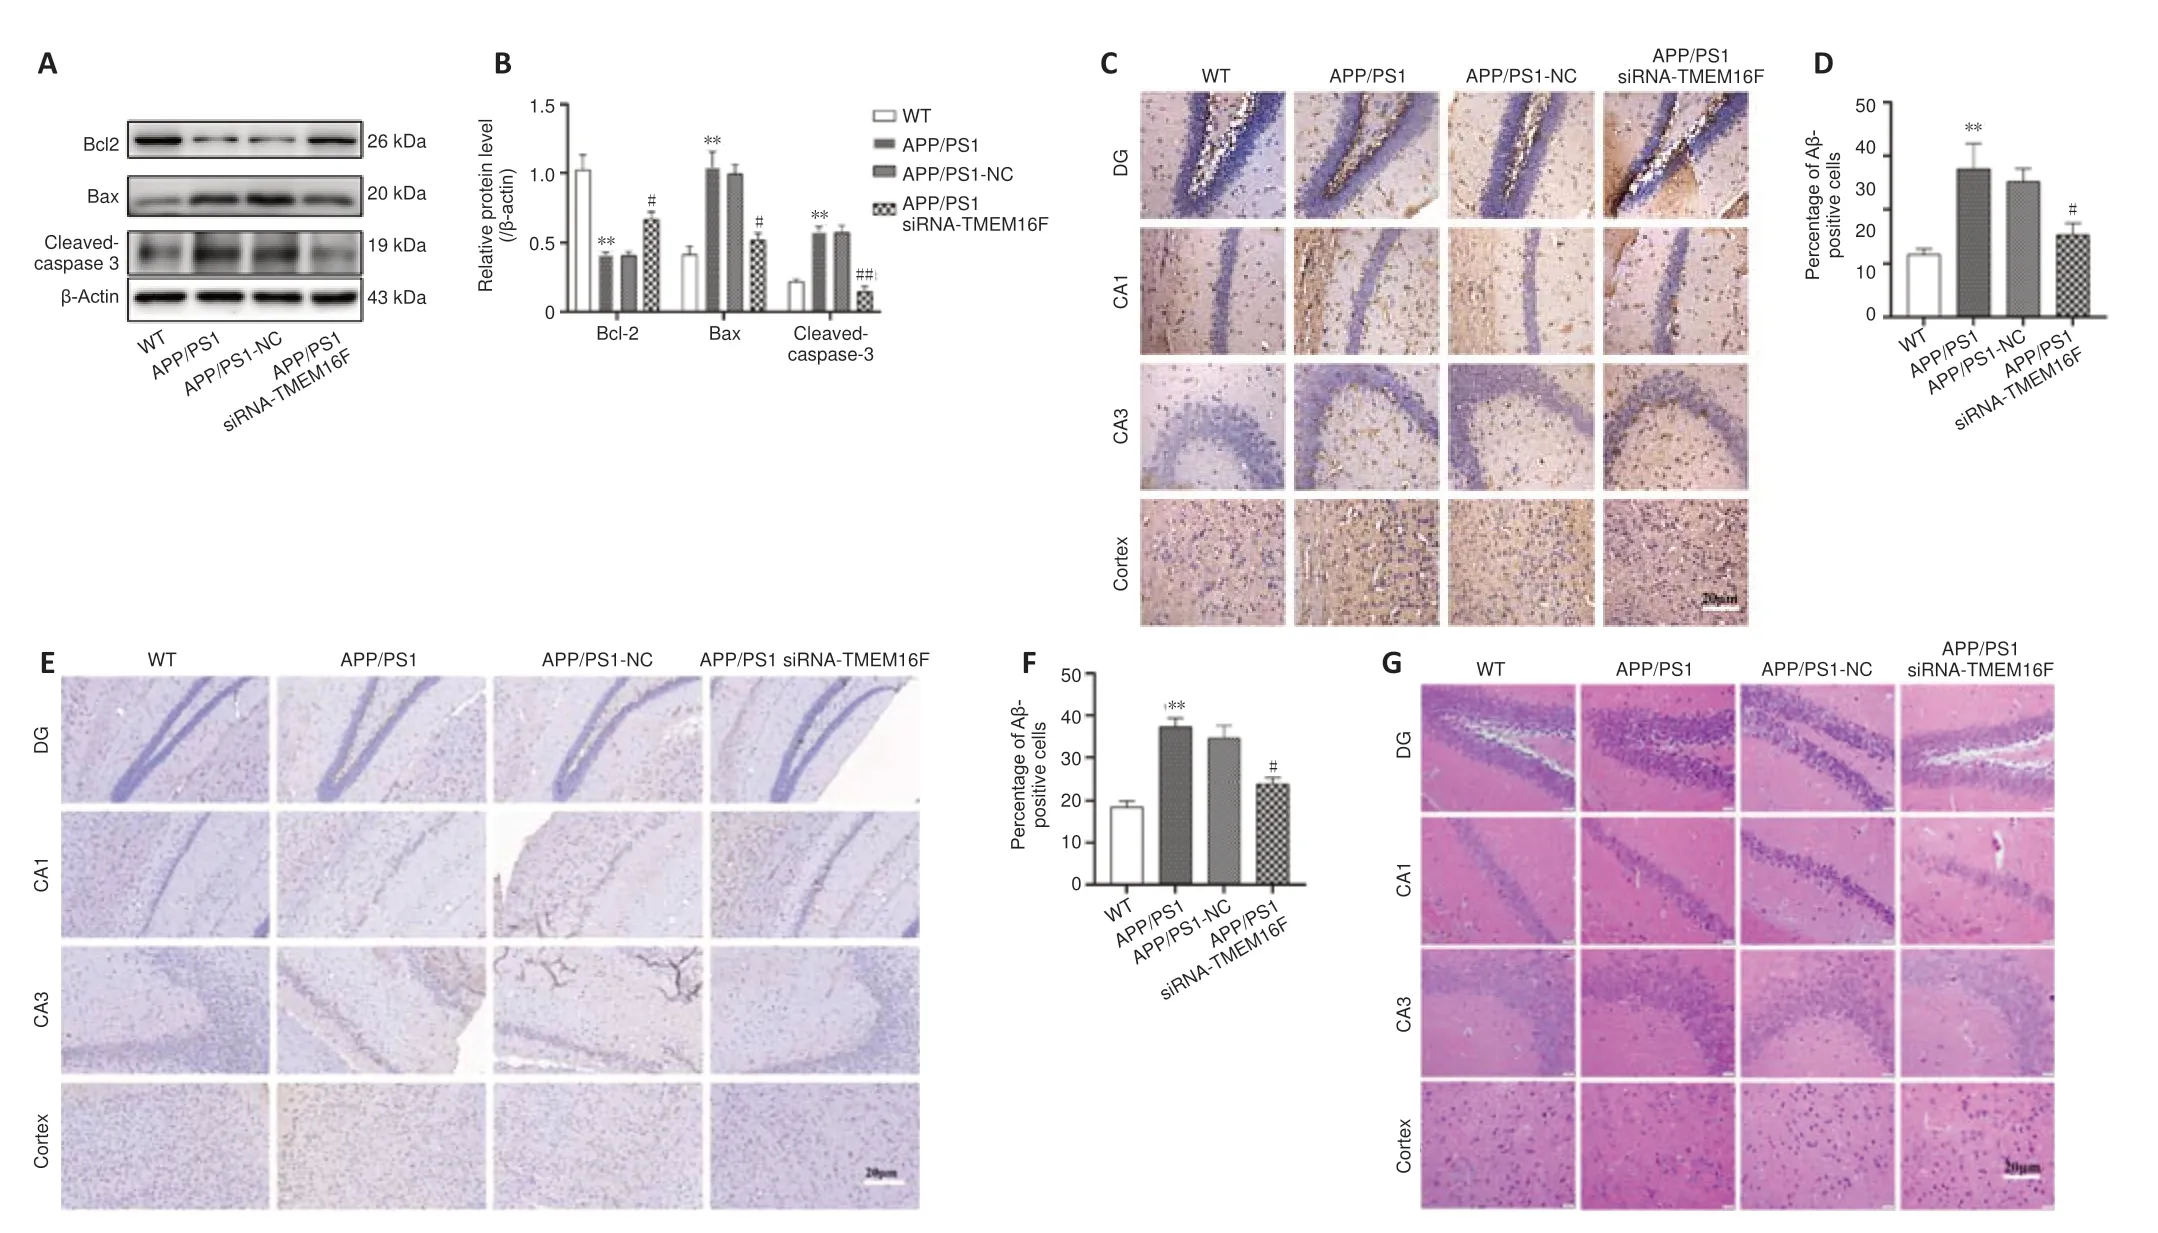
Figure 5 |TMEM16F knockdown attenuates neuronal apoptosis and pathological injuries in APP/PS1 mice.The WT group was 9-month-old wild type mice without treatment. The APP/PS1 group was 9-month-old APP/PS1 mice without treatment. The APP/PS1 group was 9-month-old APP/PS1 mice with stereotactic injection of siRNA-NC into brain hippocampus. The APP/PS1 group was 9-month-old APP/PS1 mice with stereotactic injection of siRNA-TMEM16F into brain hippocampus. (A, B) Representative western blots and quantification of expressions of bcl-2, bax and cleaved-caspase-3 in brain tissues of four aninmal groups. (C, D) Representative photomicrographs and quantification of caspase-3 immunohistochemistry staining in brain tissues of four aninmal groups. (E, F) Representative photomicrographs and quantification of Aβ immunohistochemistry staining in brain tissues of four aninmal groups. The expressions of caspase-3 and Aβ in APP/PS1 siRNA-TMEM16F mice were decreased compared with expression in mice from the APP/PS1-NC group. (G) Representative photomicrographs of hematoxylin and eosin (HE) staining in brain tissues of four aninmal groups. In 9-monthold APP/PS1 mice and the APP/PS1-NC group, sparse and disorganized neurons with pyknotic blue nuclei were shown. In contrast, the morphology of neurons in the APP/PS1 siRNATMEM16F group was improved. Scale bars: 20 µm. Data are shown as the mean ± SD. The experiments were carried using three (A) or six (C, E) separate samples. *P < 0.05, **P < 0.01, vs. WT group; #P < 0.05, ##P < 0.01, vs. APP/PS1-NC group (one-way analysis of variance followed by Tukey’s post hoc test). APP/PS1: Amyloid precursor protein/presenilin-1; WT: wild type.
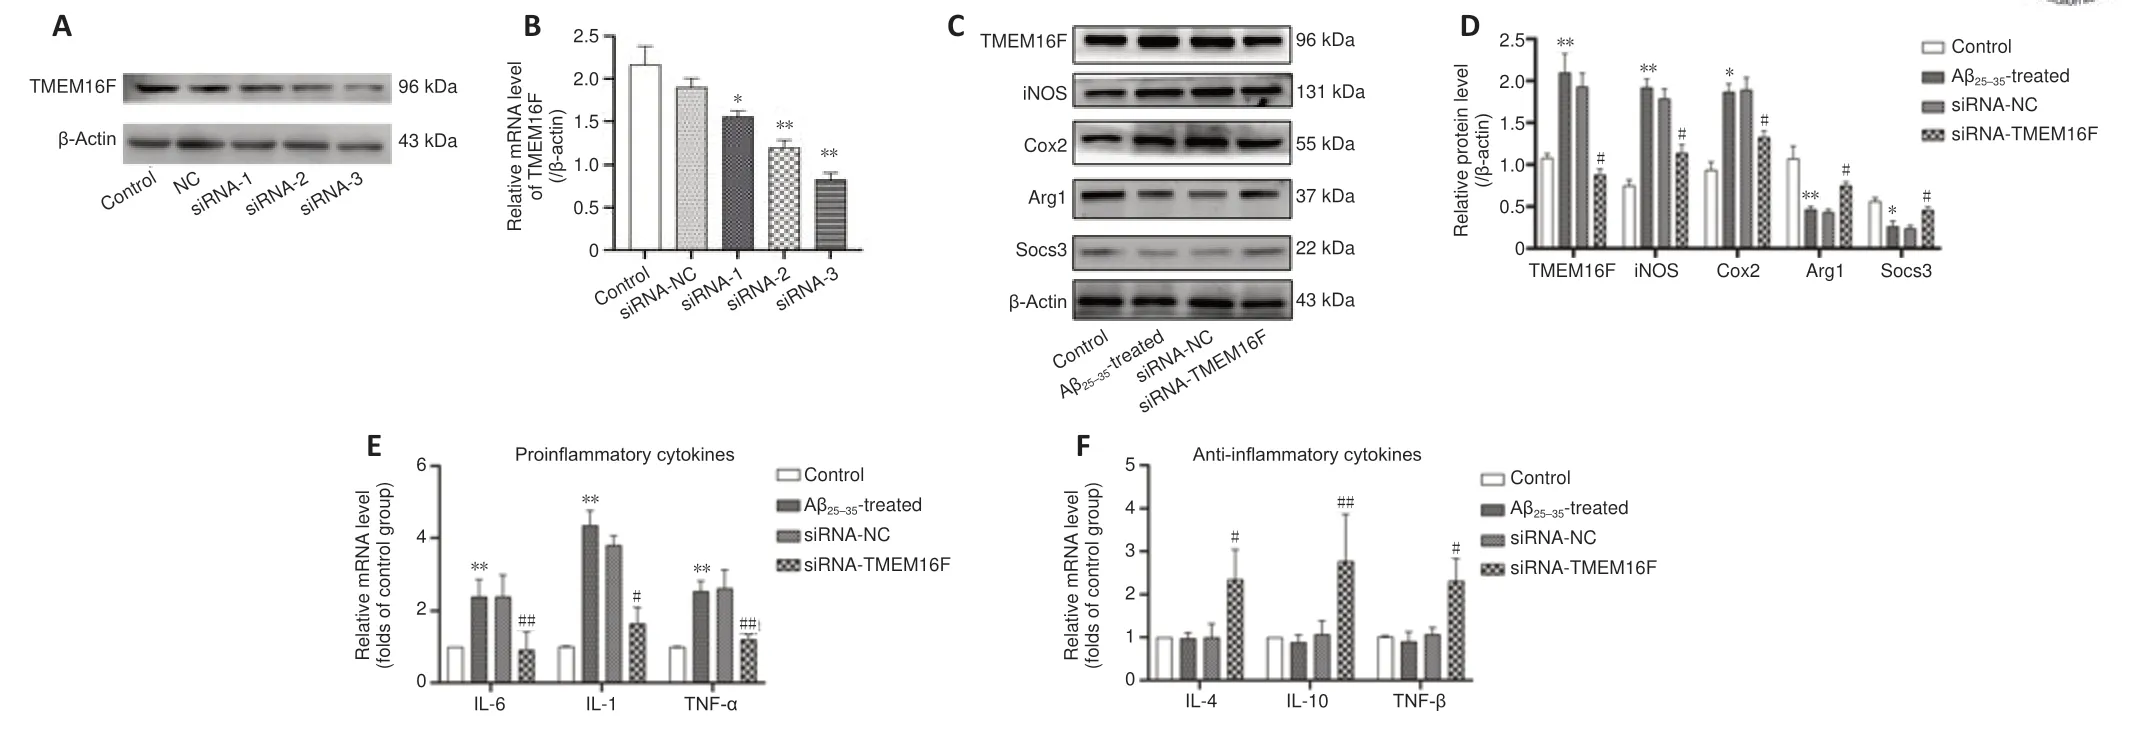
Figure 6 |TMEM16F knockdown facilitates microglial conversion into M2 phenotype, with reduction of pro-inflammatory cytokines in Aβ25–35-treated HMC3 cells. (A, B) Representative western blots and protein band quantification in cells transfected with three siRNA-TMEM16Fs. The Control group was HMC3 cells cultured without treatment. The Aβ25‒35-treated group was HMC3 cells treated with 20µM Aβ25‒35 for 24 hours. The siRNA-NC group was HMC3 cells transfected with siRNA negative control for 48 hours and then treated with 20 µM Aβ25‒35 for 24 hours. The siRNA-TMEM16F group was HMC3 cells transfected with TMEM16F siRNA for 48 hours and then treated with 20 µM Aβ25‒35 for 24 hours. (C, D) Representative immunoblots of TMEM16F, M1 microglia markers (iNOS, Cox2) and M2 microglia markers (Arg1, Socs3) and quantification in HMC3 cells of four cell groups. (E, F) Real-time polymerase chain reaction was used to quantify the mRNA expression levels of proinflammatory cytokines (IL-1, IL-6, TNF-α) (E) and anti-inflammatory cytokines (IL-4, IL-10, TGF-β) (F) in HMC3 cells of four cell groups. Data are shown as the mean ± SD. The experiments were carried out on three separate samples. *P < 0.05, **P < 0.01, vs. control group; #P < 0.05, ##P < 0.01, vs. siRNA-NC group (one-way analysis of variance followed by Tukey’s post hoc test). Arg1: Arginase 1; Cox 2: cyclo-oxygenase 2; HMC3: human microglia clones 3; IL: interleukin; iNOS: inducible nitric oxide synthase; Socs3: suppressor of cytokine signaling 3; TGF-β: transforming growth factor-β; TNF-α: tumor necrosis factor-α.
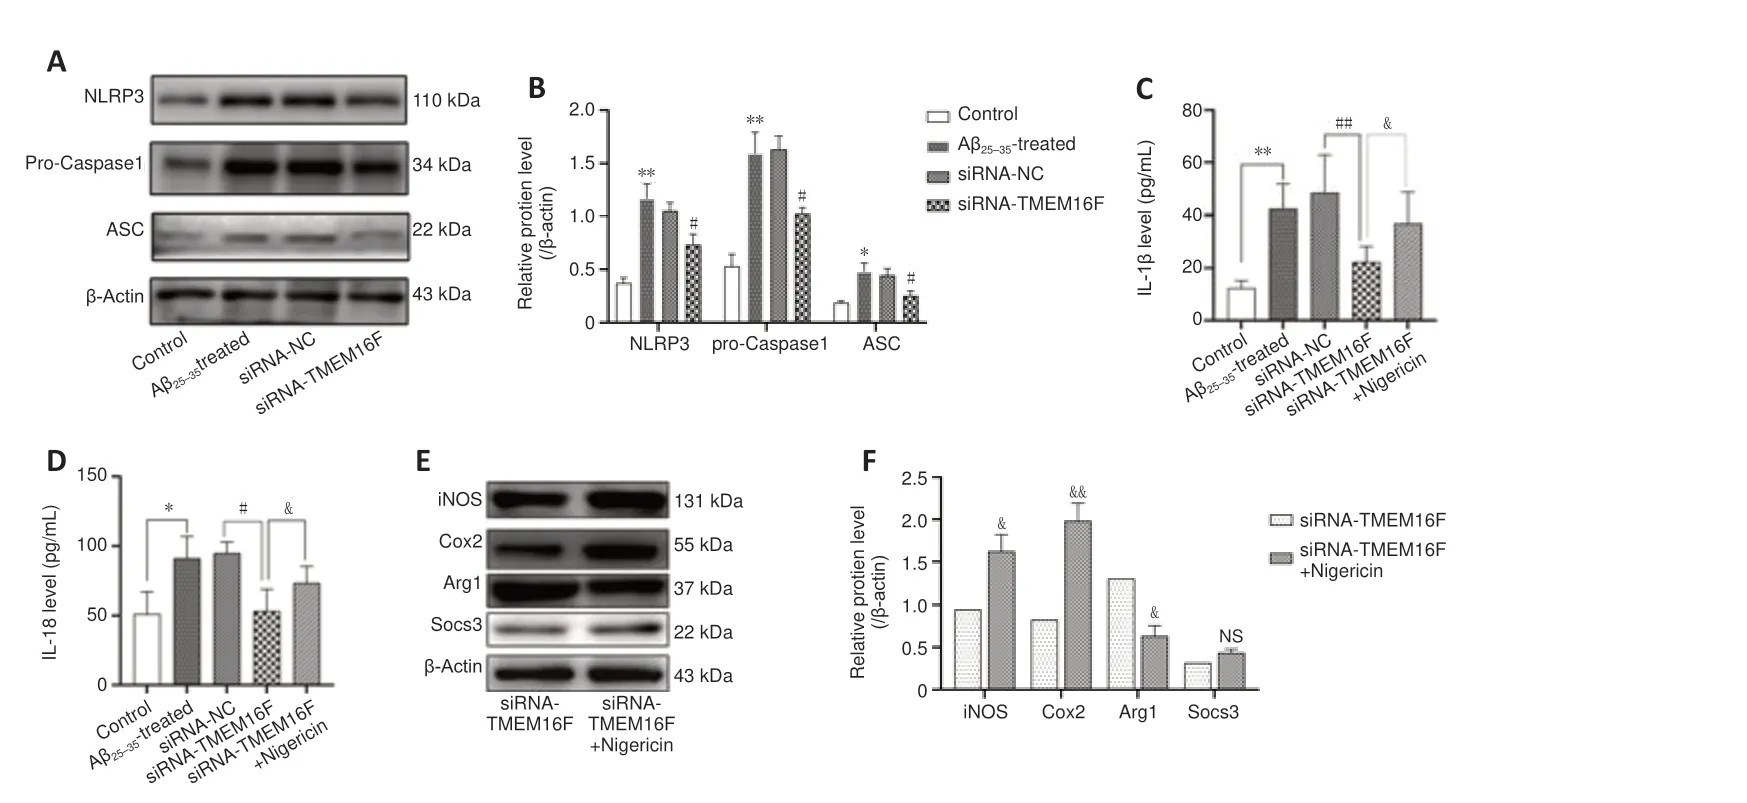
Figure 7 |TMEM16F knockdown regulates microglia polarization via mitigating the activation of NLRP3 inflammasome in Aβ25–35-treated HMC3 cells. The Control group was HMC3 cells cultured without treatment. The Aβ25‒35-treated group was HMC3 cells treated with 20 µM Aβ25‒35 for 24 hours. The siRNA-NC group was HMC3 cells transfected with siRNA negative control for 48 hours and then treated with 20 µM Aβ25‒35 for 24 hours. The siRNA-TMEM16F group was HMC3 cells transfected with TMEM16F siRNA for 48 hours and then treated with 20 µM Aβ25‒35 for 24 hours. (A, B) Representative immunoblot and quantification of NLRP3, pro-caspase1 and ASC levels in HMC3 cells of four cell groups. (C‒F) To evaluate the effects of NLRP3 inflammasome on microglia polarization, an NLRP3 agonist (Nigericin) was added to the siRNA-TMEM16F group. Expression levels of IL-1β (C) and IL-18 (D) were detected by ELISA kits. Representative western blots (E) and quantifications (F) of M1 microglia markers (iNOS, Cox2) and M2 microglia markers (Arg1, Socs3) in HMC3 cells from siRNA-TMEM16F group and siRNA-TMEM16F + Nigericin group. Data are shown as the mean ± SD. The experiments were carried out on three separate samples. *P < 0.05, **P < 0.01, vs. control group; #P < 0.05, ##P < 0.01, vs. siRNA-NC group; &P < 0.05, &&P < 0.01, vs. siRNA-TMEM16F group (one-way analysis of variance followed by Tukey’s post hoc test). Arg1: Arginase 1; ASC: apoptosis associated speck like protein containing a CARD; Cox 2: cyclo-oxygenase 2; HMC3: human microglia clones 3; IL: interleukin; iNOS: inducible nitric oxide synthase; NLRP3: NOD-like receptor protein 3; Socs 3: suppressor of cytokine signaling 3.

Figure 8 |The conditioned medium from the siRNA-TMEM16F group exerts a protective effect on SH-SY5Y cells via inhibiting cell apoptosis. (A‒C) Conditioned media (CM) were collected from four groups of HMC3 cells and then were added to SH-SY5Y cells. Four groups were divided: Control-CM group was SH-SY5Y cells treated with supernatant of HMC3 cells from Control group; Aβ25‒35- treated-CM was SH-SY5Y cells treated with supernatant of HMC3 cells from Aβ25‒35-treated group; siRNA-NCCM was SH-SY5Y cells treated with supernatant of HMC3 cells from siRNA-NC group and siRNA-TMEM16F-CM group was SH-SY5Y cells treated with supernatant of HMC3 cells from siRNA-TMEM16F group. The cell apoptosis rates of SH-SY5Y cells were evaluated by flow cytometry (A and B) and the activity of caspase-3 was assessed (C) in SH-SY5Y cells of four cell groups. Data are shown as the mean ± SD. The experiments were carried out on three separate samples. **P < 0.01, vs. control group; #P < 0.05, ##P < 0.01, vs. siRNA-NC group (oneway analysis of variance followed by Tukey’s post hoc test). CM: Conditioned medium; HMC3: human microglia clones 3.
Discussion
In this study, we examined the potential role of TMEM16F on the neuroinflammatory reaction in AD. We found that microglial TMEM16F was elevated in the AD mouse model and affected inflammatory factors with the change of microglial phenotype. Furthermore, we found that TMEM16-knockdown by stereotactic injection of siRNA into bilateral hippocampus improved the behavioral and cognitive functions of APP/PS1 transgenic mice. The neuroprotective effect caused by siRNA-TMEM16F was through mitigating the inflammatory response via microglia polarization toward the M2 phenotype. In addition, our results indicate that the NLRP3 inflammasome might be a key regulatory factor during the process of TMEM16F-mediated microglial polarization in AD.
TMEM16F is abundantly distributed in microglia/macrophages and has close connections with inflammatory responses in the central nervous system (Zhao and Gao, 2019). TMEM16F, as a calcium-activated nonselective ion channel, influences motorneuron excitability in neurodegenerative diseases. The loss of TMEM16F function causes the ALS animal model to experience a delay of disease onset and muscle performance decline (Soulard et al., 2020). TMEM16F also functions as a calcium-activated scramblase. Overexpressed TMEM16F caused phosphatidylserine exposure of neurons in ischemic infarction areas and the phagocytosis of microglia was activated, leading to rescuable neuron loss (Zhang et al., 2020). However, the specific role of TMEM16F in AD had not been investigated. Our results showed that the spatial learning ability of 9-month-old APP/PS1 mice was improved by siRNATMEM16F injection into the bilateral hippocampus, which may be attributed to inhibition of the effects of TMEM16F on neuroinflammation in AD. Combined with the negative detection of the calcium-activated nonselective ion channel current in Aβ-treated HMC3 cells from the patch-clamp test (data not shown), we speculate that calcium-activated scramblase activity plays a key role in the neuroinflammatory reactions mediated by TMEM16F.
In the early stage of AD, resident microglia are recruited to the brain injury lesions and act as scavengers to engulf Aβ plaques. With disease progression, the line of defense constructed by activated microglia is damaged from the limited ability of phagocytosis and a deteriorating microenvironment. As a result, microglia are transformed into the M1 phenotype as pro-inflammatory factors are released, and brain injury is subsequently aggravated. Therefore, the methods of modulating microglial polarization into the anti-inflammatory M2 phenotype are good measures for AD treatment (Yao and Zu, 2020). Here we studied the relationship between TMEM16F and microglia polarization in AD model mice and cells. We found an increase in TMEM16F levels in Aβ-treated HMC3 cells and APP/PS1 transgenic mice, accompanied by microglia polarization into the M1 phenotype and secretion of inflammatory factors such as IL-1, IL-6, and TNF-α. To evaluate the inhibitory effect of TMEM16F knockdown on neuroinflammation, we injected siRNA-TMEM16F into the bilateral hippocampus of 9-month-old APP/PS1 mice. We found that TMEM16F knockdown promoted microglia polarization to the M2 phenotype with higher secretory levels of the anti-inflammatory cytokine IL-4 and a decrease in the expression of the pro-inflammatory cytokine IL-6. We also established an AD microglia model by transfecting siRNA-NC and siRNATMEM16F HMC3 cells and treating cells with Aβ. We found that the siRNA-TMEM16F group showed higher protein levels of the M2 biomarker Arg1 and Socs3 and secreted more anti-inflammatory cytokines.
Previous research revealed that over-activation of NLRP3 inflammasomes is closely linked with microglia-mediated neuroinflammation. In AD, long-term accumulation of Aβ and tau protein serve as pathogen-associated molecular patterns to chronically stimulate microglia, leading to overactivation of NLRP3 inflammasomes with a disrupted balance between Kefflux and Cainflux and the production of ROS from impaired mitochondria (Hanslik and Ulland, 2020). With the cleavage of pro-IL-1β by over-activation of the NLRP3 inflammasome, more mature IL-1β is secreted to the surrounding environment, leading to the aggravation of microglia-mediated neuroinflammation (Kelley et al., 2019). Accumulating evidence shows that the activity of the NLRP3 inflammasome is involved in microglia polarization. Xia et al. (2021) reported that SRT1720, a specific activator of SIRT1, downregulated the expression level of M1 markers and upregulated the expression level of M2 markers bothin vivo
andin vitro
after subarachnoid hemorrhage by stopping the ROS-mediated NLRP3 inflammasome. Moreover, tianeptine exerted M1 microglia suppression via NLRP3 inflammasome signaling in the LPS-stimulated microglia model (Ślusarczyk et al., 2018). Concerning the association between NLRP3 inflammasome and microglia polarization during the progression of AD, a recent study revealed that NLRP3 inflammasome might be the downstream effector of TLR4 and that the TLR4 inhibitor TAK-242 may induce microglia polarization to the M2 phenotype by suppressing the NLRP3 inflammasome in 6-month-old APP/PS1 mice (Cui et al., 2020).Our results indicated that knockdown of TMEM16F exerted an inhibitory effect on the over-activating the NLRP3 inflammasome and mitigated the production of pro-inflammatory cytokines IL-1β and IL-18. However, with the intervention of Nigericin, an agonist of NLRP3, the inhibitory effect of the siRNA-TMEM16F group on the NLRP3 inflammasome was partially reversed. Therefore, we conclude that TMEM16F might act as the upstream factor to regulate the expression level of NLRP3 inflammasome in AD microglia.
There are two sets of evidence linking TMEM16F and the NLRP3 inflammasome in AD microglia. First, various studies have shown that NLRP3 participates in gasdermin D-dependent pyroptosis from the cleavage of the gasdermin D precursor by caspase-1 (Huang et al., 2021). A patch-clamp study revealed that TMEM16F inhibition by tannic acid or TMEM16F knockdown by cell transfection repressed the whole-cell currents during gasdermin D-induced pyroptosis, which indirectly reflected the possible relationship between TMEM16F and the NLRP3 inflammasome (Ousingsawat et al., 2018). Second, increasing studies have shown Aβ triggers the upregulation of microglial P2X7R, accompanied by numerous Kions transferred to the outside of microglia (Choi and Ryter, 2014; Chen et al., 2021). Overactivated NLRP3 inflammasome was formed by persistent Kefflux, leading to the deterioration of the inflammatory microenvironment (Campagno and Mitchell, 2021). Similarly, in macrophages, TMEM16F serves as the downstream effector of P2X7 to regulate cell phagocytosis and cell migration (Ousingsawat et al., 2015). On the basis of these results, we speculated that a P2X7R/TMEM16F/NLRP3 signaling pathway may be closely connected with inflammatory reactions in microglia/macrophages.
This study has several limitations. First, APP/PS1 transgenic mice have been used as an AD animal model for many years, but newer AD animal models such as 3xTg-AD and 5×FAD mice may better reflect AD pathological changes (Webster et al., 2014). Second, HMC3 cells were the only human cell line used in the study for analyses. Finally, although we determined that the NLRP3 inflammasome was involved in TMEM16F-mediated microglial polarization, the exact mechanism of how TMEM16F influences the microglia phenotype is unclear.
In conclusion, our study demonstrated that TMEM16F is highly expressed in AD microglia, and TMEM16F knockdown can mitigate the neuroinflammatory responses by converting microglia into the M2 phenotype via inhibiting the over-activated NLRP3 inflammasome, leading to a neuroprotective effect. Our study reveals the underlying mechanism of TMEM16F-mediated neuroinflammation and suggests that TMEM16F inhibition may be a novel therapeutic approach in AD patients.
Author contributions:
All authors participated in experimental design, implementation and evaluation and approved the final version of the manuscript.
Conflicts of interest:
The authors declare that they have no conflict of interest.
Availability of data and materials:
All data generated or analyzed during this study are included in this published article and its supplementary information files.
Open access statement:
This is an open access journal, and articles are distributed under the terms of the Creative Commons AttributionNonCommercial-ShareAlike 4.0 License, which allows others to remix, tweak, and build upon the work non-commercially, as long as appropriate credit is given and the new creations are licensed under the identical terms.
Open peer reviewer:
Henric Ek Olofsson, Lund University, Sweden.
Additional files:
Schematic diagram of the animal experiment.
Schematic diagram of the cell experiment.
Open peer review report 1.
- 中国神经再生研究(英文版)的其它文章
- Inflammation and retinal degenerative diseases
- Synaptic alterations as a common phase in neurological and neurodevelopmental diseases: JNK is a key mediator in synaptic changes
- Brain-derived neurotrophic factor in main neurodegenerative diseases
- The best of both worlds: mastering nerve regeneration combining biological and nanotechnological tools
- Exosomal miR-23b from bone marrow mesenchymal stem cells alleviates oxidative stress and pyroptosis after intracerebral hemorrhage
- Chlorogenic acid alleviates hypoxic-ischemic brain injury in neonatal mice

