Sequential expression of miR-221-3p and miR-338-3p in Schwann cells as a therapeutic strategy to promote nerve regeneration and functional recovery
Li-Li Wen, Tian-Hao Yu, Yi-Zhan Ma, Xiao-Yan Mao, Tian-Rang Ao, Rabia Javed, Hirotomo Ten, Akira Matsuno, Qiang Ao,
Abstract The functional properties of endogenous Schwann cells (SCs) during nerve repair are dynamic. Optimizing the functional properties of SCs at different stages of nerve repair may have therapeutic benefit in improving the repair of damaged nerves. Previous studies showed that miR-221-3p promotes the proliferation and migration of SCs, and miR-338-3p promotes the myelination of SCs. In this study, we established rat models of sciatic nerve injury by bridging the transected sciatic nerve with a silicone tube. We injected a miR-221 lentiviral vector system together with a doxycycline-inducible Tet-On miR-338 lentiviral vector system into the cavity of nerve conduits of nerve stumps to sequentially regulate the biological function of endogenous SCs at different stages of nerve regeneration. We found that the biological function of SCs was sequentially regulated, the diameter and density of myelinated axons were increased, the expression levels of NF200 and myelin basic protein were increased, and the function of injured peripheral nerve was improved using this system. miRNA Target Prediction Database prediction, Nanopore whole transcriptome sequencing, quantitative PCR, and dual luciferase reporter gene assay results predicted and verified Cdkn1b and Nrp1 as target genes of miR-221-3p and miR-338-3p, respectively, and their regulatory effects on SCs were confirmed in vitro. In conclusion, here we established a new method to enhance nerve regeneration through sequential regulation of biological functions of endogenous SCs, which establishes a new concept and model for the treatment of peripheral nerve injury. The findings from this study will provide direct guiding significance for clinical treatment of sciatic nerve injury.
Key Words: cdkn1b; miR-221; miR-338; miRNA; nerve regeneration; Nrp1; peripheral nerve injury; regulation; Schwann cells; sequential expression
Introduction 671 Methods 672 Results 675 Discussion 679
Introduction
Peripheral nerve injury is a common clinical disease, and incomplete repair of injured nerves leads to functional loss. Repair and reconstruction of peripheral nerve defects is a clinical problem because of the poor regeneration ability of the nervous system (Barberá et al., 1988; Ashley et al., 2007; Wang et al., 2020, 2021; Rabia and Qiang, 2022). Autologous nerve grafts are currently the “gold standard” for bridging critical defects in peripheral nerves. This treatment still has challenges, including the limited availability of donor nerves and donor site morbidity. Artificial nerve conduits have been explored as alternatives to autografts (Li et al., 2020b; Yu et al., 2020). However, these conduits lack biological activity, and therefore the therapeutic effects remain unsatisfactory. Some researchers have added biological factors, SCs and stem cells into conduits to enhance nerve regeneration (Jung et al., 2016; Marquardt et al., 2020). These factors degrade in the body within a short time, and immune rejection occurs when exogenous cells are implanted. New strategies are therefore needed for peripheral nerve defects.
The therapeutic effects of autologous nerve grafts are mainly attributed to the functions of endogenous Schwann cells (SCs) (Aguayo et al., 1976), which have temporal and spatial characteristics (Gomez-Sanchez et al., 2017; Li et al., 2020a). In the early stage of nerve damage, Wallerian degeneration occurs in the distal nerve stump, macrophages proliferate to phagocytize denatured nerve debris, and SCs proliferate to form a Büngner band, providing pathways for axon regrowth (Salzer and Bunge, 1980; Lopez-Verrilli et al., 2013; Wang et al., 2015, 2016). SCs secrete growth factors and extracellular matrix, providing a conducive microenvironment for axon regeneration, the basis of nerve regeneration and repair. During the late period of nerve repair, SCs wrap the regenerated axons to form myelin sheaths, which improves the conduction velocity of the action potential and is considered key to the recovery of neuromuscular function after nerve injury (Fünfschilling et al., 2012; Jerath and Shy, 2015; Baraban et al., 2016; Nocera and Jacob, 2020). Therefore, a strategy that exploits the various functions of SCs in different stages may maximize the potential of neural self-repair.MicroRNAs (miRNAs) play an important role in various biological processes, including nerve cell function (Piao et al., 2010; Verrier et al., 2010; Yun et al., 2010; Lee and Vasudevan, 2013; Nassa et al., 2014; Monk et al., 2015; Flamand et al., 2016; Wang et al., 2018). For example, miR-221-3p positively regulates the proliferation and migration of SCs (Yu et al., 2012; Wu et al., 2014; Song et al., 2017), and miR-338-3p plays a role in myelination of the central and peripheral nervous system (Wang et al., 2016, 2017; Howe et al., 2017).
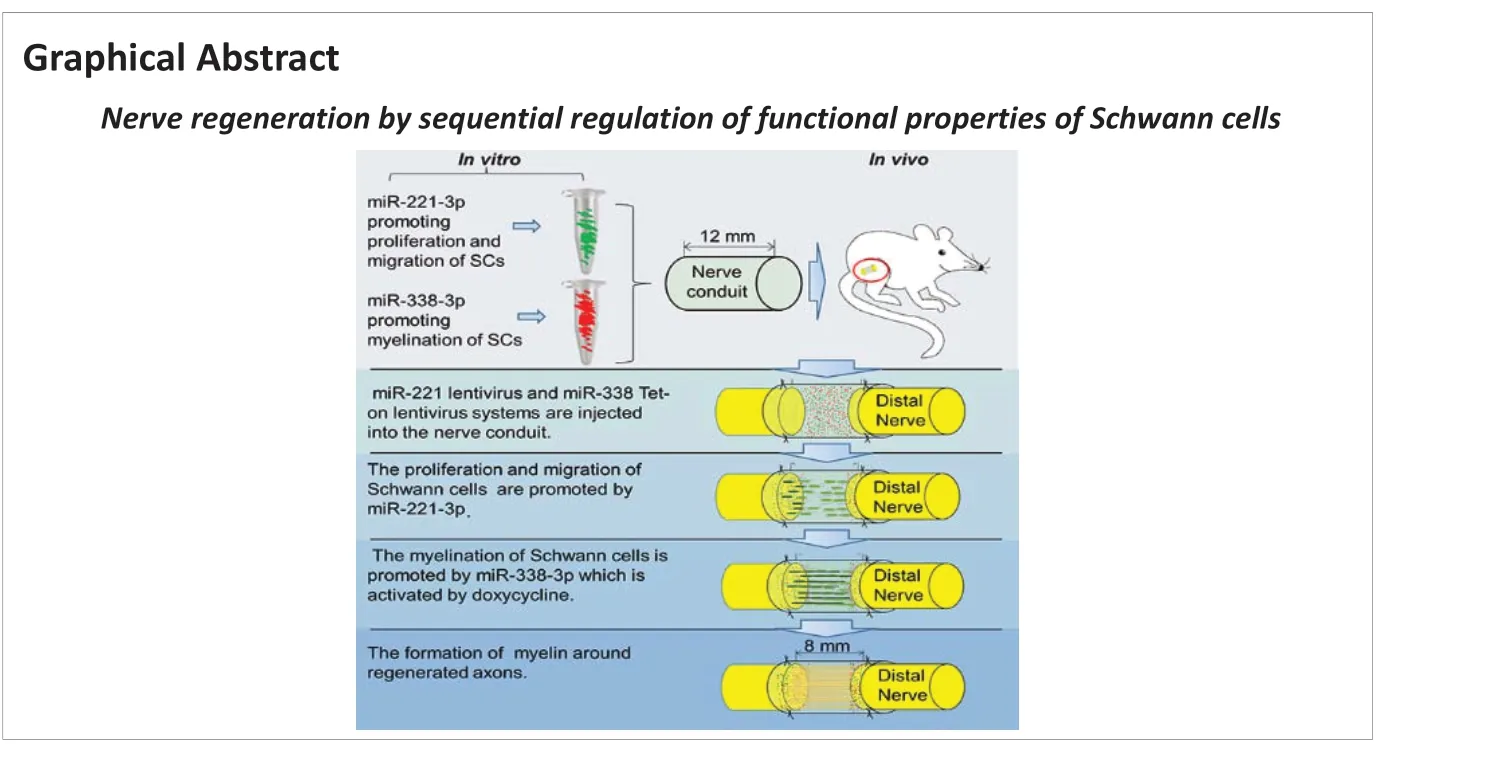
In this study, we investigated how to stimulate endogenous SCs to optimize their functions in nerve repair. We developed a miR-221 and doxycyclineinducible Tet-On-miR-338-3p lentiviral vector system to achieve sequential expression of miR-221-3p/miR-338-3p to enhance the functional properties of SCs and promote the repair and functional recovery of injured nerves.
Methods
Sciatic nerve defect model
Animal experimental procedures were approved by the Laboratory Animal Welfare and Ethics Committee of China Medical University (approval No. CMU2019220) on May 23, 2019 and performed in accordance with guidance of the Administration Committee of Experimental Animals of China. The experimental process is shown inFigure 1
. Wistar rats were provided by Liaoning Changsheng Biotechnology Co., Ltd. (SCXK (Liao) 2020-0001) and raised under standard conditions (temperature 21 ± 2°C; humidity 55 ± 5%; a 12-hour light/dark cycle).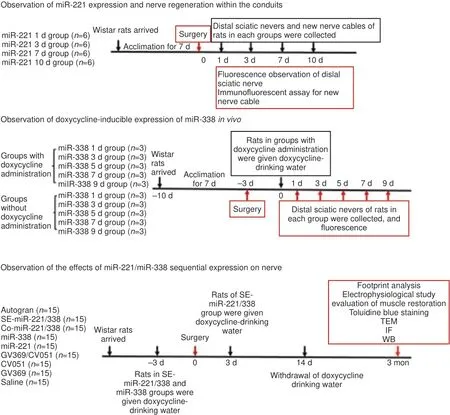
Figure 1 |Schematic illustration of experimental analyses.IF: Immunofluorescence assay; SE: sequential expression; TEM: transmission electron microscope; WB: Western blot.
Male rats (150‒180 g, 8-weeks-old) were randomly divided into six groups (n
= 6/group) and anesthetized by intraperitoneal injection (i.p.) of 1% sodium pentobarbital solution (40 mg/kg, Shanghai Vokai Sinopharm Group Chemical Reagent Co., Ltd., Shanghai, China). An incision was made in the mid-thigh of the right hindlimb with a scalpel. An 8-mm-long segment of the sciatic nerve at the site just proximal to the division of tibial and common peroneal nerves was exposed, lifted, and removed. A silicone tube (Kunshan to Europe And the United states of Silica Gel tube industry limited company, China) was used to bridge the proximal nerve stump and distal nerve stump, and the incision was sutured in layers using a 5-0 line (Ao et al., 2011). After surgery, the rat was housed in large cages with sawdust bedding. The sciatic nerve (proximal and distal stumps) was collected on the 0, 1, 4, 7, 14, or 21day after injury, frozen in liquid nitrogen, and stored at ‒80°C.Quantitative polymerase chain reaction
Total RNA of sciatic nerves samples or cell samples from each group was extracted using Trizol reagent (Invitrogen, Carlsbad, CA, USA) following the manufacturer’s instructions. For miRNA, the extracted RNA was used for complementary DNA (cDNA) synthesis using a Mir-X miRNA First-Strand Synthesis Kit (Takara, Otsu, Japan) following the manufacturer’s protocol. Quantitative polymerase chain reaction (qPCR) was performed using the SYBR Advantage qPCR Premix (Takara) on the Light Cycler 480 (Roche, Basel, Switzerland). For mRNA, the Primerscript RT reagent Kit (Takara) was used to reverse transcribe RNA to synthesize cDNA, and the SYBR® Premix Ex TaqII kit (Takara) was used to perform qPCR. The primers were designed and synthesized by Sangon Biotech Co., Ltd. (Shanghai, China;Table 1
). The expressions of miRNAs were normalized to U6. The data of mRNA (Cdkn1b
,Ddit4
,mtmr1
,RFc1
,Nrp1
andS100a16
mRNAs) were normalized toGAPDH
mRNA. The results of qPCR analyzed by the 2method were expressed as fold changes relative to the control group (Arocho et al., 2006). Measurements were performed in triplicate in a single assay.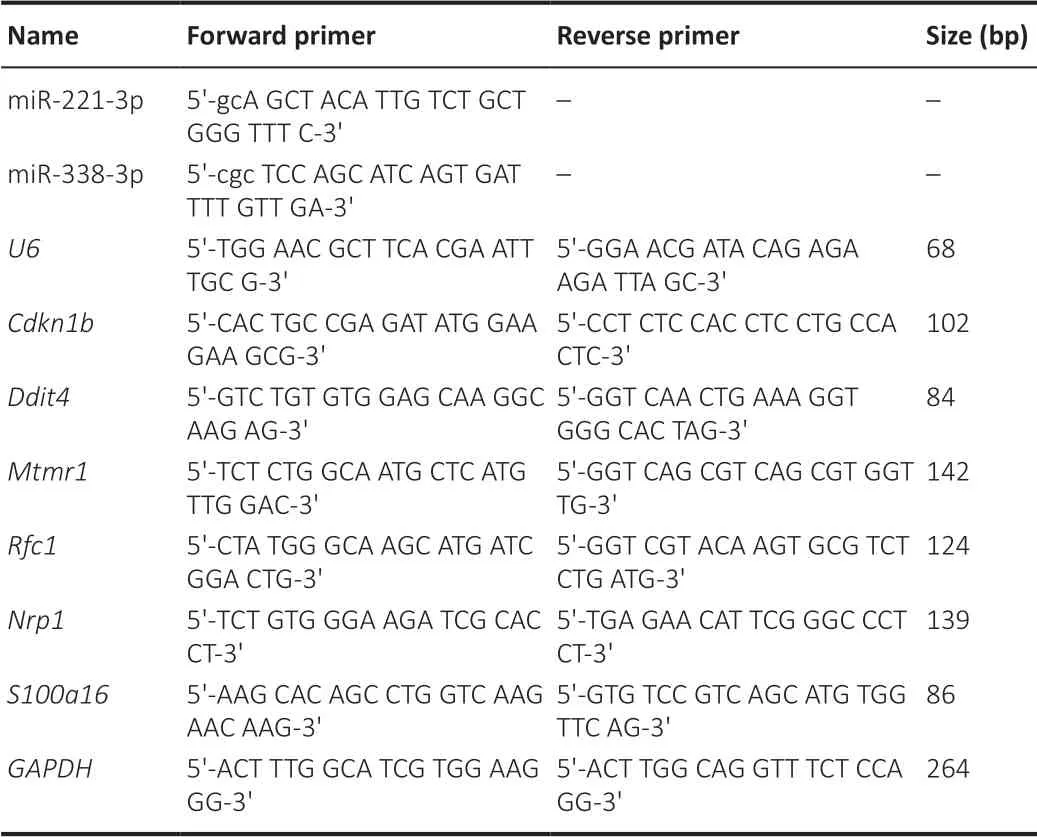
Table 1 | The primer sequences
Fluorescence
in situ
hybridization
Fluorescencein situ
hybridization (FISH) was performed with a FISH Kit (GenePharma, Shanghai, China). The frozen proximal sciatic nerves of 4day and 14day groups were cut into 14 µm-thin sections using a cryostat. The sections were fixed with 4% paraformaldehyde for 20 minutes, washed in phosphate buffer saline (PBS), and treated by protein K. After dehydration in a graded series of ethanol (20‒100%), the sections were incubated in denatured solution at 78°C for 8 minutes. The sections were incubated with a hybridization solution containing Cy3-labeled anti-miR-338-3p oligodeoxynucleotide probe (GenePharma) and carboxyl fluorescein (FAM)-labeled anti-miR-221-3p oligo-deoxynucleotide probe (GenePharma) at 37°C for up to 16 hours in the dark. The sections were washed by side scatter for 5 minutes at 43°C, blocked with 2% bovine serum albumin in PBS for 1 hour at room temperature (23 ± 2°C), and incubated with rabbit anti-S100 antibody (1:250; Abcam, Cambridge, UK, Cat# ab52642, RRID: AB_882426) overnight at 4°C. The sections were then washed three times with PBS and incubated with goat anti-rabbit secondary antibody (Alexa Fluor® Plus 647, Thermo Fisher Scientific, Carlsbad, CA, USA, Cat# A32733, RRID: AB_2633282) for 1 hour at room temperature. The sections were stained with 2-(4-amidinophenyl)-6-indolecarbamidine dihydrochloride (DAPI) and imaged using a confocal fluorescence microscope (Nikon A1R, Tokyo, Japan).Target gene and functional prediction of miR-221-3p and miR-338-3p
The miRNA Target Prediction Database (miRDB, http://mirdb.org/) (Chen and Wang, 2020) was used to predict target genes of miR-221-3p and miR-338-3p. Gene Ontology (GO) analysis (https://david.ncifcrf.gov/home.jsp) was used to annotate the functions of miRNAs through their target genes. The STRING database (http://string.embl.de) was used to annotate the function of target protein of miR-221-3p/miR-338-3p and draw protein-protein interaction network maps. The false discovery rate was calculated to correct theP
value.Primary cell culture of neurons and SCs
Primary cultured neurons and SCs were dissected from the dorsal root ganglion (DRG) tissues and sciatic nerve of newborn Wistar rats (specific pathogen-free level), respectively. Newborn rats (n
= 5/time point) within 24 hours after birth were immersed in 75% alcohol for 5 minutes before decapitation and tissue extraction. DRG tissues or sciatic nerve were dissociated to single cells using 1 mg/mL collagenase type I (Sigma, St. Louis, MO, USA) and 0.1% trypsin (Hyclone, Logan, UT, USA). The dissociated cells were suspended in Dulbecco’s modified Eagle medium/nutrient mixture F-12 (DMEM/F12, Hyclone) containing 10% fetal calf serum (Gibco, Carlsbad, CA, USA), 100 U/mL penicillin, and 100 µg/mL streptomycin for 24 hours at 37°C under 5% CO. Primary neurons or SCs were cultured with neurobasal medium (Gibco) supplemented with B27 (Invitrogen, 17504044), 2 mM GlutaMAX (Sigma), 100 U/mL penicillin (Hyclone), 100 µg/mL streptomycin (Hyclone), 21 mg/mL bovine pituitary extract, and 4 mM forskolin. To remove fibroblasts, the cytarabine arabinoside (Solarbio, Beijing, China) and anti-Thy1.1 (Santa Cruz Biotechnology, Dallas, TX, USA) and rabbit complement (Equitech-Bio, Kerrville, TX, USA) were used. Primary neuronal cultures were obtained, and SC cultures (approximately 98% pure) were subjected to 4′6-diamidino-2-phenylindole (DAPI) and S100 immunofluorescence. SC cultures were passaged no more than three times before experiments.Cell transfection
The sequences of miRNA mimics (miR-221-3p mimics, mimics negative control (mimics NC), miR-338-3p mimics), miRNA inhibitor (miR-221-3p inhibitor, miR-338-3p inhibitor, inhibitor NC), siRNA (Cdkn1b siRNA, siRNA NC, siRNA Nrp1) are shown inTable 2
(GenePharma). Following to the specific requirements of the experiment, miRNA mimics, miRNA inhibitor and siRNA were transfected into cells alone or co-transfected to SCs using Lipofectamine RNAiMAX transfection reagent (Invitrogen) following the manufacturer’s instructions. The transfected SCs were used in subsequent experiments.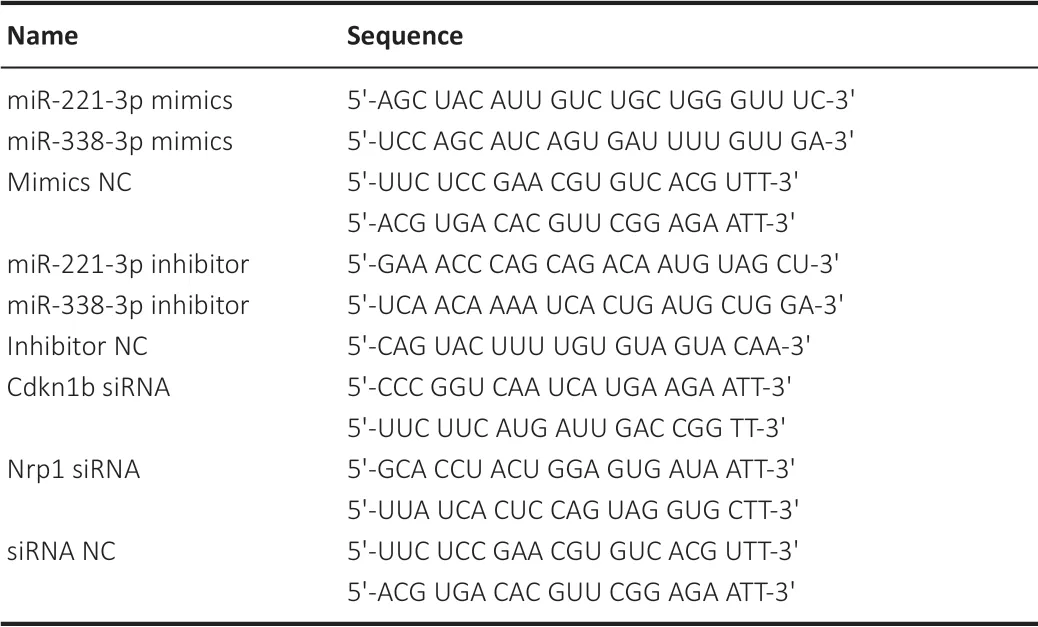
Table 2 |Sequences of miRNA mimics, miRNA inhibitor and siRNA
Cell proliferation assay
Proliferation of transfected SCs was determined using Cell Counting Kit-8 (CCK-8, Abbkine, Wuhan, China). Briefly, SCs were seeded (5 × 10cells/mL, 100 µL/well) in a 96-well plate and cultured at 37°C in 5% CO. After 0‒4 days, CCK-8 solution (10 µL) was added to each well, and cells were incubated for 4 hours. The absorbance was measured at 450 nm using a microplate reader (Tecan, Salzburg, Austria).Cell migration assay
Migration of transfected SCs was measured using 6.5 mm Transwell chambers with 8 mm-sized pores (Costar, Cambridge, MA, USA). The membrane was coated with 10 mg/mL fibronectin. SCs (1 × 10cells/mL, 100 µL) were transferred to the top chambers, and 600 µL of complete medium was added to the lower chambers. Cells were cultured at 37°C in 5% COfor 24 hours. The top of each membrane was cleaned with a cotton swab at the indicated time point. Cells adhering to the bottom surface of the membrane were stained with 0.1% crystal violet and counted using a DMR inverted microscope (Leica Microsystems, Wetzlar, Germany). Five fields were selected in each membrane. Assays were performed three times using triplicate wells.
Co-culture of DRG neurons and SCs
Transfected SCs (2.5 × 10) were seeded in wells of 12-well plate containing DRG neurons in Dulbecco’s modified Eagle medium (DMEM) supplemented with 10% fetal calf serum and 1% penicillin/streptomycin (Gibco) for 2 days to promote SC adherence. Axon growth of DRG neurons was observed.
In other experiments, SCs transfected with miR-338-3p mimics or mimics NC (or co-transfected with miR-338-3p inhibitor and siRNA Nrp1/siRNA NC) were co-cultured with DRG neurons. Myelination was induced 7 days later by adding 50 µg/mL ascorbic acid (Sigma), and the co-cultures were maintained by refeeding every 2 days with fresh media containing ascorbic acid.
Construction of lentiviral vector systems
The construction process of lentivirus vector system and precursor sequences of rat miR-221 and miR-338 were found in mirBase (https://mirbase.org) (Zhong et al., 2019), and the target gene fragments were synthesized (Table 3
). The pre-miR-221 gene was inserted in the cloning site (AgeI/NheI) of GV369 vector (Genechem Co., Shanghai, China) and the mcherry-pre-miR-338 gene was inserted in the cloning site (AgeI/MluI) of CV051 (Genechem Co.).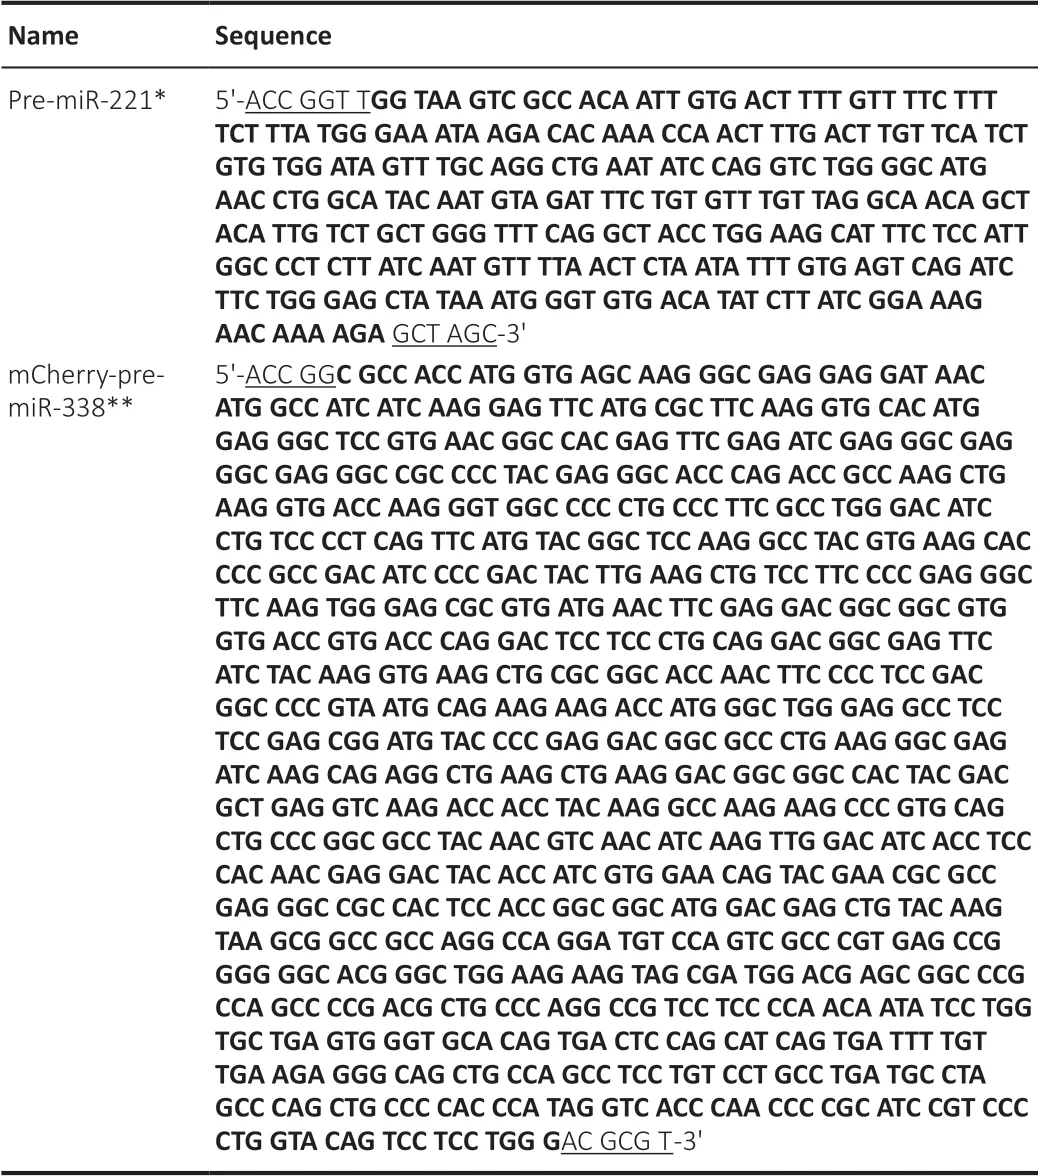
Table 3 |Sequences of rat miR-221 and mcherry-miR-338 gene fragments
To generate lentivirus, 293T cells (American Type Culture Collection, Manassas, VA, USA, Cat# PTA-4488, RRID: CVCL_0045) were cultured in DMEM supplied with 10% fetal bovine serum, 100 U/mL penicillin, and 100 µg/mL streptomycin. The recombinant plasmids were co-transfected with helper plasmids (phelper 1.0, Genechem Co.) and enveloped expression plasmids (phelper 2.0, Genechem Co.) for packaging into 293T cells at 80% confluency using vigorous oligofectamine reagent (Vigorous Biotechnology Beijing Co., Ltd., Beijing, China). After 3 days, 293T cells were harvested; supernatants were subjected to ultracentrifugation and virus with a titer of 1 × 10IU/mL was used for animal experiments. The miR-221 lentivirus system was named as LvmiR-221-EGFP and the miR-338 Tet-on lentivirus system was named as LvmiR-338-mCherry in subsequent experiments.
Sciatic nerve defect model with LvmiR-221-EGFP transfection
Male Wistar rats (150‒180 g, 8-week-old, specific-pathogen-free level) were divided into four groups (1-, 3-, 7-, and 10-day groups after surgery,n
= 6 rats/group) and housed under a 12-hour light cycle, with standard rodent food and unlimited water before the surgery. The procedure of establishing the sciatic nerve defect rat model was the same as described above. LvmiR-221-EGFP (2 µL, 1 × 10IU/mL) was injected in the nerve conduit (filled with normal saline), which was used to bridge the nerve defect for rats.Fluorescence observation of distal nerve sections after LvmiR-221-EGFP transfection was performed. After anesthesia with 1% sodium pentobarbital solution (40 mg/kg, Shanghai Vokai Sinopharm Group Chemical Reagent Co., Ltd., Shanghai, China), the distal sciatic nerves of rats were collected, frozen in liquid nitrogen, and cut into 14 µm-thin sections using a cryostat (Thermo Fisher Scientific, Waltham, MA, USA). The sections of the distal sciatic nerve in each group were subjected to fluorescence microscopy. Detection of green fluorescence indicated that LvmiR-221-EGFP infected tissue and expressed the target gene.
Evaluation of new nerve cable after LvmiR-221-EGFP transfection
There was no obvious new nerve cable in rats of the 1-day group, so the 1-day group was not examined. Rats from the 3-, 7- and 10-day groups were anesthetized with 1% sodium pentobarbital solution (40 mg/kg body weight). The new nerve cable in the nerve conduit was removed, placed in 4% paraformaldehyde for 6 hours, and immersed in 30% sucrose solution for 2 days. The new nerve cable was then frozen in liquid nitrogen and cut into 14 µm-thick longitudinal sections on a cryostat. The sections of new nerve cable were washed three times with 0.01 M PBS and then incubated with bovine serum albumin (BSA; 5% BSA and 0.3% Triton X-100 in PBS) for up to 30 minutes at 37°C to cancel non-specific staining. The sections were incubated in a solution containing mouse anti-neurofilament 200 (NF200, a marker protein of axon, 1:250, Abcam, Cat# ab19386, RRID: AB_444887) and rabbit anti-S-100 antibody (S-100, a marker protein of SCs, 1:250, Abcam, Cat# ab52642, RRID: AB_882426) overnight at 4°C. The sections were washed in PBS and incubated with goat anti-mouse second antibody conjugated with Alexa Fluor® Plus 594 (1:500, Thermo Fisher Scientific, Cat# A32742, RRID: AB_2762825) and goat anti-rabbit second antibody conjugated with Alexa Fluor® Plus 647 (1:500, Thermo Fisher Scientific, Cat# A32733, RRID: AB_2633282) for 2 hours at 37°C. Nuclei were stained with DAPI. Sections were mounted with glycerin and observed by confocal fluorescence microscopy. To assess non-specific staining, PBS was used instead of primary antibody.
Sciatic nerve defect model with LvmiR-338-mCherry transfection
The sciatic nerve defect model was established in 30 male Wistar rats (150‒180 g, 8-weeks-old) and LvmiR-338-mCherry was injected in nerve conduits. The animals were randomized into two groups (15 rats/group); one group was treated with doxycycline and the control group received sucrose. From previous experiments, treatments (doxycycline (200 ng/mL), Sigma, D9891; and sucrose (1%) in drinking water) were started at the 3day after surgery. The distal sciatic nerves were collected in 1, 3, 5, 7 and 9 days after doxycycline treatment (n
= 3 rats/time point).The distal nerve sections in each group were examined by fluorescence observation as described above.
Animal model of miR-221/miR-338 sequential expression on nerve regeneration
Male Wistar rats (150‒180 g, 8-weeks-old, SPF level) were randomly divided into nine groups (n
= 15 rats/group): autograft group (autograft), sequential expression of miR-221 and miR-338 group (SE-miR-221/338), co-expression of miR-221 and miR-338 group (Co-miR-221/338), miR-338 expression group (miR-338), miR-221 expression group (miR-221), two empty lentivirus vectors group (GV369/CV051), empty lentivirus CV051 vector group (CV051), empty lentivirus GV369 vector group (GV369), and saline group (saline). The sciatic nerve defect model was established. The nerve conduits in SE-miR-221/338 and Co-miR-221/338 groups were injected with LvmiR-338-mCherry (2 µL, 1 × 10IU/mL) and LvmiR-221-EGFP (2 µL, 1 × 10IU/mL). The nerve conduits in the miR-338 group were injected with LvmiR-338-mCherry (2 µL, 1 × 10IU/mL). The nerve conduits in the miR-221 group were injected with LvmiR-221-EGFP (2 µL, 1 × 10IU/mL). The SE-miR-221/338 group received doxycycline-containing water (200 mg/L, 1% sugar) starting from the 3day after surgery, and the Co-miR-221/338 and miR-338 group received doxycycline-containing water starting from the 3day before surgery. After surgery, rats were housed in standard conditions for 3 months.Footprint analysis
At 3 months after surgery, the animals underwent footprint analysis. A white paper-lined walkway (8 cm × 42 cm) that led into a darkened cage was used to collect footprints of rats (Meek et al., 1999; Ao et al., 2011). The right hind feet (the experimental side) were dipped in red carbon ink and the left hind feet (the intact side) were dipped in black carbon ink. Rat were allowed walk down the track and footprints were examined. Three parameters were measured: print length (PL), the distance from the heel to the third toe; toe spread (TS), the distance from the first to the fifth toe; and the intermediate toe spread (ITS), the distance from the second to the fourth toe. These parameters were used to compute the data of print length factor (PLF), toe spread factor (TSF), intermediary toe spread factor (ITSF), and sciatic functional index (SFI). The formulas are as follows; E indicates experimental side, while N indicates normal control.
SFI = ‒38.3 × (EPL ‒ NPL)/NPL + 109.5 × (ETS ‒ NTS)/NTS + 13.3 × (EITS ‒ NITS)/NITS ‒ 8.8.
Electrophysiological study and evaluation of muscle restoration
At 3 months after surgery, rats were subjected to electrophysiological study. After anesthesia with 1% sodium pentobarbital solution (40 mg/kg), the right sciatic nerve (the experimental side) was re-exposed by a skin incision. Bipolar electrodes (Chengdu Instrument Factory, Chengdu, China) were used; an electrode was placed at the proximal trunk of the grafts and delivered single electrical pulses, while another electrode was inserted into the anterior tibial muscle for recording compound muscle action potentials (CMAPs). Two parameters were used to calculate the conduction velocity of CMAPs: the latency of CMAPs and the distance between the stimulation and recording sites. After electrophysiological procedures, muscle recovery rate (mid-shank girth of the experimental side/the intact side) was measured and calculated as experimental-side circumference percentage relative to the intact side to evaluate shank muscle restoration following post-traumatic atrophy.
Toluidine blue staining and transmission electron microscopy
Following the electrophysiological study and evaluation of muscle restoration, the animals were anesthetized with 1% sodium pentobarbital solution (40 mg/kg, i.p.); the distal sciatic nerves were removed and fixed in 2.5% glutaraldehyde (0.1 M PBS, pH 7.4) for up to 24 hours. The nerves were cut into blocks (1 mm long) after washing in 0.1 M PBS. The blocks were immersed in 1% osmium tetroxide for 2 hours at 4°C, rinsed in distilled water, and dehydrated in a graded series of ethanol (20‒100%) and propylene oxide. Following infiltration with Epon812, the blocks were placed at 65°C (48 hours) for polymerization. The blocks were then cut into 0.5 µm semi-thin sections by glass knives, stained with 1% toluidine blue, and observed using light microscopy (BX53; Olympus, Tokyo, Japan). Three images of each section were collected randomly (400×) and the myelinated axon density (number of axons/mm) was determined using ImageJ software (version 1.51j8) (Schneider et al., 2012).
For transmission electron microscopy (TEM), the nerve blocks were cut into ultra-thin sections (50 nm) by diamond knives. The sections were stained by 4% uranyl acetate and Reynolds. A TEM (JEM-1200EX; JEOL, Tokyo, Japan) was used to observe the sections. Three images of each TEM section were collected randomly (2000×), and the average myelin area was determined using ImageJ software.
Immunofluorescence assay
Three months after surgery, the animals were anesthetized with 1% sodium pentobarbital solution (40 mg/kg, i.p.). The distal sciatic nerves were removed in 4% paraformaldehyde at 4°C for 6 hours, immersed in 30% sucrose solution for 2 days, and frozen in liquid nitrogen. The frozen samples were cut into 14 µm-thick sections on a cryostat and evaluated by immunofluorescence as described above. The sections were incubated with primary antibodies (1:250) for chicken anti-MBP (a marker protein of myelin sheath, Abcam, Cat# ab 123499, RRID: AB_10973910), mouse anti-NF200 (Abcam, Cat# ab19386, RRID: AB_444887) and rabbit anti-S100 (Abcam, Cat# ab52642, RRID: AB_882426) at 4°C for 12 hours. Samples were then incubated with goat anti-chicken secondary antibody (1:500) conjugated with Alexa Fluor® Plus 594 (Thermo Fisher Scientific, Cat# A32759, RRID: AB_2762829), goat anti-mouse secondary antibody (1:500) conjugated with Alexa Fluor® Plus 488 (Thermo Fisher Scientific, Cat# A32723, RRID: AB_2633275), and goat anti-rabbit secondary antibody (1:500) conjugated with Alexa Fluor® Plus 647 (Thermo Fisher Scientific Cat# A32733, RRID: AB_2633282). The samples were examined and imaged using a confocal fluorescence microscope.
For cells, chicken anti-MBP (Abcam, Cat# ab 123499, RRID: AB_10973910) and mouse anti-NF200 (Abcam, Cat# ab19386, RRID: AB_444887) were used as primary antibodies, and goat anti-chicken secondary antibody (1:500) conjugated with Alexa Fluor® Plus 594 (Thermo Fisher Scientific, Cat# A32759, RRID: AB_2762829) and goat anti-mouse secondary antibody (1:500) conjugated with Alexa Fluor® Plus 488 (Thermo Fisher Scientific, Cat# A32723, RRID: AB_2633275) were used as secondary antibodies.
Western blot assay
To obtain nerves, rats were anesthetized with 1% sodium pentobarbital solution (40 mg/kg, i.p.), and distal sciatic nerves were removed and immediately frozen in liquid nitrogen. Protein samples of the nerves were separated by sodium dodecyl sulfate-polyacrylamide gel electrophoresis and transferred to a polyvinylidene fluoride membrane (Millipore, Bedford, MA, USA). After blocking with 5% dried skim milk, the membranes were incubated with chicken anti-MBP (1:500, Abcam, Cat# ab 123499, RRID: AB_10973910), mouse anti-NF200 (1:500, Abcam, Cat# ab19386, RRID: AB_444887) and rabbit anti-S100 (1:500, Abcam, Cat# ab52642, RRID: AB_882426) overnight at 4°C. After washing in Tris-buffered saline with Tween 20, the membranes were incubated with goat anti-chicken secondary antibody (1:1000, Abcam, Cat# ab6877, RRID: AB_955465), rabbit anti-mouse secondary antibody (1:1000, Abcam, Cat# ab6728, RRID: AB_955440), and goat anti-rabbit secondary antibody (1:1000, Abcam, Cat# ab97051, RRID: AB_10679369) for 2 hours at room temperature. The membranes were examined using enhanced chemiluminescence (Amersham Pharmacia Biotech, Buckinghamshire, UK). Anti-glyceraldehyde-3-phosphate dehydrogenase (GAPDH, 1:1000, Santa Cruz Biotechnology, Cat# sc-47724, RRID: AB_627678) was used to confirm equal protein loading and for protein expression normalization. The Gel Image Analysis System (Tanon 2500R, Shanghai, China) was used to analyze the bands.
For cells, the western blot procedure is the same as above. Rabbit anti-Cdkn1b/p27kip (1:500, Abcam Cat# ab32034, RRID: AB_2244732) and rabbit anti-Nrp1 (1:500, Abcam Cat# ab81321, RRID: AB_1640739) were used for primary aantibodies, and anti-rabbit secondary antibody (1:1000, Abcam, Cat# ab97051, RRID: AB_10679369) was used for secondary antibody.
Nanopore whole transcriptome re-sequencing
Primary cultured SCs transfected with miR-221-3p mimics, miR-338-3p mimics and mimics NC (GenePharma) were used in nanopore whole transcriptome re-sequencing. The experimental procedure was performed in accordance with the standard protocol provided by Oxford Nanopore Technologies. Oxford Nanopore Technologies sequencing is a new generation of real-time single molecule electrical signal sequencing technology based on nanopores. Total RNA was extracted from the primary SCs using Trizol reagent (Invitrogen), and the cDNA libraries were built from 1 µg total RNA using the cDNA-PCR Sequencing Kit (SQK-PCS109). The final cDNA libraries were added to FLOMIN109 flow cells and run on the PromethION platform (Biomarker, Beijing, China). The raw sequence data used for analysis are available in NCBI under the Sequence Read Archive with the BioProject PRJNA767931. Differentially expressed gene (DEG) analysis was used to identify the downregulated genes in cells expressing miR-221-3p mimics or miR-338-3p mimics compared with mimics NC.
Bioinformatics analysis and target gene screening
miRDB was used to predict target genes of miR-221-3p and miR-338-3p. The results were used to obtain the overlapping genes with DEG analysis results of Nanopore whole transcriptome re-sequencing results.
qPCR and western blot were performed to screen target genes of miR-221-3p and miR-338-3p from the overlapping genes.
Dual-luciferase assay
The 3′-untranslated region (UTR) sequences of Cdnk1b or Nrp1 mRNA were amplified from genomic DNA and sub-cloned directly downstream of the stop codon in the pmiRGlo vector. Mutations in the miRNA binding sites in the 3′UTR of Cdkn1b or Nrp1 were generated by direct DNA synthesis (GenPharma, Shanghai, China), and the sequences were cloned into the pmir-GLO vector. The reporter vectors were co-transfected with miRNA mimics into HEK-293T cells. After 48 hours, luciferase assays were performed using the Dual Luciferase Reporter Assay System (Promega, Madison, WI, USA) and a Microplate Reader (Tecan, Salzburg, Austria).
Statistical analysis
We predicted the number of rats for experiments using Gpower software (version 3.1.9.3; Heinrich-Heine-University, Düsseldorf, Germany). The outcome assessors were blinded to assignment. All data were expressed as mean ± standard deviations (SD). Significant differences among groups were analyzed by one-way analysis of variance (ANOVA) followed by Tukey’spost hoc
test using IBM SPSS Statistics 24 (IBM Corp, Armonk, NY, USA). Student’st
-tests were performed to determine the significant differences between two groups. Heat maps depict the clusters with categories union analyses using Fisher’s Exact Test. GraphPad Prism 5 Software (GraphPad Software, Inc., San Diego, CA, USA, www.graphpad.com) was used for drawing.Results
Upregulated expression of miR-221-3p and miR-338-3p in injured sciatic nerves
The functions of miR-221-3p and miR-338-3p were predicted using miRDB and GO analysis (Table 4
). The results indicated that miR-221-3p is associated with nerve regeneration and miR-338-3p is associated with structural and functional characteristics of cells. These results, together with previous reports on the effects of miR-221-3p and miR-338-3p on nerve repair (Wang et al., 2016; Song et al., 2017), led us to examine the roles of these miRNAs in sciatic nerves after injury.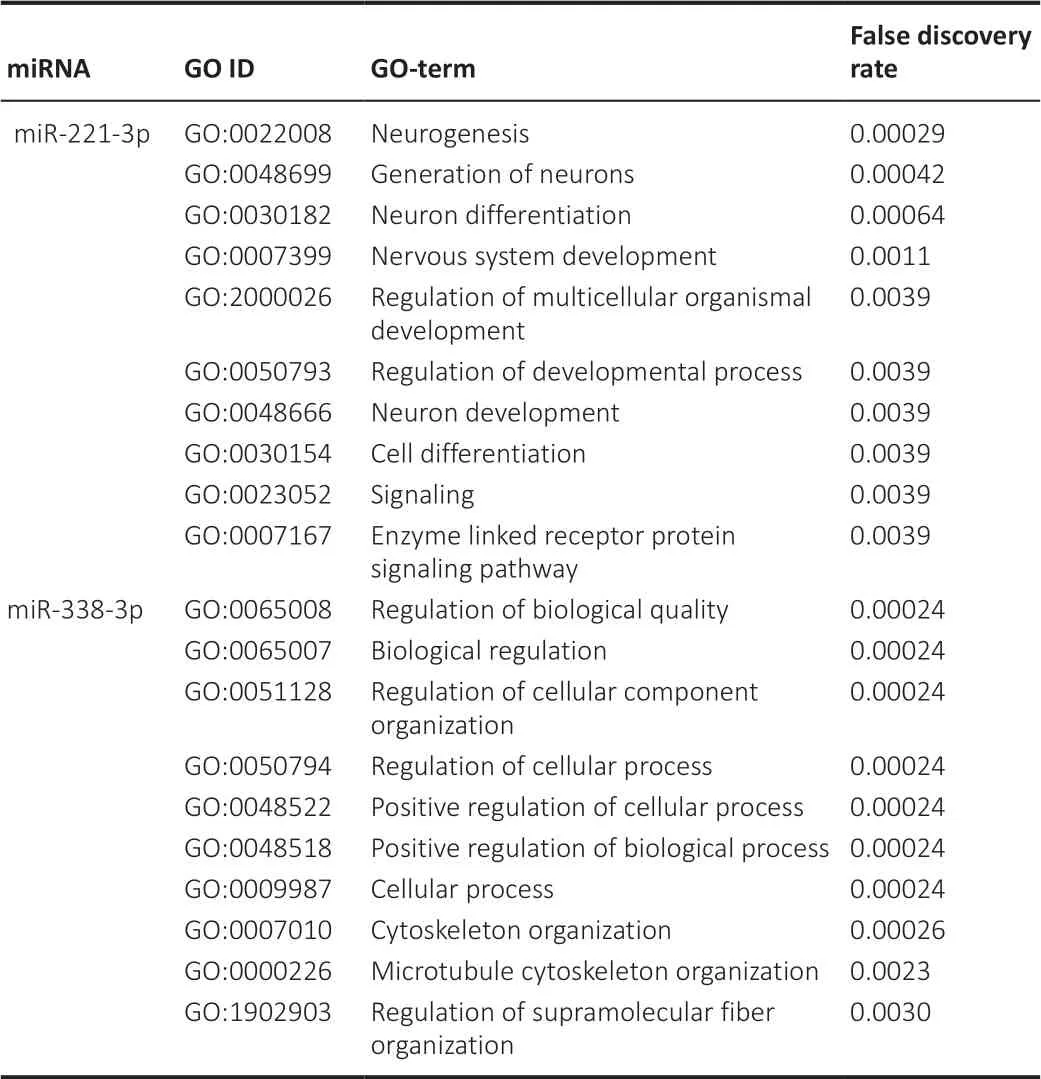
Table 4 |The function prediction of miR-221-3p and miR-338-3p
Rats with sciatic nerve defect as nerve injury models were used to investigate the expression and localization of miR-221-3p and miR-338-3p in injured sciatic nerves. qPCR was used to detect the expressions of miR-221-3p and miR-338-3p in the proximal and distal stumps of sciatic nerves at 0, 1, 4, 7, 14, and 21 days after nerve transection. miR-221-3p and miR-338-3p were expressed in both proximal and distal stumps and peaked at 4 and 14 days, respectively, after nerve transection (Figure 2
). FISH in combination with immunostaining was used to detect the location of miR-221-3p and miR-338-3p in the proximal stumps of sciatic nerves at 4 and 14 days after nerve transection. The results showed that most miR-221-3p and miR-338-3p were expressed in cells positive for S100 (a marker of SCs) (Figure 2
), which suggested that the expression of miR-221-3p and miR-338-3p of SCs increased after nerve injury.miR-221-3p overexpression promotes proliferation and migration of SCs
To investigate the functions of miR-221-3pin vitro
, miR-221-3p mimics and inhibitor were transfected into primary SCs. Primary SCs exhibit spindle morphology and express S100, with a purity of up to 98% (Figure 3A
). Results inFigure 3B1
andB2
confirmed that miR-221-3p mimics (P
< 0.0001) and inhibitor (P
= 0.0086) increased and inhibited the expression of miR-221-3p in SCs, respectively. CCK8 assays showed that the proliferation rate of SCs after overexpression of miR-221-3p was increased compared with that of other groups (Figure 3C
). Transwell assays show that miR-221-3p mimics significantly promoted the migration of SCs, while miR-221-3p inhibitor decreased the migration capacity (Figure 3D
andE
). Moreover, co-culture of primary SCs and DRG neurons showed that miR-221-3p mimics increase the length of the neurite, while miR-221-3p inhibitor decreased the length of neurite in comparison with the mimics NC group (Figure 3F
). These findings indicate that miR-221-3p promotes proliferation and migration of SCs and accelerates the neurite outgrowth.miR-338-3p overexpression promotes myelination
qPCR results confirmed that miR-338-3p expression was upregulated or downregulated after miR-338-3p mimics or inhibitor transfection into SCs, respectively (Figures 3B3
andB4
). The results inFigure 3G
show an increased myelination level after miR-338-3p overexpression of SCs co-cultured with DRG neurons.
Figure 2 |Increased expression of miR-221-3p and miR-338-3p in proximal and distal nerve stumps at different time points after nerve transection. (A, B) The expression of miR-221-3p (proximal: F(5, 53) = 8.624, P < 0.0001; distal: F(5, 53) = 9.199, P < 0.0001) and miR-338-3p (proximal: F(5, 53) = 12, P < 0.0001; distal: F(5, 53) = 8.403, P < 0.0001) in proximal and distal nerve stumps detected by qPCR. In both proximal and distal nerve stumps, miR-221-3p expression peaks on day 4 after nerve transection and then declined. The expression of miR-338-3p gradually increased and peaked on day 14 after surgery. Data are represented as the mean ± SD (n = 9 for each group). *P < 0.05, **P < 0.01, ***P < 0.01, vs. Control group; #P < 0.05, vs. 4 days group; &P < 0.05, vs. 14 days group (one-way analysis of variance followed by the Tukey’s post hoc test). (E, F) The expression of miR-221-3p (green, FAM), miR-338-3p (red, Cy3) and S100 (purple, Alexa Fluor® Plus 647) in proximal stump at day 4 (E) and 14 (F). Scale bars: 50 µm. miR: miRNA; qPCR: quantitative PCR; 1‒21d: 1‒21 days after sciatic nerve injury.
Verification of sequential expression of miR-221 and miR-338 Tet-on lentivirus system in 293T cells
The miR-221 lentivirus system and miR-338 Tet-on lentivirus system can be used togetherin vivo
to sequentially express miR-221-3p and miR-338-3p to regulate the function of SCs after sciatic nerve injury. We next generated miR-221 lentivirus and a doxycycline-inducible miR-338 Tet-on lentivirus system, allowing for control of miR-338-3p overexpression, as described in Methods (Figure 4A
). Enhanced green fluorescence protein gene (EGFP) that shows green fluorescence was inserted into LvmiR-221-EGFP and mcherry gene that shows red fluorescence was inserted into LvmiR-338-mCherry. qPCR and immunofluorescence showed that miR-221-3p was expressed in both 293T cell groups with or without doxycycline induction, while miR-338-3p was only expressed in the doxycycline-inducible group (Figure 4B–D
). These findings verify that the miR-338 Tet-on lentivirus system can be controlled by doxycycline.Determination of the time-window of expression from miR-221-3p to miR-338-3p
in vivo
Green fluorescence was observed at the 3day in sciatic nerve stumps after LvmiR-221-EGFP was injected into nerve conduits (Figure 5A
), which suggests that expression of miR-221-3p took 3 days. At the 3day after injection of LvmiR-221-EGFP, we observed a small amount of nerve tissue growing into the nerve conduit from both proximal and distal nerve stumps. At the 7day, there was a fibrous connection throughout the gap, but it was very thin; at the 10day, there was an obvious tissue cable in the nerve conduit between the two nerve ends (Figure 5B
). NF200 and S100 were weakly expressed in regenerated nerve tissue at the 7day. S100 fluorescence indicates that SCs have crossed the gap at the 10day, while NF200 fluorescence indicates that axons grow from the proximal end to the distal end. SCs and axons were arranged orderly at the 10day. Hence, miR-338 overexpression to promote myelination should be induced at the 10day after injection of miR-221. Rats injected with LvmiR-338-mCherry, which is induced by doxycycline, expressed miR-338-3p at 7 days after drinking water containing doxycycline (Figure 5C
). Therefore, from the results ofFigure 5B
andC
, we deduced that rats should be given doxycycline at the 3day after co-injection of LvmiR-221-EGFP and LvmiR-338-mCherry into the nerve conduitsin vivo
.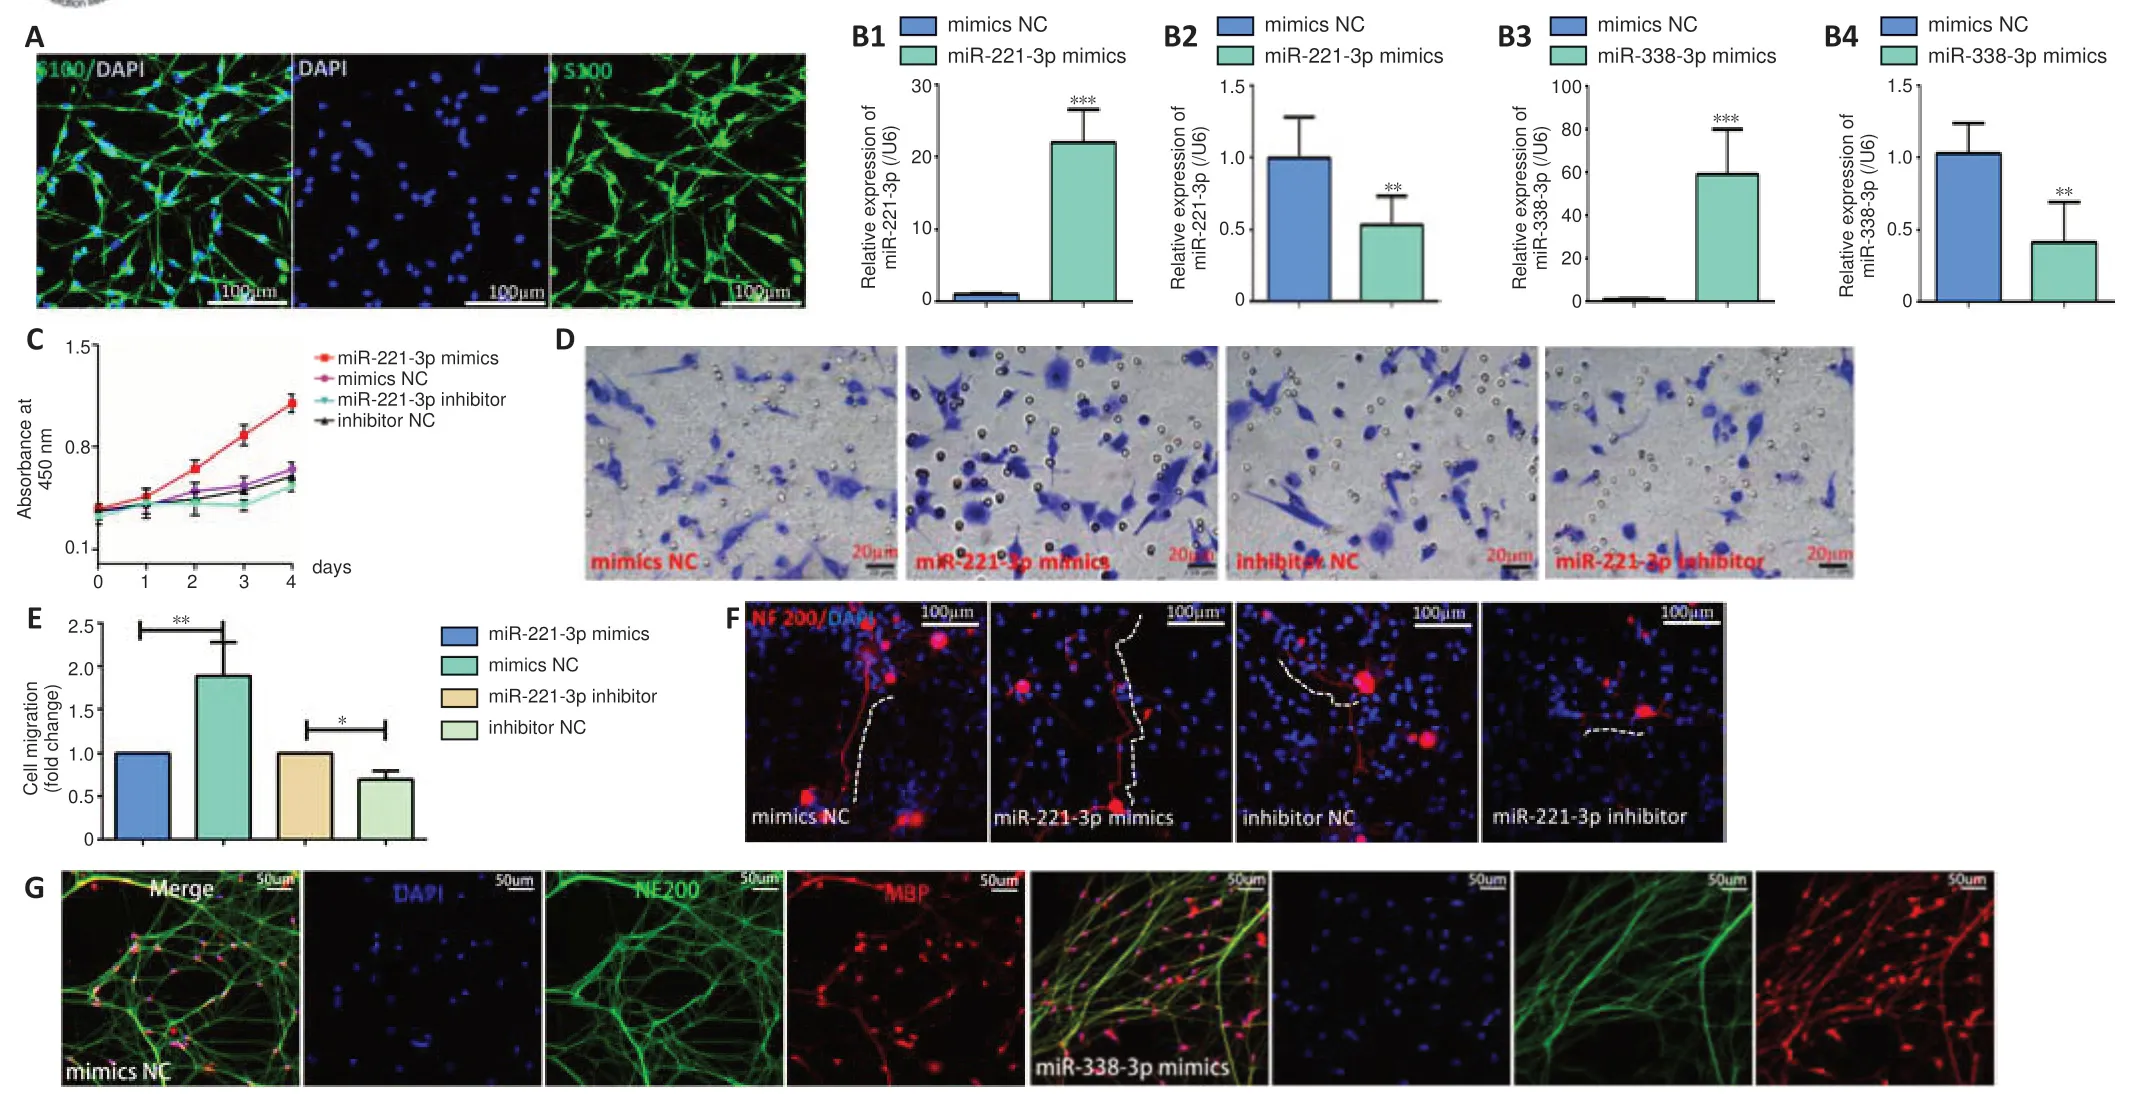
Figure 3 |miR-221-3p is involved in axonal elongation and the proliferation and migration of SCs in vitro, and miR-338-3p participates in the myelination of SCs in vitro.(A) Primary Schwann cells (SCs). (B1) The expression of miR-221-3p in SCs after transfection with miR-221-3p mimics or mimics NC was detected by qPCR (t(10) = ‒11.26, P < 0.0001). (B2) The expression of miR-221-3p in SCs after transfection with miR-221-3p inhibitor or inhibitor NC was detected by qPCR (t(10) = 3.261, P = 0.0086). (B3) The expression of miR-338-3p in SCs after transfection with miR-338-3p mimics or mimics NC was detected by qPCR (t(10) = ‒6.815, P < 0.0001). (B4) The expression of miR-338-3p in SCs after transfection with miR-338-3p inhibitor or inhibitor NC was detected by qPCR (t(10) = 4.272, P = 0.0016). (C) The proliferation of SCs was detected by CCK8 assay after transfection with miR-221-3p mimics, mimics NC, miR-221-3p inhibitor, and inhibitor NC, respectively. Data are represented as the mean ± SD. (D) Transwell migration assays of SCs after transfection with miR-221-3p mimics, mimics NC, miR-221-3p inhibitor, and inhibitor NC. Compared with the NC group, the miR-221-3p mimics group showed more migrating cells, while the miR-221-3p inhibitor group showed fewer migrating cells. (E) Migration rate of SCs after transfection with miR-221-3p mimics, mimics NC, miR-221-3p inhibitor, and inhibitor NC (t(4) = ‒3.897, P = 0.018, miR-221-3p mimics vs. mimics NC; t(4) = 5.196, P = 0.007, miR-221-3p inhibitor vs. inhibitor NC). Data are expressed the mean ± SD. The experiment was repeated three times. *P < 0.05, **P < 0.01, ***P < 0.001 (unpaired t-test). (F) Neurites of DRG neurons were co-cultured with SCs transfected with miR-221-3p mimics, mimics NC, miR-221-3p inhibitor, and inhibitor NC. White dotted line indicates the length of neurites. Compared with the NC group, the miR-221-3p mimics group showed longer neurites, while the miR-221-3p inhibitor group showed shorter neurites. (G) DRG neurons were co-cultured with SCs transfected with miR-338-3p mimics or mimics NC. Immunofluorescence intensity of myelin basic protein (MBP, red, Alexa Fluor® Plus 594) indicates the level of myelination. Figure 3G shows an increased fluorescence expression of MBP after miR-338-3p overexpression in SCs co-cultured with DRG neurons. Scale bars: 100 µm in A, F; 20 µm in D; 50 µm in G. DAPI: 2-(4-Amidinophenyl)-6-indolecarbamidine dihydrochloride; MBP: myelin basic protein; miR: miRNA; NC: negative control.
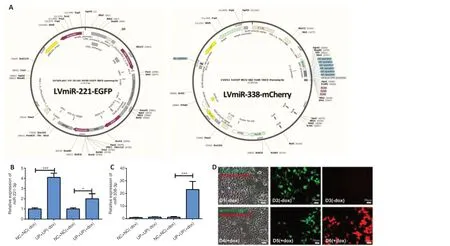
Figure 4 |Construction of the miR-221 lentivirus system and miR-338 Tet-on lentivirus system.(A) GV369 and CV051 vectors were used to construct lentivirus for miR-221and miR-338, respectively; the cloning site of GV369 was AgeI/NheI, and the cloning site of CV051 was AgeI/MluI. The expressions of miR-221-3p (B) (F(3, 11) = 58.86, P < 0.0001) and miR-338-3p (C) (F(3, 11) = 34.72, P < 0.0001) were detected by qPCR assay. The miR-221 lentivirus system (LVmiR-221-EGFP) and miR-338 Tet-on lentivirus system (LVmiR-338-mCherry) were co-transfected into 293T cells (UP + UP) with (+dox) or without (-dox) doxycycline-inducible; empty lentiviral GV369 vector and empty lentiviral CV051 vector were co-transfected to 293T cells (NC + NC) with (+dox) or without (-dox) doxycycline-inducible. Data represent the mean ± SD. All experiments were repeated three times. *P < 0.05, ***P < 0.001 (one-way analysis of variance followed by the Tukey’s post hoc test). (D) LVmiR-221-EGFP and LVmiR-338-mCherry were co-transfected to 293T cells; D1‒3 did not have doxycycline induction, D4‒6 had doxycycline induction. Green fluorescence was shown in both groups with or without doxycycline induction, while red fluorescence was observed only in the doxycycline inducible group. Green fluorescence indicates that LVmiR-221-EGFP infected 293T cells and expressed miR-221-3p; red fluorescence indicates that LV-miR-338-mCherry infected 293T cells and expressed miR-338 after doxycycline induction. Scale bars: 50 µm. ANOVA: Analysis of variance; dox: doxycycline; LV: lentivirus; NC+NC: the negative control of miR-221 lentivirus system and miR-338 Tet-on lentivirus system; UP+UP: miR-221 lentivirus system and miR-338 Tet-on lentivirus system.
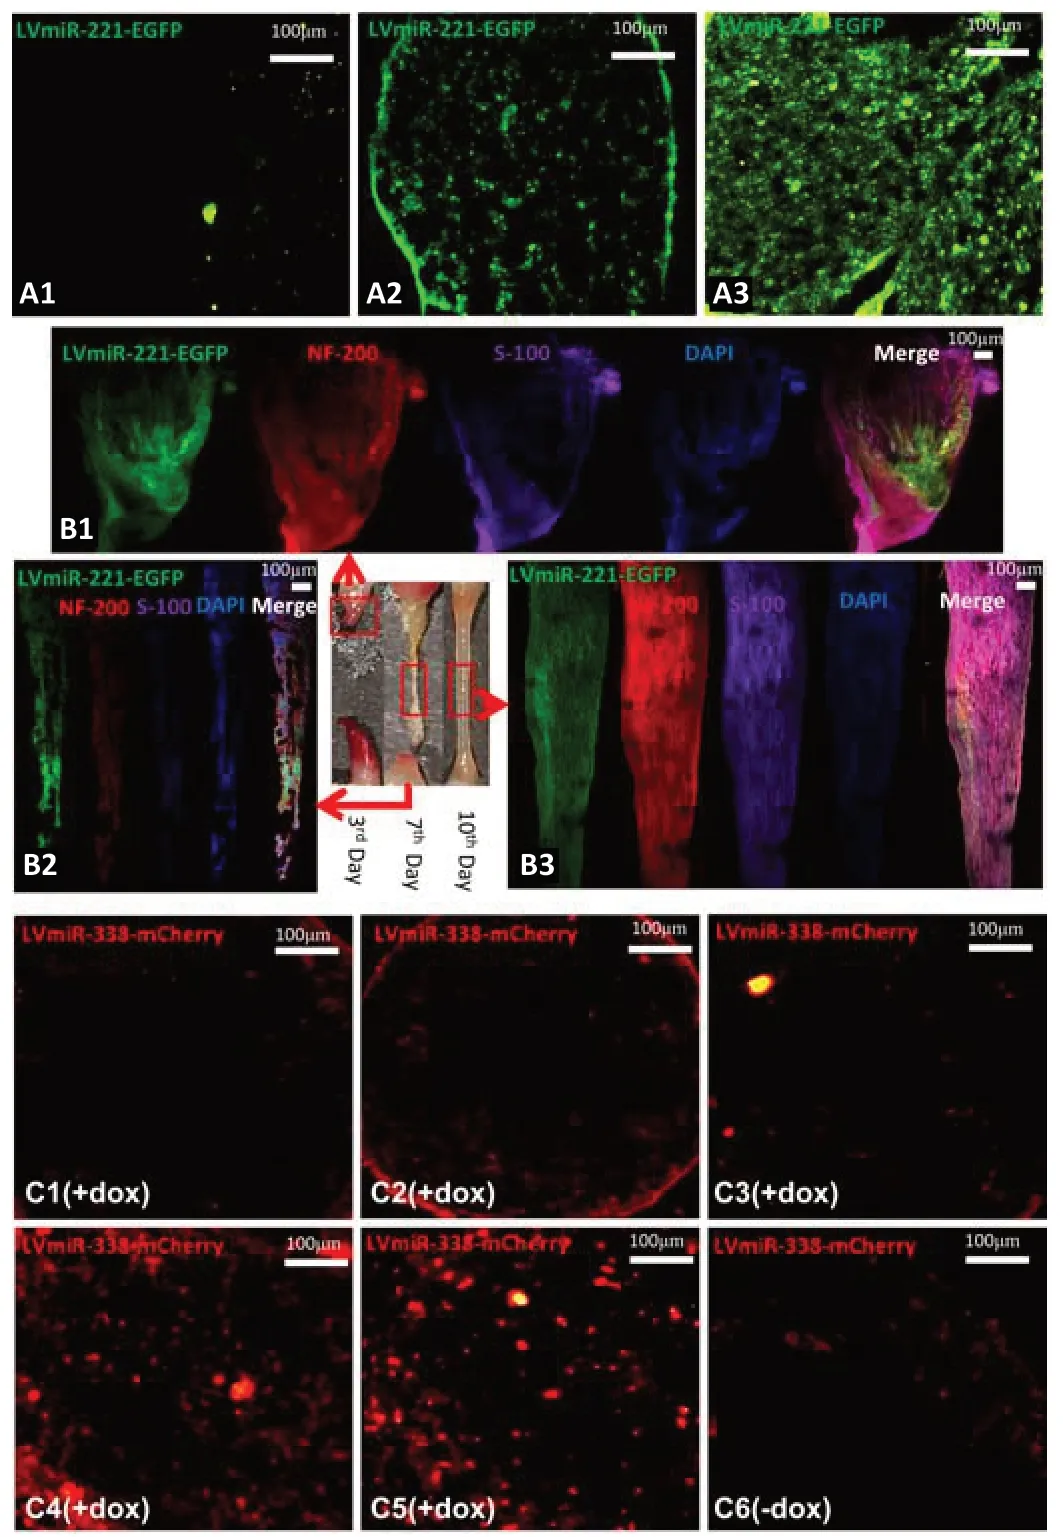
Figure 5 |The expression time of miR-221 lentivirus system and miR-338 Tet-on lentivirus system and the formation time of regenerated fiber bridge within nerve conduits in vivo. The miR-221 lentivirus system (LVmiR-221-EGFP) was injected in the nerve conduit bridging the nerve defect. (A) Confocal microscopy detected green color in transverse sections of distal nerve stumps at the 1st day (A1), 3rd day (A2), and 7th day (A3) after surgery. Green indicates the miR-221 lentivirus system infected nerve tissue and expressed miR-221-3p. Green fluorescence was observed in the 3rd day group and 7th day group. (B) Longitudinal sections of the regenerated nerves (red box) in nerve conduit (filled with saline containing miR-221 lentivirus) bridging the nerve defects were detected by immunofluorescence assay at the 3rd day (B1), 7th day (B2), and 10th day (B3) after surgery. A tissue cable in the nerve conduit between two nerve ends was observed in the 10th day group. Immunofluorescence for S100 (purple, Alexa Fluor® Plus 647) indicates SCs. Immunofluorescence for NF200 (red, Alexa Fluor® Plus 594) indicates neurite axons. (C) Confocal microscopy was used to observe transverse sections of the distal nerve stump after miR-338 Tet-on lentivirus (LVmiR-338-mCherry) was injected in the nerve conduit bridging the nerve defect with doxycycline induction at the 1st day (C1), 3rd day (C2), 5th day (C3), 7th day (C4), 9th day (C5), and without doxycycline-induction at 9th day (C6). Red fluorescence was only observed in the 7th day group and 9th day group. Red fluorescence indicates that LVmiR-338-mCherry was induced by doxycycline successfully and expressed miR-338-3p. Scale bars: 100 µm. ANOVA: Analysis of variance; DAPI: DAPI: 2-(4-amidinophenyl)-6-indolecarbamidine dihydrochloride; Dox: doxycycline; EGFP: enhanced green fluorescence protein; LV: lentivirus; miR: microRNA; NF200: neurofilament.
Sequential expression of miR-221-3p and miR-338-3p promotes nerve functional recovery
After determining the time-window for the sequential expression of miR-221-3p and miR-338-3pin vivo
, the treatment strategy of sequential regulation of miR-221-3p and miR-338-3p was carried out in sciatic nerve defect rats. The repair effect of this strategy on injured nerve function was evaluated 3 months after surgery. The indexes of SFI, conduction velocity of CMAP and muscle recovery rate were used to evaluate nerve functionality. SFI was obtained from footprint analysis assay, and conduction velocity of CMAP was obtained from electrophysiology tests.SFI in the sequential expression of miR-221-3p/miR-338-3p group (SEmiR-221/338) was lower than that in the autograft group (P
= 0.011), but higher than that in the other groups (P
= 0.26vs
. Co-miR-221/338,P
= 0.22vs
. miR-338,P
= 0.038vs
. miR-221,Figure 6A–C
).Conduction velocities of CMAP were determined by electrophysiology detection.Figure 6D
andE
show that the fastest conduction velocity was in the autograft group (P
= 0.01vs
. SE-miR-221/338) followed by the SEmiR-221/miR-338 group (P
= 0.01vs
. Co-miR-221/338,P
= 0.027vs
. miR-338,P
= 0.002vs
. miR-221), which were significantly higher than that of other groups.Because of the effects of nerves on muscles, the muscle recovery rate can partly reflect the level of functional recovery after nerve injury. Muscle recovery rates in the SE-miR-221/338 group and autograft group showed no significant difference (P =
0.973), but the rates were higher than those of other groups (P = 0.042vs
. Co-miR-221/338,P
= 0.012vs
. miR-338,P
= 0.012vs
. miR-221,Figure 6F
).
Figure 6 |The functional recovery of nerve at 3 months after operation.(A) Footprints left on the paper-lined walkway as the rat walked towards the paper end. (B) Footprints of rats in the nine groups: Autograft (B1), sequential expression of miR-221 and miR-338 (SE-miR-221/338, B2), Co-expression of miR-221 and miR-338 (ComiR-221/338, B3), miR-338 expression (miR-338, B4), miR-221 expression (miR-221, B5), two empty lentivirus vectors (GV369/CV051, B6), empty lentivirus CV051 vector (CV051, B7), empty lentivirus GV369 vector (GV369, B8), and saline group (Saline, B9). (B10) The measurement methods of three footprint parameters (PL, TS, ITS). (C) Sciatic functional index (SFI). “0” means normal function; “‒100” means complete loss of function (F(8, 89) = 27.719, P < 0.0001). (D) CMAPs of rats (the start site of single electrical pulse is marked with red arrows) in the Autograft (D1), SE-miR-221/338 (D2), Co-miR-221/338 (D3), miR-338 (D4), miR-221 (D5), GV369/CV051 (D6), CV051 (D7), GV369 (D8), and Saline (D9) groups. (E) Conduction velocities of CMAPs in the nine groups (F(8, 89) = 48.58, P < 0.0001). (F) Muscle recovery rate (mid-shank girth of experimental side/mid-shank girth of intact side) was used to evaluate nerve functionality in the nine groups (F(8, 89) = 29.86, P < 0.0001). All data are expressed as the mean ± SD (n = 10). *P < 0.05, **P < 0.01, ***P < 0.001, vs. SE-miR-221/338 group (one-way analysis of variance with Tukey’s post hoc tests). CMAP: Compound muscle action potential; Co: co-expression; ITS: the intermediate toe spread; miR: MicroRNA; PL: the print length; SE: sequential expression; TS: the toe spread.
These results suggest that sequential expression of miR-221-3p/miR-338-3pin vivo
promotes functional recovery after sciatic nerve transection.Sequential expression of miR-221-3p and miR-338-3p optimizes nerve
regeneration through orderly regulation of SC proliferation and myelination
Figure 7A
shows regenerated nerves in all groups at 3 months after operation. The diameter of the regenerated nerve in the SE-miR-221/338 group was smaller than that of the autograft group, but larger than those of other groups. A schematic diagram is shown inFigure 7B
for the sampling locations for detecting histomorphology and protein expression. Three months after surgery, toluidine blue staining and TEM (Figure 7C
) were performed to detect the myelination level of regenerated nerves in distal nerve stumps.Figure 7D
shows the density of myelinated axons analyzed from the toluidine blue staining, andFigure 7E
shows the area of myelin in each group analyzed from TEM. The highest density of myelinated axons (P
= 0.047 autograftvs
. SE-miR-221/338) and highest average area (P
= 0.027 autograftvs
. SEmiR-221/338) of myelin were found in the autograft group followed by the SEmiR-221/338 group; the results were significantly higher than those of other groups. These results indicate that sequential expression of miR-221-3p and miR-338-3p can optimize nerve regeneration through orderly regulation of SC proliferation and myelination.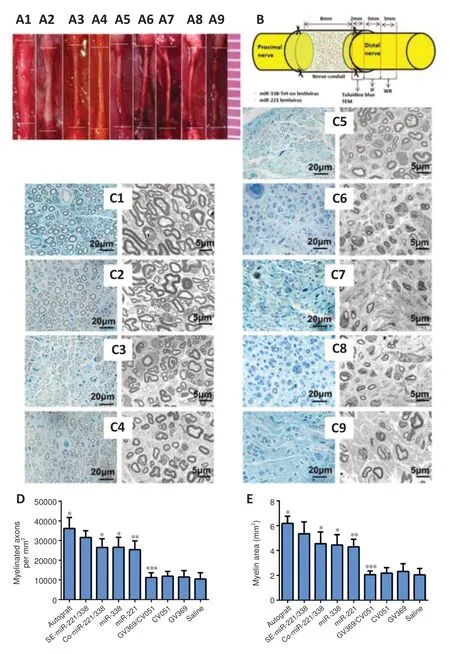
Figure 7 |Regenerated tissue cable contiguous with the sciatic nerve at the proximal and distal ends at 3 months post-surgery. (A) Representative regenerated tissue cable in the nine groups: Autograft (A1), SEmiR-221/338 (A2), Co-miR-221/338 (A3), miR-338 (A4), miR-221 (A5), GV369/CV051 (A6), CV051 (A7), GV369 (A8), and Saline (A9) groups. The diameter of the regenerated nerve in A2 is smaller than A1, but larger than that of other groups. (B) Schematic diagram of the sampling locations for toluidine blue staining, immunofluorescence assay (IF), transmission electron microscope (TEM), and western blot (WB). (C) Distal stumps of sciatic nerves were sectioned and observed with Toluidine blue staining and TEM in Autograft (C1), SE-miR-221/338, (C2), Co-miR-221/338 (C3), miR-338 (C4), miR-221 (C5), GV369/CV051 (C6), CV051 (C7), GV369 (C8), and Saline (C9) groups. Compared with axons in the other groups, myelinated axon in C1 and C2 groups was larger in diameter and increased in number. (D) Myelinated axon densities within the distal nerve stumps in the nine groups (F(8, 134) = 96.3, P < 0.0001). (E) Average myelin area within the distal nerve stumps in the nine groups (F(8, 134) = 81.06, P < 0.0001). Data are expressed as the mean ± SD (n = 15). *P < 0.05, **P < 0.01, ***P < 0.001, vs. SEmiR-221/338 group (one-way analysis of variance with Tukey’s post hoc tests). Co: Coexpression; IF: immunofluorescence assay; miR: microRNA; SE: sequential expression; TEM: transmission electron microscope; WB: western blot method.
Because there were no statistical differences in SFI, conduction velocities and muscle recovery rate among GV369/CV051, CV051, GV369, and Saline groups (P
> 0.05), we used only the GV369/CV051 group as the control group in subsequent analyses. Immunofluorescence and western blot were used to detect the expressions of NF 200, S100, and MBP in regenerated nerves (Figure 8
). The fluorescence intensity and protein level of NF200 in the SE-miR-221/338 group (P
= 0.028vs.
autograft group,P
= 0.030vs.
ComiR-221/338 group,P
= 0.049vs
. miR-338 group,P
= 0.007vs.
miR-221) were higher than those of other groups except the autograft group (Figure 8C
). There was no significant difference in NF200 protein level among the ComiR-221/338, miR-338, and miR-221 groups. The fluorescence intensities of S100 in the autograft and SE-miR-221/338 groups were stronger than those of other groups (Figure 8A
,B
andD
). S100 expression showed no difference between SE-miR-221/338 and autograft groups, but it was higher than other groups (P
= 0.023 SE-miR-221/338vs
. Co-miR-221/338,P
< 0.0001vs
. miR-338,P
= 0.01vs
. miR-221). S100 expression in the miR-338 group was lower than that in the Co-miR-221/338 group (P
= 0.019) and miR-221 group (P
= 0.042). MBP expressions in the SE-miR-221/338 group were higher than those of other groups except the autograft group (P
= 0.019vs
. autograft,P
= 0.012vs
. Co-miR-221/338,P
= 0.029vs.
miR-338,P
< 0.0001vs.
miR-221;Figure 8A–C
); the lowest protein level of MBP was in the miR-221 group (P
= 0.044 Co-miR-221/338vs
. miR-221,P
= 0.018 miR-338vs
. miR-221). These results show that the level of nerve regeneration and myelination in the SEmiR-221/338 group was closest to that of the autograft group and was better than that of other groups.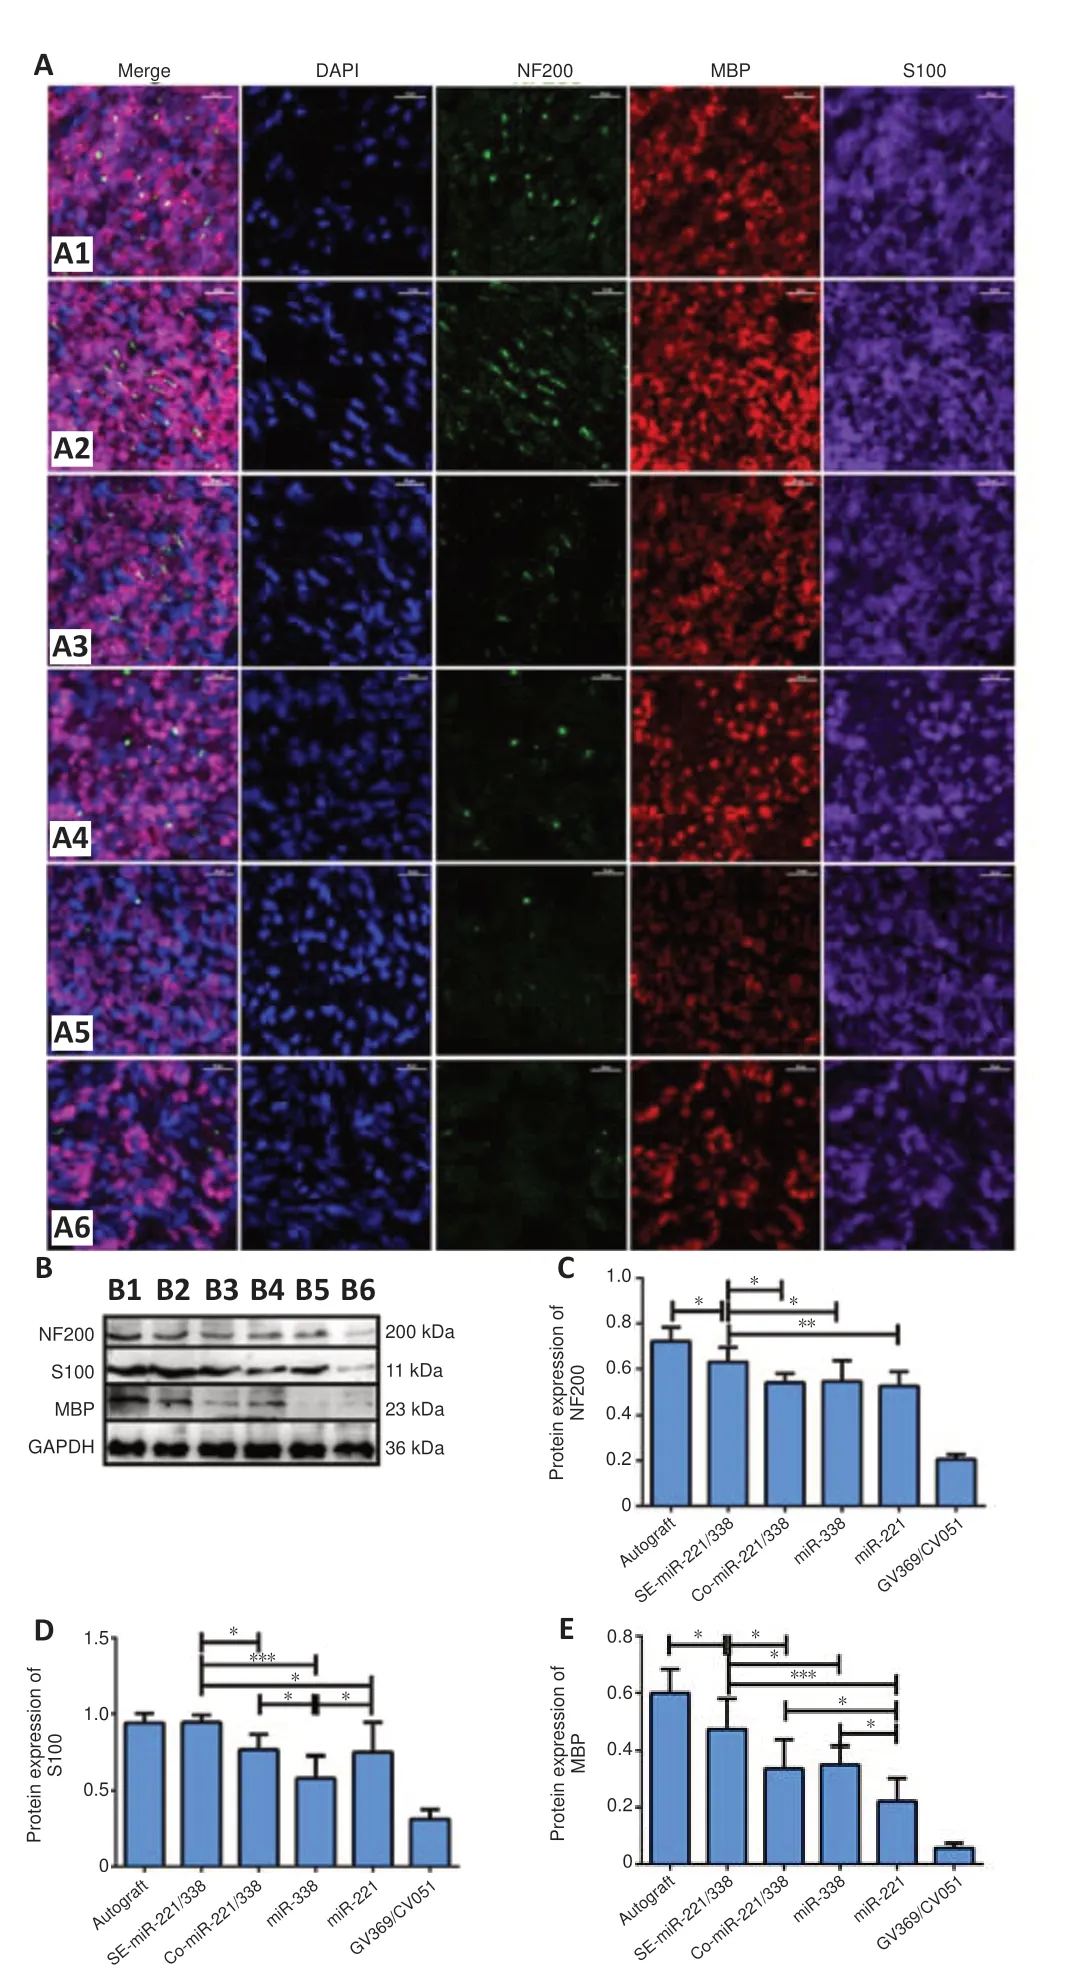
Figure 8 |Expression of marker proteins in regenerated nerves. (A) Immunofluorescence for NF200 (green, Alexa fluor Plus 488), MBP (red, Alexa fluor Plus 594), and S100 (purple, Alexa fluor Plus 647) in transverse sections of the distal nerve stumps in the six groups: Autograft (A1), SE-miR-221/338 (A2), Co-miR-221/338 (A3), miR-338 (A4), miR-221 (A5), and GV369/CV051 (A6) groups at 3 months postoperation. Nuclei were stained with DAPI (blue). The fluorescence expressions of NF200, MBP, and S100 were enhanced in A1 and A2 groups compared with those in other groups. Scale bars: 50 µm. (B‒E) Western blot assay was used to detect the protein expression of NF200 (C), S100 (D), and MBP (E) of the distal nerve stumps. B1‒6: Autograft (B1), SE-miR-221/338 (B2), Co-miR-221/338 (B3), miR-338 (B4), miR-221 (B5), and GV369/CV051 (B6) groups. NF200, F(5, 53) = 73.81, P < 0.0001; S100, F(5, 53) = 38.14, P < 0.0001; MBP, F(5, 53) = 49.04, P < 0.0001. Data are expressed as the mean ± SD (n = 9). *P < 0.05, **P < 0.01, ***P < 0.001 (one-way analysis of variance with Tukey’s post hoc tests). Co: Co-expression; DAPI: 2-(4-Amidinophenyl)-6-indolecarbamidine dihydrochloride; MBP: myelin basic protein; NF200: neurofilament; SE: sequential expression.
Identification of target genes of miR-221-3p and miR-338-3p
Our results demonstrate that sequential expression of miR-221-3p and miR-338-3pin vivo
enhanced the functional and structural recovery of injured nerves. miRNAs exert their biological functions through suppression of target genes. Therefore, nanopore re-sequencing technology and miRDB were used to screen the possible target genes of miR-221-3p and miR-338-3p (Figure 9
).DEG analysis results of the re-sequencing results identified 68 candidate genes targeted by miR-221-3p and 407 candidate genes targeted by miR-338-3p (Figure 9A–D
). The overlapping genes between the candidate genes with miRDB prediction target genes yielded two possible target genes of miR-221-3p (Cdkn1b
andDdit4
) and four possible target genes (Mtmr1
,Rfc1
,Nrp1
andS100a16
) of miR-338-3p (Figure 9C–F
).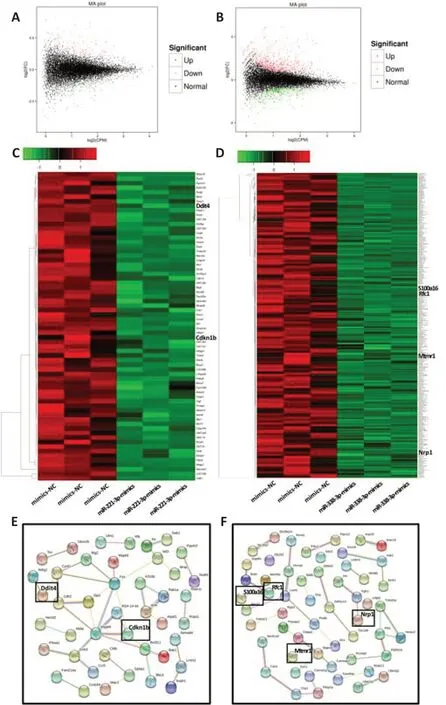
Figure 9 |Nanopore whole transcriptome re-sequencing and miRDB were used to screen possible target genes of miR-221-3p and miR-338-3p. (A) Nanopore whole transcriptome re-sequencing was used to detect the altered genes in SCs after transfection with miR-221-3p mimics, miR-338-3p mimics, and mimics NC. The MA plot (M-versus-A plot) of genes of SCs after transfection with miR-221-3p mimics and mimics NC (red points are up-regulated genes, and green points are down-regulated genes after overexpression of miR-221-3p). (B) The MA plot of genes of SCs after transfection with miR-338-3p mimics and mimics NC (red point are up-regulated genes, and green points are down-regulated genes after overexpression of miR-338-3p). (C, D) Heat maps and clustering from nanopore sequencing showing all down-regulated genes after overexpression of miR-221-3p (C) and miR-338-3p (D). (E) Predicted target proteinprotein interaction network map of miR-221-3p through miRDB database and STRING software analysis. Two target candidate genes of miR-221-3p (in the black box) were obtained by cross analyzing the results of nanopore sequencing and miRDB software prediction. (F) Predicted target protein-protein interaction network map of miR-338-3p through miRDB database and STRING software analysis. Four target candidate genes of miR-338-3p (in the black box) were obtained by cross analyzing the results of nanopore gene sequencing and miRDB software prediction. A: Add; M: minus; miR: microRNA; miRDB: microRNA target prediction database; SCs: Schwann cells.
qPCR and western blot showed that the mRNA and protein expression of Cdkn1b and Nrp1 were decreased in cells transfected with miR-221-3p and miR-338-3p mimics and increased in cells expressing inhibitors (Cdkn1b
mRNA:P
= 0.015 mimics NCvs
. miR-221-3p mimics,P
< 0.0001 inhibitor NCvs
. miR-221-3p inhibitor;Nrp1
mRNA:P
= 0.0012 mimics NCvs
. miR-338-3p mimics,P
< 0.001 inhibitor NCvs
. miR-338-3p inhibitor; Cdkn1b protein:P
= 0.0011 mimics NCvs
. miR-221-3p mimics,P
= 0.0212 inhibitor NCvs
. miR-221-3p inhibitor; Nrp1 protein:P
= 0.0014 mimics NCvs
. miR-338-3p mimics,P
= 0.0088 inhibitor NCvs.
miR-338-3p inhibitor;Figure 10A–D
). To confirm thatCdkn1b
andNrp1
genes are valid target genes of miR-221-3p and miR-338-3p, dual luciferase assays were performed (Figure 10E–G
). Upregulation of miR-221-3p decreased the luciferase activity of the vector harboring the Cdkn1b UTR (P
= 0.016;Figure 10F
), and miR-338-3p upregulation decreased the luciferase activity of the vector harboring the Nrp1 UTR (P
= 0.046;Figure 10G
). Mutation of the miRNA binding sequence in the reporter vector abolished these effects.Suppression of Cdkn1b reverses the inhibitory effects of miR-221-3p inhibitor on proliferation and migration of SCs
To determine whetherCdkn1b
participates in miR-221-3p regulation of proliferation and migration of SCs, miR-221-3p inhibitor was transfected into SCs with siRNACdkn1b
or siRNA NC. CCK8 and Transwell assays showed that suppression ofCdkn1b
significantly promoted proliferation and migration of SCs transfected with miR-221-3p inhibitor (Figure 11A–C
).Suppression of Nrp1 reverses the inhibitory effects of miR-338-3p inhibitor on myelination of SCs
miR-338-3p inhibitor was transfected into SCs with siRNANrp1
or siRNA NC to determine whetherNrp1
participates in miR-221-3p regulation of myelination of SCs. Immunofluorescence assay showed that suppression ofNrp1
by siRNA significantly promoted myelination of SCs transfected with miR-338-3p inhibitor co-cultured with DRG neurons (Figure 11D
).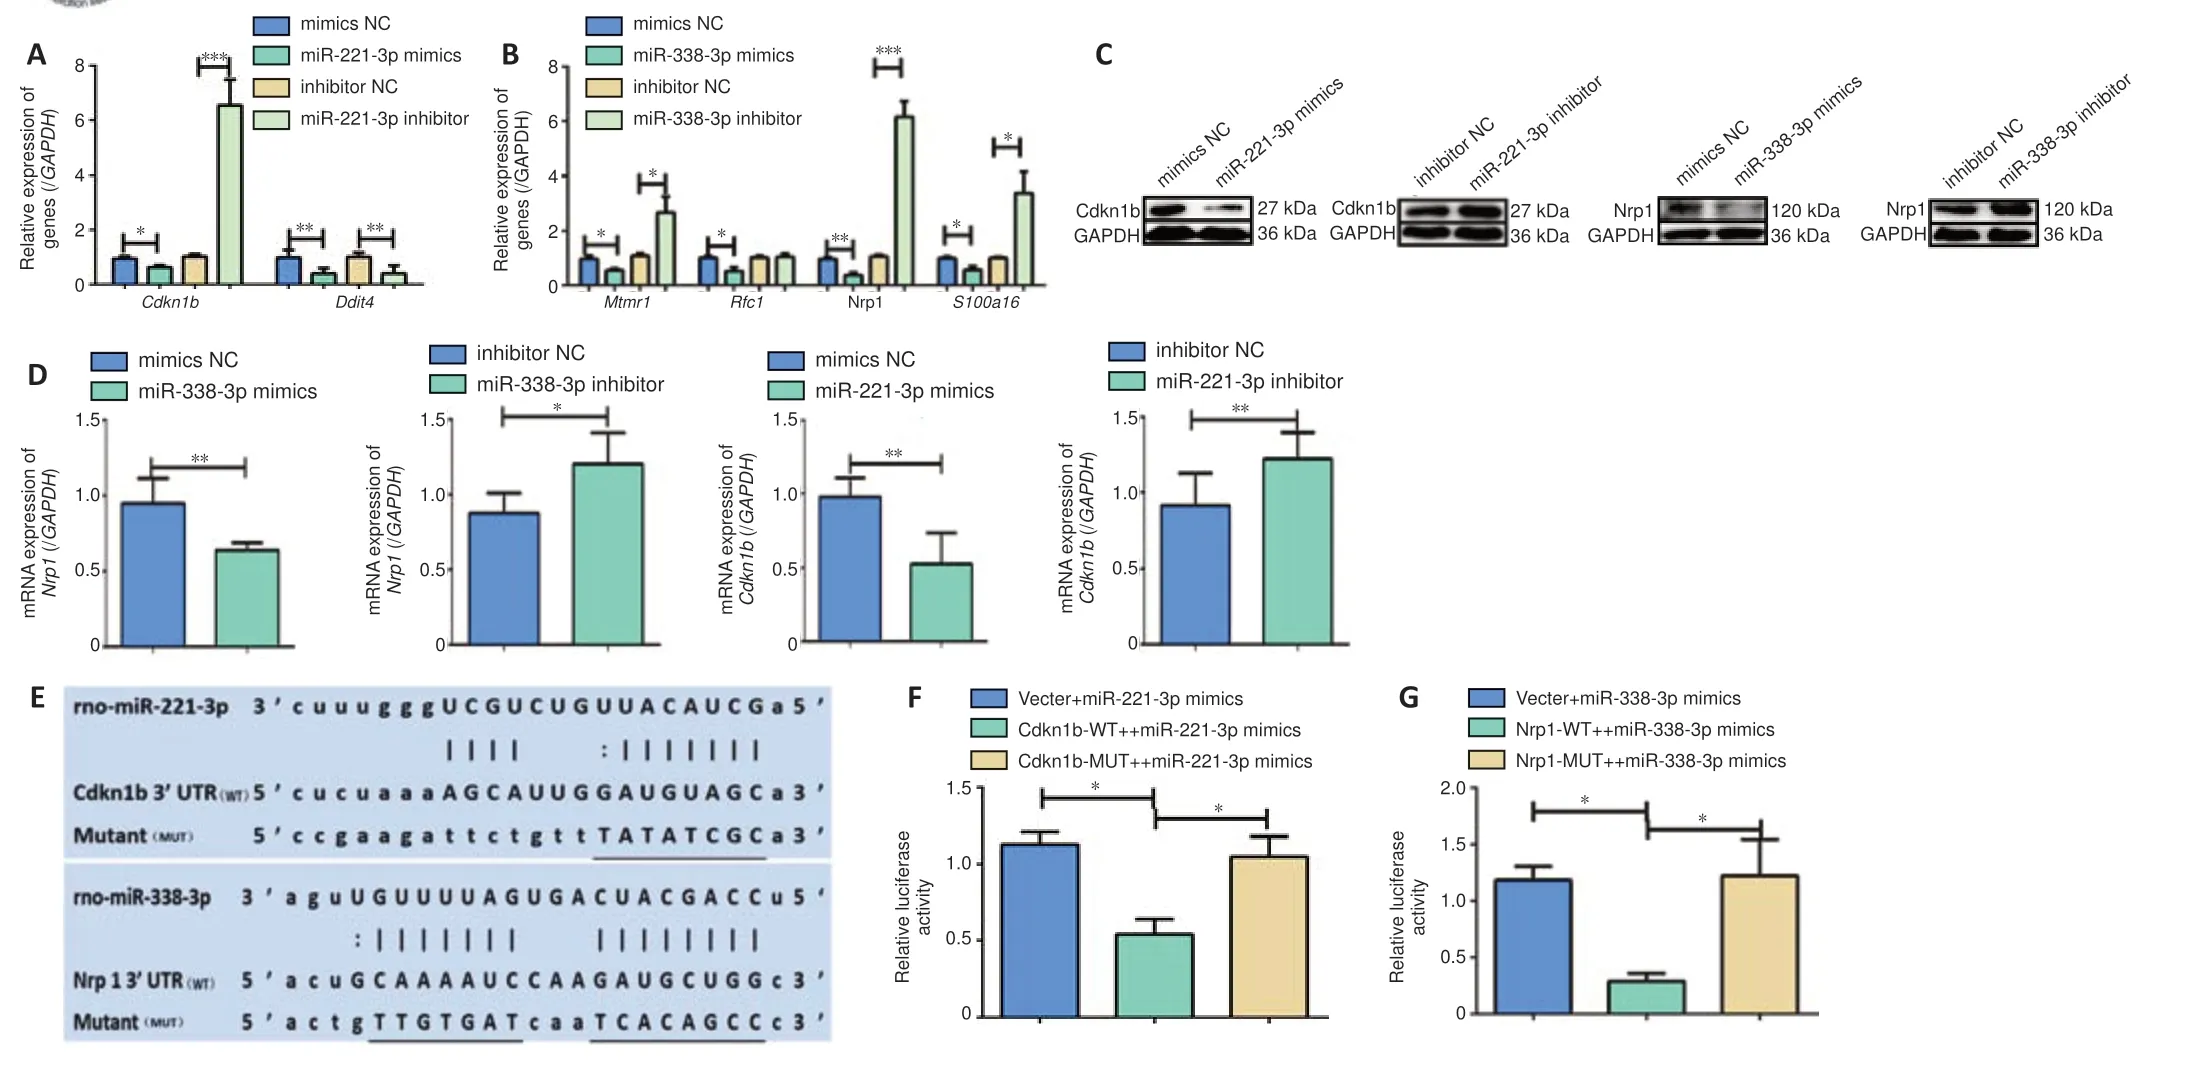
Figure 10 |The target genes of miR-221-3p and miR-338-3p were confirmed by qPCR and double luciferase gene reporter assay. (A) The relative expression of Cdnk1b and Ddit4 mRNAs in SCs transfected with miR-221-3p mimics, mimics NC, miR-221-3p inhibitor, and inhibitor NC. (B) The relative expression of Mtmr1, Rfc1, Nrp1 and S100a16 in SCs after transfection with miR-338-3p mimics, mimics NC, miR-338-3p inhibitor, and inhibitor NC. (C) The protein levels of Cdkn1b and Nrp1 in SCs are shown. (D) Quantitative analysis of Cdkn1b and Nrp1 mRNAs. (E) The sequences of the wild-type (WT) or mutant (MUT) p-Luc-UTR vectors. The miRNA binding sites underlined. (F) The relative luciferase activity was analyzed after co-transfecting the p-Luc-UTR vectors into 293T cells with miR-221-3p mimics (F(2, 8) = 9.506, P = 0.0138). (G) The relative luciferase activity was analyzed after co-transfecting the p-Luc-UTR vectors into 293T cells with miR-338-3p mimics (F(2, 8) = 6.849, P = 0.0283). Data are expressed as the mean ± SD (n = 3). *P < 0.05, **P < 0.01, ***P < 0.001 (Student’s t-test (A, B, D), or one-way analysis of variance with Tukey’s post hoc test (F, G)). Cdkn1b: Cyclin dependent kinase inhibitor 1B; Ddit4: DNA damage inducible transcript 4; GAPDH: glyceraldehyde-3-phosphate dehydrogenase; miR: miRNA; mtmr1: myotubularin related protein 1; MUT: mutant; NC: negative control; Nrp1: neuropilin 1; Rfc1: replication factor C subunit 1; s100a16: S100 calcium binding protein A16; WT: wild-type.

Figure 11 |Suppression of Cdkn1b reverses the inhibitory effects of miR-221-3p inhibitor on proliferation and migration of SCs and suppression of Nrp1 reverses the inhibitory effects of miR-338-3p inhibitor on myelination of SCs. (A) CCK8 assay was used to detect the proliferation of SCs after co-transfection of miR-221-3p inhibitor with siRNA Cdkn1b or siRNA NC. Data represent the means ± SD. (B) Transwell assay was used to detect the migration of SCs after co-transfection with miR-221-3p inhibitor with siRNA Cdkn1b or siRNA NC. (C) Quantitative analysis of migration rate of SCs after co-transfected miR-221-3p inhibitor with siRNA Cdkn1b or siRNA NC (t(4) = ‒5.196, P = 0.007). Data are expressed as the mean ± SD. The experiment was repeated three times. **P < 0.01 (Student’s t-test). (D) DRG neurons were co-cultured with SCs co-transfected miR-338-3p inhibitor with siRNA Nrp1 or siRNA NC. Compared with MBP expression in the siRNA NC group MBP expression in siRNA Nrp1 group is enhanced. Immunofluorescence of MBP indicates the level of myelination. Cdkn1b: Cyclin dependent kinase inhibitor 1B; DAPI: 2-(4-amidinophenyl)-6-indolecarbamidine dihydrochloride; DRG: dorsal root ganglion; MBP: myelin basic protein; miR: miRNA; NC: negative control; NF200: neurofilament; siRNA: silencing RNA.
Discussion
SCs play key roles during regeneration and repair process after peripheral nerve injury (Chernousov et al., 2008; Dubový, 2011). Endogenous SCs may be an important target for therapeutic intervention because of their different functionalities in different stages of nerve repair: proliferation and migration in the early stage and myelination in the later stage. Some researchers explored growth factors to promote nerve recovery through interfering with SC functions (Thomas, 1948; Hardy et al., 1992; Ribeiro-Resende et al., 2012; Qin et al., 2016), while others used exosomes to promote nerve regeneration by optimizing SC function (Chen et al., 2019; Rao et al., 2019; Liu et al., 2022). However, most previous studies (Oudega et al., 2005; Song et al., 2017; Li et al., 2022) have focused on strategies to promote SC proliferation and did not address myelinization of SCs in the later stages of nerve repair. The present study considered both the proliferation and myelination of SCs after nerve injury and strived to maximize their effects on nerve regeneration.
From the functionalities of miR-221-3p and miR-338-3p in nerve regeneration, we proposed a new therapeutic strategy for nerve injury treatment by addressing the properties of SCs through sequential expression of miR-221-3p and miR-338-3p. We constructed a miR-221 and miR-338 Tet-on lentivirus system to precisely control the expression of miR-221-3p and miR-338-3p through doxycycline-administrationin vitro
andin vivo
. Myelination, enhanced by miR-338-3p, should occur after SC proliferation and migration (Howe et al., 2017), so a time-window for miR-338-3p initiation should be sought. Formation of nerve fiber cable in nerve conduits requires rapid proliferation and migration of SCs from two nerve ends, so early expression of miR-221-3p is required to promote the proliferation and migration of SCs. Our results revealed that formation of a cable in the 8 mm nerve gap requires approximately 10 days. To promote formation of myelin sheaths around regenerated axons, miR-338-3p should be expressed after cable formation. We confirmed miR-338-3p expression on day 7 after rats were given doxycycline-containing water. Therefore, we provided rats with doxycyclinecontaining water on the 3day after operation. Ourin vitro
andin vivo
results confirm the construction of a sequential miR-221-3p and miR-338-3p expression strategy in a rat model of sciatic nerve injury.Nerve function evaluation is a direct method to judge the repairing effects of sequential regulation strategy of miR-221-3p/miR-338-3p after peripheral nerve injury. SFI, electrophysiology, and muscle recovery rate were used to evaluate nerve functionalities in this study. SFI was obtained through footprint assays. The self-injurious behavior of rats is likely to occur in the loss of innervation of their hind limbs (Zellem et al., 1989; Ao et al., 2011), which may lead to toe loss and result in invalid SFI values, so incomplete footprints were excluded in SFI analysis. Previous studies used the net weight of the gastrocnemius muscle to evaluate the muscle recovery rate, but obtaining the gastrocnemius muscle accurately and completely is time-consuming and laborious. We used a simpler and more efficient method in measuring the circumference of the middle leg. In the evaluation of electrophysiology, some researchers also adopted the amplitude of CMAPs as an evaluation index (Chen et al., 2007; Jiao et al., 2009). Considering that the amplitude of CMAP is affected by the insertion location and depth of the electrode, this index was not used for electrophysiological assessments. The functional recovery of injured sciatic nerve in SE-miR-221/338 group was closest to that in the autologous group and better than other groups, which suggested that the sequential regulation treatment strategy effectively promoted the functional recovery of injured nerves.
Axon density reflects the intensity of CMAP, and the thickness of the myelin sheath reflects the conduction velocity of CMAP (Matsumoto et al., 2000). Previous studies measured thickness of myelin sheaths to evaluate nerve regeneration at the histomorphology level, but myelin sheaths in each image are of different sizes, and it is difficult to measure the thickness of all myelin sheaths. Therefore, we used the percentage of myelin sheath stain to evaluate the regeneration of myelinated nerve fibers, which included all different sizes of myelinated nerve fibers. Our results showed that SE-miR-221/338 enhanced the intensity and area of myelinated nerve fibers, which is the structural basis of functional recovery of injured nerves, and results in a fast conduction velocity of CMAP and high muscle recovery rate.
The expressions of NF200, an axon marker, and S100 and MBP, marker proteins of SCs and myelin (Gupta, 1987; Matsumoto et al., 2000), reflect nerve regeneration. The amount of myelinated nerve fibers in the SEmiR-221/miR-338 group 3 months after operation was closest to that of the autograft group and was much higher than other groups. A higher expression of S100, NF200, and MBP was also observed. In the early stage of nerve repair, miR-221-3p promotes SC proliferation and migration, and the formation of Büngner band supports neurite outgrowth, which was reflected in the high S100 and NF200 expressions of the SE-miR-221/338 group. In the late stage of nerve repair, miR-338-3p promotes SCs to form myelin sheaths around the regenerated nerves, which may explain the high MBP level in SEmiR-221/338 group and determines the conduction velocity of CMAPs and functional recovery. These findings highlight the efficacy of the therapeutic strategy of SE-miR-221/338 in the treatment of peripheral nerve injury.
miRNAs affect cellular and biological functions through suppression of target genes. Nanopore whole transcriptome re-sequencing and miRDB were used to screen possible target genes, and qPCR, western blot, and luciferase assays were used for validation. Our results identifiedCdkn1b
andNrp1
as candidate target genes of miR-221-3p and miR-338-3p, respectively. Suppression of Cdkn1b reversed the inhibitory effects of miR-221-3p inhibitor on proliferation and migration of SCs, and suppression of Nrp1 reversed the effect of miR-338-3p inhibitor on SC myelination. The mechanism by which miR-221-3p and miR-338-3p promotes the regeneration of myelinated nerve fibers through the target genesCdkn1b
orNrp1
is unknown. Cdkn1b gene encodes the Cdkn1b protein (p27kip1), which is a key regulator of the cell cycle in eukaryotes. The N-terminal of p27kip binds with specific Cdk/cyclins complexes to promote cell cycle exit, resulting in inhibition of cell proliferation. The increased miR-221-3p downregulatesCdkn1b
mRNA expression, which promotes SC proliferation. Nrp1 regulates the spontaneous remyelinating capacity through activating the Nrp1/Sema3A signaling pathway (Binamé et al., 2019), which maybe a potential mechanism of miR-338-3p in promoting myelination of regenerated nerves.In this study, we preliminarily explored a novel two-pronged nerve repair approach with important therapeutic implications. However, there are some limitations in the study. First, the novel approach should be explored in more nerve injury models, animal species and female animals. Second, only the most likely target genes of miR-221-3p and miR-338-3p were verified; additional target genes and more in-depth mechanism of miRNA should be studied.
In conclusion, here we demonstrated that the sequential overexpression of miR-221-3p/miR-338-3p in endogenous SCs significantly promoted nerve regeneration and functional recovery after sciatic nerve transection in rats (please refer to the animation for the process of nerve regeneration). miR-221-3p may promote the proliferation and migration of SCs through downregulation ofCdkn1b
, and miR-338-3p may promote the myelination of SCs through silencingNrp1
. This is the first study to consider both the proliferation and myelination of SCs after nerve injury with the aim of maximize their effects on nerve regeneration. Our system represents a potential new approach for the treatment of peripheral nerve injury.Acknowledgments:
We thank technician Dong-Juan Liu from China Medical University for technical guidance of electron microscope. We also thank Dr. Wei-Jian Hou from China Medical University for assistance in the course of the experiments.
Author contributions:
QA and LLW conceived and designed the study. LLW, THY, YZM, XYM, TRA, RJ, HT, AM, and QA implemented the experiments. LLW and QA analyzed the data and wrote the manuscript. RJ proofread the manuscript. All authors approved the final version of this manuscript.
Conflicts of interest:
The authors declare that they have no competing interests.
Availability of data and materials:
The raw sequence data used for analysis is available in NCBI under the Sequencce Read Archive (SRA) with the BioProject PRJNA767931. All data generated or analyzed during this study are included in this published article and its supplementary information files.
Open access statement:
This is an open access journal, and articles are distributed under the terms of the Creative Commons AttributionNonCommercial-ShareAlike 4.0 License, which allows others to remix, tweak, and build upon the work non-commercially, as long as appropriate credit is given and the new creations are licensed under the identical terms.
Open peer reviewer:
Bin Yu, Nantong University, China.
Additional file:
Open peer review report 1.
- 中国神经再生研究(英文版)的其它文章
- Inflammation and retinal degenerative diseases
- Synaptic alterations as a common phase in neurological and neurodevelopmental diseases: JNK is a key mediator in synaptic changes
- Brain-derived neurotrophic factor in main neurodegenerative diseases
- The best of both worlds: mastering nerve regeneration combining biological and nanotechnological tools
- Exosomal miR-23b from bone marrow mesenchymal stem cells alleviates oxidative stress and pyroptosis after intracerebral hemorrhage
- Chlorogenic acid alleviates hypoxic-ischemic brain injury in neonatal mice

