Chronic spinal cord compression associated with intervertebral disc degeneration in SPARC-null mice
Zhuo-Yao Li , Ai-Fang Zhou , Gan Li Long-Yun Zhou, Pei-Min Pu Ke Zhu Zhong Zheng Yong-Jun Wang Qian-Qian Liang , Min Yao , Xue-Jun Cui
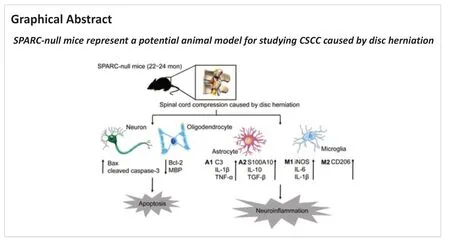
Abstract Chronic spinal cord compression (CSCC) is induced by disc herniation and other reasons, leading to movement and sensation dysfunction, with a serious impact on quality of life. Spontaneous disc herniation rarely occurs in rodents, and therefore establishing a chronic spinal cord compression (CSCC) animal model is of crucial importance to explore the pathogenesis and treatment of CSCC. The absence of secreted protein, acidic, and rich in cysteine (SPARC) leads to spontaneous intervertebral disc degeneration in mice, which resembles human disc degeneration. In this study, we evaluated whether SPARC-null mice may serve as an animal model for CSCC. We performed rod rotation test, pain threshold test, gait analysis, and Basso Mouse Scale score. Our results showed that the motor function of SPARC-null mice was weakened, and magnetic resonance images revealed compression at different spinal cord levels, particularly in the lumbar segments. Immunofluorescence staining and western blot assay showed that the absence of SPARC induced apoptosis of neurons and oligodendrocytes, activation of microglia/macrophages with M1/M2 phenotype and astrocytes with A1/A2 phenotype; it also activated the expression of the NOD-like receptor protein 3 inflammasome and inhibited brain-derived neurotrophic factor/tyrosine kinase B signaling pathway. Notably, these findings are characteristics of CSCC. Therefore, we propose that SPARC-null mice may be an animal model for studying CSCC caused by disc herniation.
Key Words: apoptosis; astrocytes; chronic spinal cord compression; disc degeneration; disc herniation; macrophages; microglia; neuroinflammation; neurons; NOD-like receptor protein 3 inflammasomes; secreted protein, acidic, and rich in cysteine
Introduction 634 Methods 635 Results 636 Discussion 640
Introduction
Chronic spinal cord compression (CSCC) is a serious type of spinal impairment (Sun et al., 2017; Tu et al., 2021). Degenerative CSCC injuries account for 54% of non-traumatic spinal cord compression injuries in North America, 18‒26% in Australia, 29‒59% in Asia, and 16‒51% in Europe (Bradshaw and Sage, 2001; Vervoordeldonk et al., 2013; New et al., 2014; Ge et al., 2018; Niemi-Nikkola et al., 2021; Lee et al., 2022). Space-occupying changes in the spinal canal, such as intervertebral disc herniation and posterior longitudinal ligament ossification, lead to degenerative spinal cord changes and vertebral degeneration in patients with CSCC (Tatsui et al., 2016; Cui et al., 2021; Wang et al., 2021; Bacova et al., 2022). CSCC can result in various degrees of movement and sensation dysfunction; for example, cauda equina syndrome is observed in patients with lumbar CSCC, while fine motor impairment of the hand may occur patients with cervical CSCC. These conditions seriously affect the patient’s life and ability to work (Ocal et al., 2019). Therefore, better understanding of the mechanisms underlying CSCC is critical to establish therapeutic methods for this syndrome.
Establishing an animal CSCC model for CSCC studies remains challenging. The etiology of intervertebral disc degeneration is different in rats and mice compared with humans the spine of rats and mice is in a non-upright position and intervertebral disc stress is different; therefore spontaneous disc degeneration cannot be induced (Jin et al., 2018). Moreover, the application of forces, such as external compression, can destroy the structure of the spinal cord and vertebral body and is not consistent with the pathological conditions of CSCC (Hosoda et al., 1981). Therefore, establishing a mammalian model that reproduces the clinical features of progressive CSCC is critical for research in CSCC.
Secreted protein, acidic and rich in cysteine (SPARC), also known as osteonectin and basement membrane-40, is a protein that regulates the extracellular matrix and is involved in tissue reconstruction, cell migration, and proliferation (Bradshaw and Sage, 2001; Tajerian et al., 2012; Riley and Bradshaw, 2020). The absence of SPARC in mice leads to premature spontaneous age-dependent intervertebral disc degeneration, which resembles human disc degeneration (Gruber et al., 2005; Tajerian et al., 2011; Miyagi et al., 2014; Millecamps et al., 2015). SPARC-null mice showed signs of degenerative disc degeneration 2 months after birth, and extensive disc degeneration was observed 2 years after birth (Krock et al., 2018). Notably, the degree of intervertebral disc degeneration in this model correlated with behavioral and motor signs of chronic low back pain in humans (Millecamps et al., 2015). In addition, SPARC-null mice showed increased stiffness and decreased neutral zone length in intervertebral discs compared with controls, possibly because of disc degeneration (Whittal et al., 2021). Previous studies using the SPARC-null mouse model have focused on diseases related to disc degeneration, such as low back pain and disc herniation (Millecamps et al., 2011; Krock et al., 2019). Because of the unique pathologic process of the SPARC-null mice, in this study, we evaluated whether this model might be a suitable animal model for investigating CSCC.
Methods
Animals
SPARC-null mice (Cat# C57BL/6-Sparcem1Smoc; RRID: NM-KO-225002) were purchased from the Shanghai Research Center of the Southern Model Organisms (license No. SCXK (Hu) 2017-0010). Male and female SPARCnull (22‒24 months,n
= 11) and mated wild-type (WT) mice (born in the same litter,n
= 10) were used in this study (Table 1
). Animals were housed in an environment with a temperature of 22 ± 1°C, relative humidity of 50 ± 1%, and a light/dark cycle of 12/12-hour and were given water and food ad libitum. All animal studies (including the animal euthanasia procedure) were performed in compliance with the regulations and guidelines of the Animal Welfare Ethics Committee of Shanghai University of Traditional Chinese Medicine following the Association for Assessment and Accreditation of Laboratory Animal Care and the Institutional Animal Care and Use Committee guidelines (approval No. PZSHUTCM210820015, approved on September 2, 2021). A schematic illustration of the experiments is shown inFigure 1
.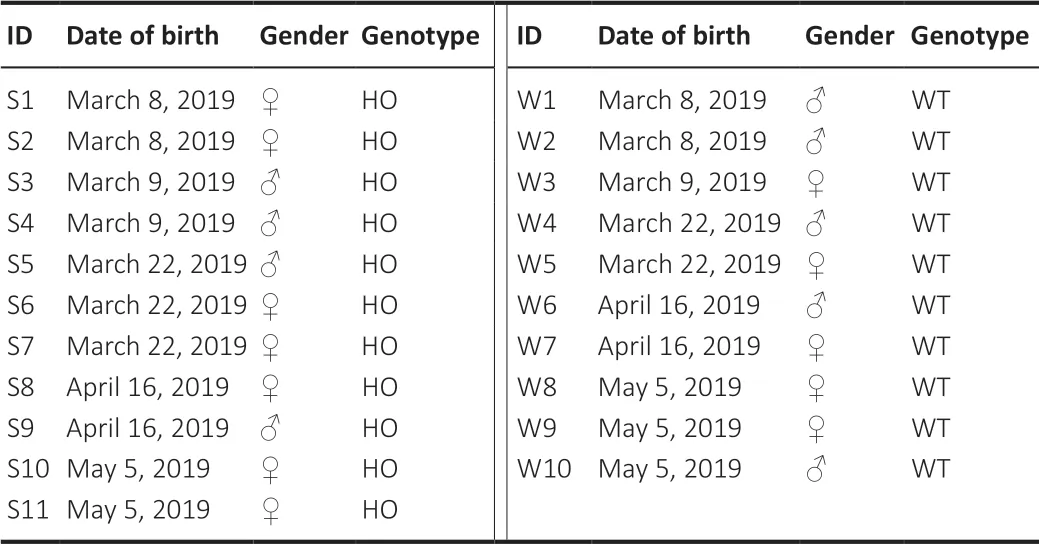
Table 1 |Details of the mice used in this study
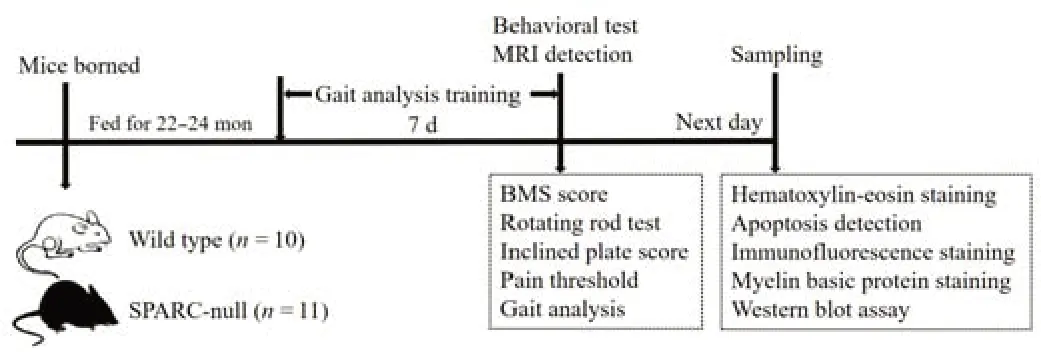
Figure 1 |A schematic for the experimental analyses. BMS: Basso Mouse Scale; MRI: magnetic resonance imaging; SPARC: secreted protein, acidic and rich in cysteine.
Behavioral assessment
Behavioral tests included a rotating rod test, inclined plate score, heat pain threshold test, Basso Mouse Scale (BMS) score, and gait analysis. All behavioral tests were performed by investigators blinded to the animal genotype.
Rotating rod test
The rotating rod test was performed using a rotating machine (LE8205, Panlab, Madrid, Spain). The test measures riding time or endurance and is based on a rotating rod with forced motor activity being applied by a mouse or rodent. Briefly, mice were placed on the rotating rod; when they fell on the lever, the timer was stopped, and an evaluator read the parameters. Each mouse was tested five times, and the maximum value was recorded (Deacon, 2013).
Inclined plate test
The inclined plate test was developed to evaluate the mouse’s muscle strength and overall balance (Rivlin and Tator, 1977). The mice were placed on a rubber plate with an adjustable angle; the angle of the inclined plate was gradually raised every 5° to record the maximum angle at which the mice could keep their body from sliding for 5 seconds.
Heat pain threshold test
The heat pain threshold was tested on a hot plate (55370, Ugo Basile, Milan, Italy). The mice were placed on a metal net covered with a plexiglass box; after 2 hours of adaptation, the test was started, and mice were placed on a special heat conduction plate and covered with a transparent plastic box. An infrared light source was placed under the skin in the middle of the left hind paw, and the glass plate was heated. The duration of time until the mouse licked or moved their hind paws was automatically recorded by the instrument. The test was performed three times for each mouse, and the average value was taken as the pain threshold for each time (Dyck et al., 1996).
BMS score
The BMS score consists of the main and sub scores and is a highly sensitive and reliable index for evaluating spinal cord function (Basso et al., 2006). The main score is evaluated after observing the range of motion of the ankle joint, coordination, paw posture, trunk stability, and tail posture of the mouse twopoint hind limb using a scale from 0 to 9, where 0 indicates complete paralysis and 9 indicates normal movements. The sub score complements the primary score by observing the overall coordination and stability of the mouse and is evaluated using a scale from 0 to 11 (Additional Tables 1
and2
). Two evaluators who were familiar with the scoring rules independently calculated the score twice before sampling (each observation lasted 5 minutes). The final score was obtained as the mean of the scores from the two evaluators.Gait analysis
Gait analysis was performed using the GaitScan system (CleverSys, Guangzhou, China) (Adams et al., 2016). After pre-training in an alternate channel for one week, the mice were allowed to walk freely in an illuminated glass plate within a confined corridor (50 cm × 8 cm) in a dark room. Each mouse was tested three times. A high-speed camera was used to record footprints for subsequent analysis with TreadScan2.0 software (CleverSys), and the speed of the mice was analyzed.
Imaging detection
All mice underwent magnetic resonance imaging conducted with a 3.0 Tesla Siemens MAGNETOM Prisma Fit magnetic resonance imaging system (Siemens Medical Solutions, Erlangen, Germany). The T2-weighted images were taken (echo delay time = 66 ms; repetition time = 4000 ms; flip angleα
= 150°; slice thickness: 1.5 mm; field of view = 41 mm × 70 mm).Tissue preparation
SPARC-null and WT mice (n
= 6 each) were anesthetized using intraperitoneal 0.3% sodium pentobarbital (30 mg/kg, Sigma, St. Louis, MO, USA) and then perfused through the left cardiac ventricle. The C1 to S4 spinal segments were extracted and post-fixed with 4% paraformaldehyde for 48 hours at 4°C. The spinal cord above and below the lumbar segment was divided using the lowest rib as the bone marker. The spinal cord corresponding to the L2‒L3 intervertebral disc from L1‒L2 to L3‒L4 for gradient dehydration was cut off and embedded in optimal cutting temperature medium (Tissue-Tek, Sakura, CA, USA). On the sagittal plane, the sample (including injury center of L2‒L3, 0.2 mm and 0.4 mm above the compression center and 0.2 mm and 0.4 mm below) was sliced into 7-µm slices along the transverse plane using a cryogenic thermostat (CM3050S, Leica, Wetzlar, Germany), mounted on a gelcoated slide, and stored at ‒80°C.The spinal cord tissues of an additional group of SPARC-null (n
= 5) and WT mice (n
= 4) were used for protein detection. The spinal cord of mice is thin, and therefore the spinal cord corresponding to the L1‒L5 vertebral body was cut using a blade for protein extraction, wrapped in foil, and stored at ‒80°C for protein extraction.Hematoxylin-eosin staining
Hematoxylin-eosin staining of the whole spinal cord in each group was performed using a hematoxylin and eosin staining kit (Cat# C0105S, Beyotime Biotechnology, Shanghai, China). The frozen spinal cord tissue sections were rewarmed at 20‒25°C for 15 minutes, washed with distilled water, and soaked in hematoxylin dye for 5 minutes. Samples were then rinsed with distilled water and placed in 1% hydrochloric acid ethanol for 1 second, after which they were soaked with eosin dye for 3 minutes and dehydrated with anhydrous ethanol twice for 2 minutes each. The sections were sealed with neutral resin, placed in an oven at 60°C, and scanned using an Olympus VS120 full film scanner (Olympus, Tokyo, Japan) in fluorescence mode.
Evaluation of apoptosis in neurons and oligodendrocytes
Apoptosis of neurons and oligodendrocytes was detected using the One-Step terminal deoxynucleotidyl transferase-mediated deoxyuridine triphosphatenick end labeling (TUNEL) Apoptosis Detection Kit (Beyotime Biotechnology, Cat# C1088) following the manufacturer’s instructions. Frozen tissue sections were incubated with primary antibodies against anti-neuronal nuclei (NeuN; Abcam, Cambridge, MA, USA, rabbit monoclonal antibody, 1:200, Cat# ab177487, RRID: AB_2532109) or anti-oligodendrocyte transcriptional factor-2 (Olig2; rabbit monoclonal antibody, 1:200, Abcam, Cat# ab109186, RRID: AB_10861310) at 4°C overnight. Samples were washed with phosphatebuffered saline (PBS) three times and incubated with goat anti-rabbit IgG (Alexa Fluor®594, 1:300, Proteintech, Rosemont, IL, USA, Cat# SA00013-4, RRID: AB_2810984) for 2 hours at 20‒25°C. Samples were then incubated with TUNEL detection solution for 1 hour at 37°C in the dark. The sections were scanned with an Olympus VS120 full film scanner in fluorescence mode after 4′,6-diamidino-2-phenylindole (DAPI, 1.0 mg/mL, Beyotime Biotechnology) staining. TUNEL-positive cells, which represented apoptotic cells, were counted in 350 × 350 µmregions.
Immunofluorescence staining
After washing with PBS, the frozen tissue sections were blocked with 5% bovine serum albumin (containing 0.5% Triton X-100). Sections were then incubated overnight at 4°C with the following primary antibodies: anti-βIIItubulin (a marker for neuron; mouse monoclonal antibody, 1:200, Abcam, Cat# ab78078, RRID: AB_2256751), anti-ionized calcium binding adapter molecule 1 (Iba1; goat monoclonal antibody, 1:200, Abcam, Cat# ab48004, RRID: AB_870576), anti-2-3-cyclic nucleotide 3-phosphodiesterase (mouse monoclonal antibody, 1:200, Abcam, Cat# ab6319, RRID: AB_2082593), anti-glial fibrillary acidic protein (GFAP; mouse monoclonal antibody, 1:200, Cell Signal Technology, Beverly, MA, USA, Cat# 3670S, RRID: AB_561049), anti-Bax (rabbit monoclonal antibody, 1:200, Abcam, Cat# ab32503, RRID: AB_725631), anti-cleaved caspase-3 (rabbit monoclonal antibody, 1:200, Abcam, Cat#9664S, RRID: AB_2070042), anti-interleukin (IL)-1β (rabbit monoclonal antibody, 1:200, Abcam, Cat# ab9722, RRID: AB_308765), anti-IL-6 (rabbit monoclonal antibody, 1:200, Abcam, Cat# ab233706, RRID: AB_2889391), anti-CD206 (rabbit monoclonal antibody, 1:200, Abcam, Cat# ab64693, RRID: AB_1523910), anti-C3 (rabbit monoclonal antibody, 1:200, Affinity Biosciences, Cincinnati, OH, USA, Cat# DF13224, RRID: AB_2846243), tumor necrosis factor-α (rabbit monoclonal antibody, 1:200, Abcam, Cat# ab183218, RRID: AB_2889388), anti-S100A10 (rabbit monoclonal antibody, 1:200, Thermo Fisher Scientific, Waltham, MA, USA, Cat# PA5-95505, RRID: AB_2807307), anti-IL-10 (rabbit monoclonal antibody, 1:200, Proteintech, Cat# 20850-1-AP, RRID: AB_2878752), anti-transforming growth factor-β (TGF-β; rabbit monoclonal antibody, 1:200, Proteintech, Cat# 21898-1-AP, AB_2811115), anti-NOD-like receptor protein 3 (NLRP3; rabbit monoclonal antibody, 1:200, Abcam, Cat# ab263899, RRID: AB_2889890), anti-brainderived neurotrophic factor (BDNF; rabbit monoclonal antibody, 1:200, Abcam, Cat# ab108319, RRID: AB_10862052), proliferating cell nuclear antigen (PCNA, rabbit monoclonal antibody, 1:200, Abcam, Cat# ab92552, RRID: AB_10561973), CD3 (rabbit monoclonal antibody, 1:200, Abcam, Cat# ab135372, RRID: AB_2884903), and CD11b (rabbit monoclonal antibody, 1:200, Abcam, Cat# ab52478, RRID: AB_868788). Sections were then washed with PBS three times and incubated with goat anti-rabbit IgG (Alexa Fluor®594, 1:300, Proteintech, Cat#SA00013-4, RRID: AB_2810984) and goat anti-mouse IgG (Alexa Fluor®488, 1:300, Proteintech, Cat#SA00013-1, RRID: AB_2810983) for 2 hours at 20‒25°C, followed by incubation with DAPI for 10 minutes at room temperature. Sections were examined using an Olympus VS120 full film scanner in fluorescence mode.
Triple staining of layered spinal cord was performed to evaluate the location and quantity of neurons, microglia, and astrocytes. The layered spinal cord was incubated overnight at 4°C with anti-Iba1 (goat monoclonal antibody, 1:200, Abcam, Cat# ab48004, RRID: AB_870576), anti-NeuN (rabbit monoclonal antibody, 1:200, Abcam, Cat# ab177487, RRID: AB_2532109) and anti-GFAP (mouse monoclonal antibody, 1:200, Cell Signal Technology, Cat# 3670S, RRID: AB_561049) primary antibodies and then incubated with donkey anti-rabbit IgG (Alexa Fluor®647, 1:300, Abcam, Cat# ab150083, RRID: AB_2714032), donkey anti-goat IgG (Alexa Fluor®555, 1:300, Abcam, Cat# ab150134, RRID: AB_2715537) and donkey anti-mouse IgG (Alexa Fluor®488, 1:300, Abcam, ab150109, RRID: AB_2571721) for 2 hours at 20‒25°C, followed by incubation with DAPI for 10 minutes. The samples were examined using a ZEISS LSM 900 confocal microscope (ZEISS, Shanghai, China). Quantification of cell markers was conducted using ImageJ software 1.8.0 version (National Institutes of Health, Bethesda, MD, USA) (Schneider et al., 2012).
Myelin basic protein staining
Myelin basic protein (MBP) staining was used to observe the expression of MBP, which maintains the structural homeostasis of the myelin sheath of the central nervous system (CNS) (Libich et al., 2010). Samples were washed with PBS and blocked with 5% bovine serum albumin. Sections were then incubated overnight at 4°C with anti-MBP (rabbit monoclonal antibody, 1:200, Invitrogen, Carlsbad, CA, USA, Cat# MA5-35074, RRID: AB_2848979), washed with PBS, and then incubated with goat anti-rabbit IgG (Alexa Fluor®488, 1:300, Proteintech, Cat# SA00013-4, RRID: AB_2810984) for 2 hours at 20‒25°C, followed by incubation with DAPI. The sections were examined using an Olympus VS120 full film scanner and the MBP-positive area was quantified. A larger fluorescent area and smooth texture indicates a healthier myelin sheath (Libich et al., 2010).
Western blot assay
Compressed spinal cord tissues were homogenized in radioimmunoprecipitation assay buffer (Cell Signaling Technology, Beverly, MA, USA). Protein concentration was determined using a bicinchoninic acid protein assay kit (Beyotime Biotechnology). Protein samples were separated by electrophoresis on an 8‒12% sodium dodecyl sulfate-polyacrylamide gel electrophoresis gel transferred onto a polyvinylidene fluoride membrane (0.45 µm, Millipore, Billerica, MA, USA) and blocked in 5% bovine serum albumin. Membranes were incubated with primary antibodies against anti-NeuN (rabbit monoclonal antibody, 1:1000, Abcam, Cat# ab177487, RRID: AB_2532109), anti-Olig2 (rabbit monoclonal antibody, 1:1000, Abcam, Cat# ab109186, RRID: AB_10861310), anti-Iba1 (goat monoclonal antibody, 1:1000, Abcam, Cat# ab48004, RRID: AB_870576), anti-GFAP (mouse monoclonal antibody, 1:1000, Cell Signal Technology, Cat# 3670S, RRID: AB_561049), anti-Bax (rabbit monoclonal antibody, 1:1000, Abcam, Cat# ab32503, RRID: AB_725631), anti-Bcl-2 (rabbit monoclonal antibody, 1:1000, Abcam, Cat# ab182858, RRID: AB_2715467), anti-cleaved caspase-3 (rabbit monoclonal antibody, 1:1000, Abcam, Cat# 9664S, RRID: AB_2070042), anti-inducible nitric oxide synthase (iNOS; rabbit monoclonal antibody, 1:1000, Abcam, Cat# ab3523, RRID: AB_303872), anti-CD206 (rabbit monoclonal antibody, 1:1000, Abcam, Cat# ab64693, RRID: AB_1523910), anti-IL-1β (rabbit monoclonal antibody, 1:1000, Abcam, Cat# ab9722, RRID: AB_308765), anti-IL-6 (rabbit monoclonal antibody, 1:1000, Abcam, Cat# ab233706, RRID: AB_2889391), anti-C3 (rabbit monoclonal antibody, 1:1000, Affinity Biosciences, Cat# DF13224, RRID: AB_2846243), anti-S100A10 (rabbit monoclonal antibody, 1:1000, Thermo Fisher Scientific, Cat# PA5-95505, RRID: AB_2807307), anti-IL-10 (rabbit monoclonal antibody, 1:1000, Cat# 20850-1-AP, RRID: AB_2878752, ProteinTec), anti-TGF-β (rabbit monoclonal antibody, 1:1000, ProteinTec, Cat# 21898-1-AP, RRID: AB_2811115), anti-NLRP3 (rabbit monoclonal antibody, 1:1000, Abcam, Cat# ab263899, RRID: AB_2889890), anti-apoptosis-associated speck-like protein containing CARD (ASC; rabbit monoclonal antibody, 1:1000, Abcam, Cat# ab155970, RRID: AB_2756836), anti-caspase-1 (rabbit monoclonal antibody, 1:1000, Abcam, Cat# ab207802, RRID: AB_2889889), anti-TrkB (rabbit monoclonal antibody, 1:1000, Abcam, Cat# ab18987, RRID: AB_444716), BDNF (rabbit monoclonal antibody, 1:1000, Abcam, Cat# ab108319, RRID: AB_10862052) or anti-β-actin (mouse monoclonal antibody, 1:1000, Proteintech, Cat# 66009-1-Ig, RRID: AB_2687938) at 4 °C overnight. The membrane was then incubated with horseradish peroxidase-conjugated goat anti-rabbit IgG (1:2000, Beyotime Biotechnology, Cat# A0208, RRID: AB_2892644), goat anti-mouse IgG (1:2000, Beyotime Biotechnology, Cat# A0216, RRID: AB_2860575) and donkey anti-goat IgG (1:2000, Abcam, Cat# ab6885, RRID: AB_955423) for 1 hour at 20‒25°C. The membrane was rinsed three times with Tris-buffered saline and Tween 20 and then bands were detected by chemiluminescent horseradish peroxidase substrate (Cat#WBKLS0500, Millipore) using a chemiluminescence detection system (BioRad, Guangzhou, China). Band densities normalized to β-actin were quantified using ImageJ software.
Statistical analysis
No statistical methods were used to predetermine sample sizes; however, our sample sizes are similar to those reported in a previous publication (Ko and Lim, 2021). The evaluators were blinded to the animal genotypes. Statistical analysis was performed with GraphPad Prism 7.00 (GraphPad Software, San Diego, CA, USA, www.graphpad.com). Data were analyzed using Student’st
-test. Data are presented as mean ± standard deviation (SD). AP
-value < 0.05 was considered statistically significant.Results
SPARC-null mice exhibit motor dysfunction
SPARC-null mice showed worse results on the rotating rod test, heat pain threshold test, and inclined plate test compared with the WT mice (Figure 2A–C
); however, there was no significant difference in the BMS main score (the weighted Kappa values of the two evaluators for BMS main and sub score were 0.863 and 0.875, respectively) (Figure 2D
andE
). These data imply that disc degeneration had more of an impact on muscle and sensation rather than a range of motion in nerve damage. Furthermore, gait analysis revealed significant differences in the speed between the two groups (Figure 2F
). These data suggest that the absence of SPARC causes motor dysfunction in mice, which is one of the characteristics of CSCC.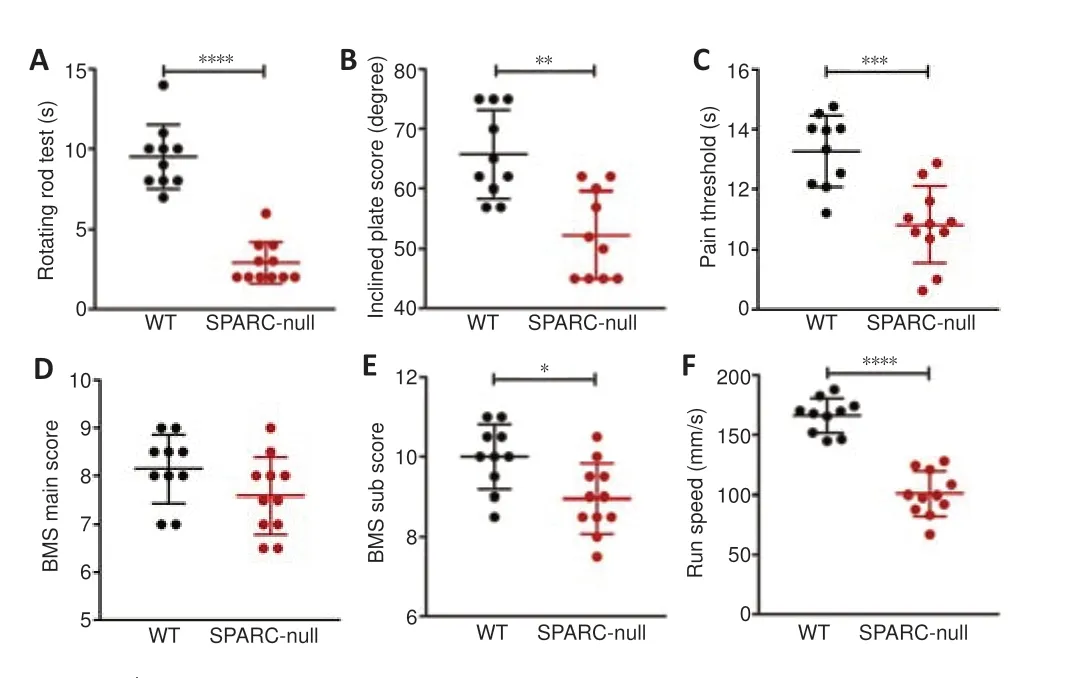
Figure 2 |SPARC-null mice exhibit motor dysfunction. (A) Residence time on the stick in the rotating rod test. (B) The inclined plate score in the inclined plate test. (C) The pain threshold in the pain threshold test. (D, E) The BMS main (D) and sub (E) scores. (F) Running speed based on gait analysis before sampling. Data are shown as mean ± SD (n = 11 in the SPARC-null group, n = 10 in the WT group). *P < 0.05, **P < 0.01, ***P < 0.001, ****P < 0.0001 (Student’s t-test). BMS: Basso Mouse Scale; SPARC: secreted protein, acidic and rich in cysteine; WT: wild-type.
The absence of SPARC induces disc herniation in mice
Magnetic resonance imaging (T2-weighted images) showed no disc degeneration in WT mice. In contrast, marked disc herniation and degeneration at almost all spine levels were seen in SPARC-null mice; compression was seen at different spinal cord levels, especially in the lumbar segments (Figure 3A
). After sampling and spinal cord dissection, spinal cords from 11 SPARC-null mice were collected. Spinal cord compression was further confirmed in the lumbar segments in all cases, in the thoracic segments of seven cases, and in the cervical segments of four cases (Figure 3B
); no compression was observed in the WT group.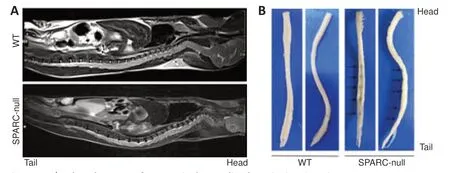
Figure 3 |The absence of SPARC induces disc herniation in mice. (A) MRI of the entire spine of mice. (B) The whole segment of the spinal cord after sampling and fixation. Compression was seen at different spinal cord levels, especially in the lumbar segments, in SPARC-null mice compared with the WT control. The arrows show traces of spinal cord compression. MRI: Magnetic resonance imaging; SPARC: secreted protein, acidic and rich in cysteine.
Distribution of spinal cord cells in SPARC-null mice
Compression of the spinal cord was confirmed by hematoxylin and eosin staining (Figure 4A
). Western blot showed that the expressions of NeuN and Olig2 in SPARC-null mice were significantly decreased, while Iba1 and GFAP expressions were significantly increased compared with levels in WT mice (Figure 4B
). In addition, triple immunofluorescence staining and quantitative analysis demonstrated that neurons in the compression center were significantly reduced in SPARC-null mice. In addition, microglia/macrophages in WT mice were individually and sporadically scattered in the spinal cord, while those in SPARC-null mice were mostly limited in the injury center. Unlike microglia/macrophages, astrocytes were mainly expressed in the white matter of WT mice, while in SPARC-null mice, astrocytes were significantly increased in both gray and white matter and were not restricted to the injury center, above and below the compression center, respectively (Figure 4C
andD
). SPARC-null mice showed neuronal depletion, inflammation, and astrocyte hyperplasia.The absence of SPARC causes apoptosis and demyelination in the spinal cord
TUNEL-positive cells were observed in neurons and oligodendrocytes of SPARC-null mice, while few TUNEL-positive cells were observed in WT mice (Figure 5A
andB
). Immunofluorescence staining indicated that the expressions of apoptosis-related proteins Bax and cleaved caspase-3 were increased in SPARC-null mouse neurons and increased cleaved caspase-3 was observed in oligodendrocytes compared with WT mice (Figure 5A
andB
). In addition, MBP is a protein widely distributed in oligodendrocytes and contains a variety of basic amino acids to maintain the stability of the structure and function of myelin sheath in the CNS (Müller et al., 2013), was less integrated in SPARC-null mice compared with WT mice (Figure 5C
). The western blot results were consistent with the above results (Figure 5D
). Therefore, our results suggested that the absence of SPARC in mice leads to apoptosis and demyelination in the spinal cord, which is one of the characteristics of CSCC.SPARC-null mice exhibit neuroinflammation
After spinal cord compression, microglia/macrophages are activated and recruited to produce iNOS, IL-6, IL-1β, and other cytokines, which leads to neuroinflammation (Pei et al., 2017). As shown by immunofluorescence staining, few inactive microglia were distributed in the spinal cord of WT mice, while the levels of Iba1, IL-1β, and IL-6 (markers of M1 phenotype microglia/macrophages) were significantly increased in SPARC-null mice. Western blot results were consistent with the immunofluorescence results (Figure 6A
andB
). CD206 expression was also increased in SPARC-null mice compared with expression in WT mice, suggesting an increase in M2 phenotype microglia/macrophages (Ip et al., 2008; Bhargava et al., 2021) (Figure 6C
andD
). CD3T lymphocytes and CD11bmacrophage-like positive cells also increased in SPARC-null mice (Figure 6E
). These results indicate that the SPARC-null mice exhibited neuroinflammation; however, both M1 and M2 microglia/macrophages were polarized.Astrocyte activation in SPARC-null mice
Astrocytes are the most widely distributed group of cells in the mammalian CNS and are involved in the formation of the blood-brain barrier. They also have an important role in neuroinflammation (Giovannoni and Quintana, 2020). Immunofluorescence staining showed that the expression of astrocyte marker GFAP was increased both in white and gray matter in SPARC-null mice compared with WT mice. PCNA (a hyperplasia marker (González-Magaña and Blanco, 2020)) and cytokines such as C3, IL-1β, and tumor necrosis factor-α (which represent A1 phenotype (Escartin et al., 2021)), S100A10, IL-10, and TGF-β (which represent the A2 type (Eroglu, 2009)) were significantly increased in SPARC-null mice (Figure 7
andAdditional Figure 1
). Therefore, the spinal cord compression induced by the absence of SPARC indirectly induces the activation of A1 and A2 phenotype astrocytes in the spinal cord.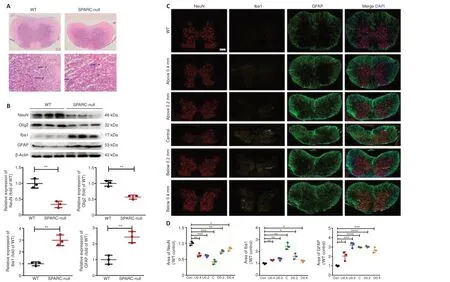
Figure 4 |Distribution of spinal cord cells in the L2/3 level in SPARC-null mice. (A) HE staining of compression sites. Compression of the spinal cord was confirmed by HE staining. Blue arrows indicate neurons. Scale bar: 500 µm in the spinal cord overall view, and 20 µm in gray matter. (B) Western blot and quantitative analysis of NeuN, Olig2, Iba1, and GFAP in the spinal cord. Protein expression was normalized to β-actin. (C) Distribution of neurons, microglia, and astrocytes marked with NeuN (red), Iba1 (yellow), and GFAP (green), respectively, 0.2 mm and 0.4 mm above and below the spinal cord compression center. Scale bar: 500 µm. (D) Quantitative analysis of neurons, microglia/macrophages, and astrocytes. Data were normalized to the area of NeuN, Iba1, and GFAP in WT control. Data are shown as mean ± SD (n = 3 mice in each group). *P < 0.05, **P < 0.01, ***P < 0.001, ****P < 0.0001 (Student’s t-test). GFAP: Glial fibrillary acidic protein; HE: hematoxylin-eosin; Iba1: ionized calcium binding adapter molecule 1; NeuN: neuronal nuclei; Olig2: oligodendrocyte transcriptional factor-2; SPARC: secreted protein, acidic and rich in cysteine; WT: wild-type.
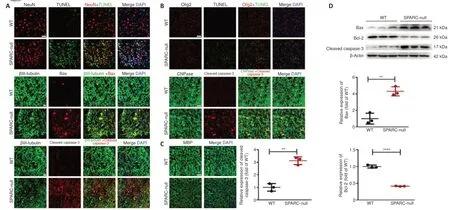
Figure 5 |Apoptosis and demyelination in the spinal cord at L2/3 level caused by the absence of SPARC. (A) TUNEL staining with NeuN and immunofluorescence staining of βIII-tubulin (green), Bax (red), and cleaved caspase-3 (red). TUNEL-positive cells were observed and apoptosisrelated proteins Bax and cleaved caspase-3 expression were increased in SPARC-null mouse neurons compared with WT mice. Scale bar: 50 µm in TUNEL staining; 20 µm in others. (B) TUNEL staining with Olig2 (red) and immunofluorescence staining of CNPase (green) with cleaved caspase-3 (red). TUNEL-positive cells were observed in SPARC-null mice oligodendrocytes and cleaved caspase-3 expression was increased in SPARC-null mice oligodendrocytes compared with WT mice. Scale bar: 100 µm in TUNEL staining; 50 µm in other panels. (C) Immunofluorescence staining for MBP (green). MBP was less integrated in SPARC-null mice compared with WT mice. Scale bar: 50 µm. (D) Western blot and quantitative analysis (normalized to β-actin) of Bax, Bcl-2, and cleaved caspase-3. Data are shown as mean ± SD (n = 3 mice in each group). **P < 0.01, ****P < 0.0001 (Student’s t-test). CNPase: 2-3-Cyclic nucleotide 3-phosphodiesterase; MBP: myelin basic protein; NeuN: neuronal nuclei; Olig2: oligodendrocyte transcriptional factor-2; SPARC: secreted protein, acidic and rich in cysteine; Tunel: terminal deoxynucleotidyl transferase-mediated deoxyuridine triphosphate-nick end labeling staining; WT: wild-type.
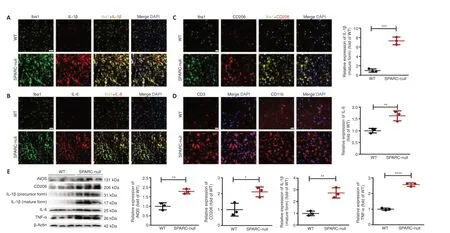
Figure 6 |Neuroinflammation at the L2/3 level caused by the absence of SPARC. (A‒C) Immunofluorescence staining for Iba1 (green) with IL-1β, IL-6, and CD206 (red). The levels of Iba1, IL-1β, and IL-6 with Iba1 (markers of M1 phenotype microglia/macrophages) were significantly increased in SPARC-null mice compared with WT control. (D) Immunofluorescence staining for CD3 and CD11b (red). Scale bar: 20 µm. (E) Western blot and quantitative analysis of iNOS, CD206, IL-1β, IL-6, and TNF-α (normalized to β-actin). Data are shown as mean ± SD (n = 3 mice in each group). *P < 0.05, **P < 0.01, ***P < 0.001 (Student’s t-test). Iba1: Ionized calcium binding adapter molecule 1; IL: interleukin; iNOS: inducible nitric oxide synthase; SPARC: secreted protein, acidic and rich in cysteine; TNF-α: tumor necrosis factor-α; WT: wild-type.
SPARC-null mice exhibit activated NLRP3 inflammasomes
The inflammasome is a cellular signal receptor that senses neuropathological conditions. NLRP3 is an inflammasome that contains apoptosis-associated microprotein ASC and whose activation can lead to proteolysis of caspase-1. This, in turn, activates pro-inflammatory cytokines, such as IL-1β and IL-18, and causes neuroinflammation (Riaz et al., 2021). Immunofluorescence staining showed that NLRP3 expression was low in WT mice, while it was increased in SPARC-null mice, especially in the compression part (in both gray matter and white matter) (Figure 8A
andB
). These data were further confirmed by western blot (Figure 8C
). Therefore, we concluded that the absence of SPARC in mice activates NLRP3 inflammasomes, which is one of the characteristics of CSCC.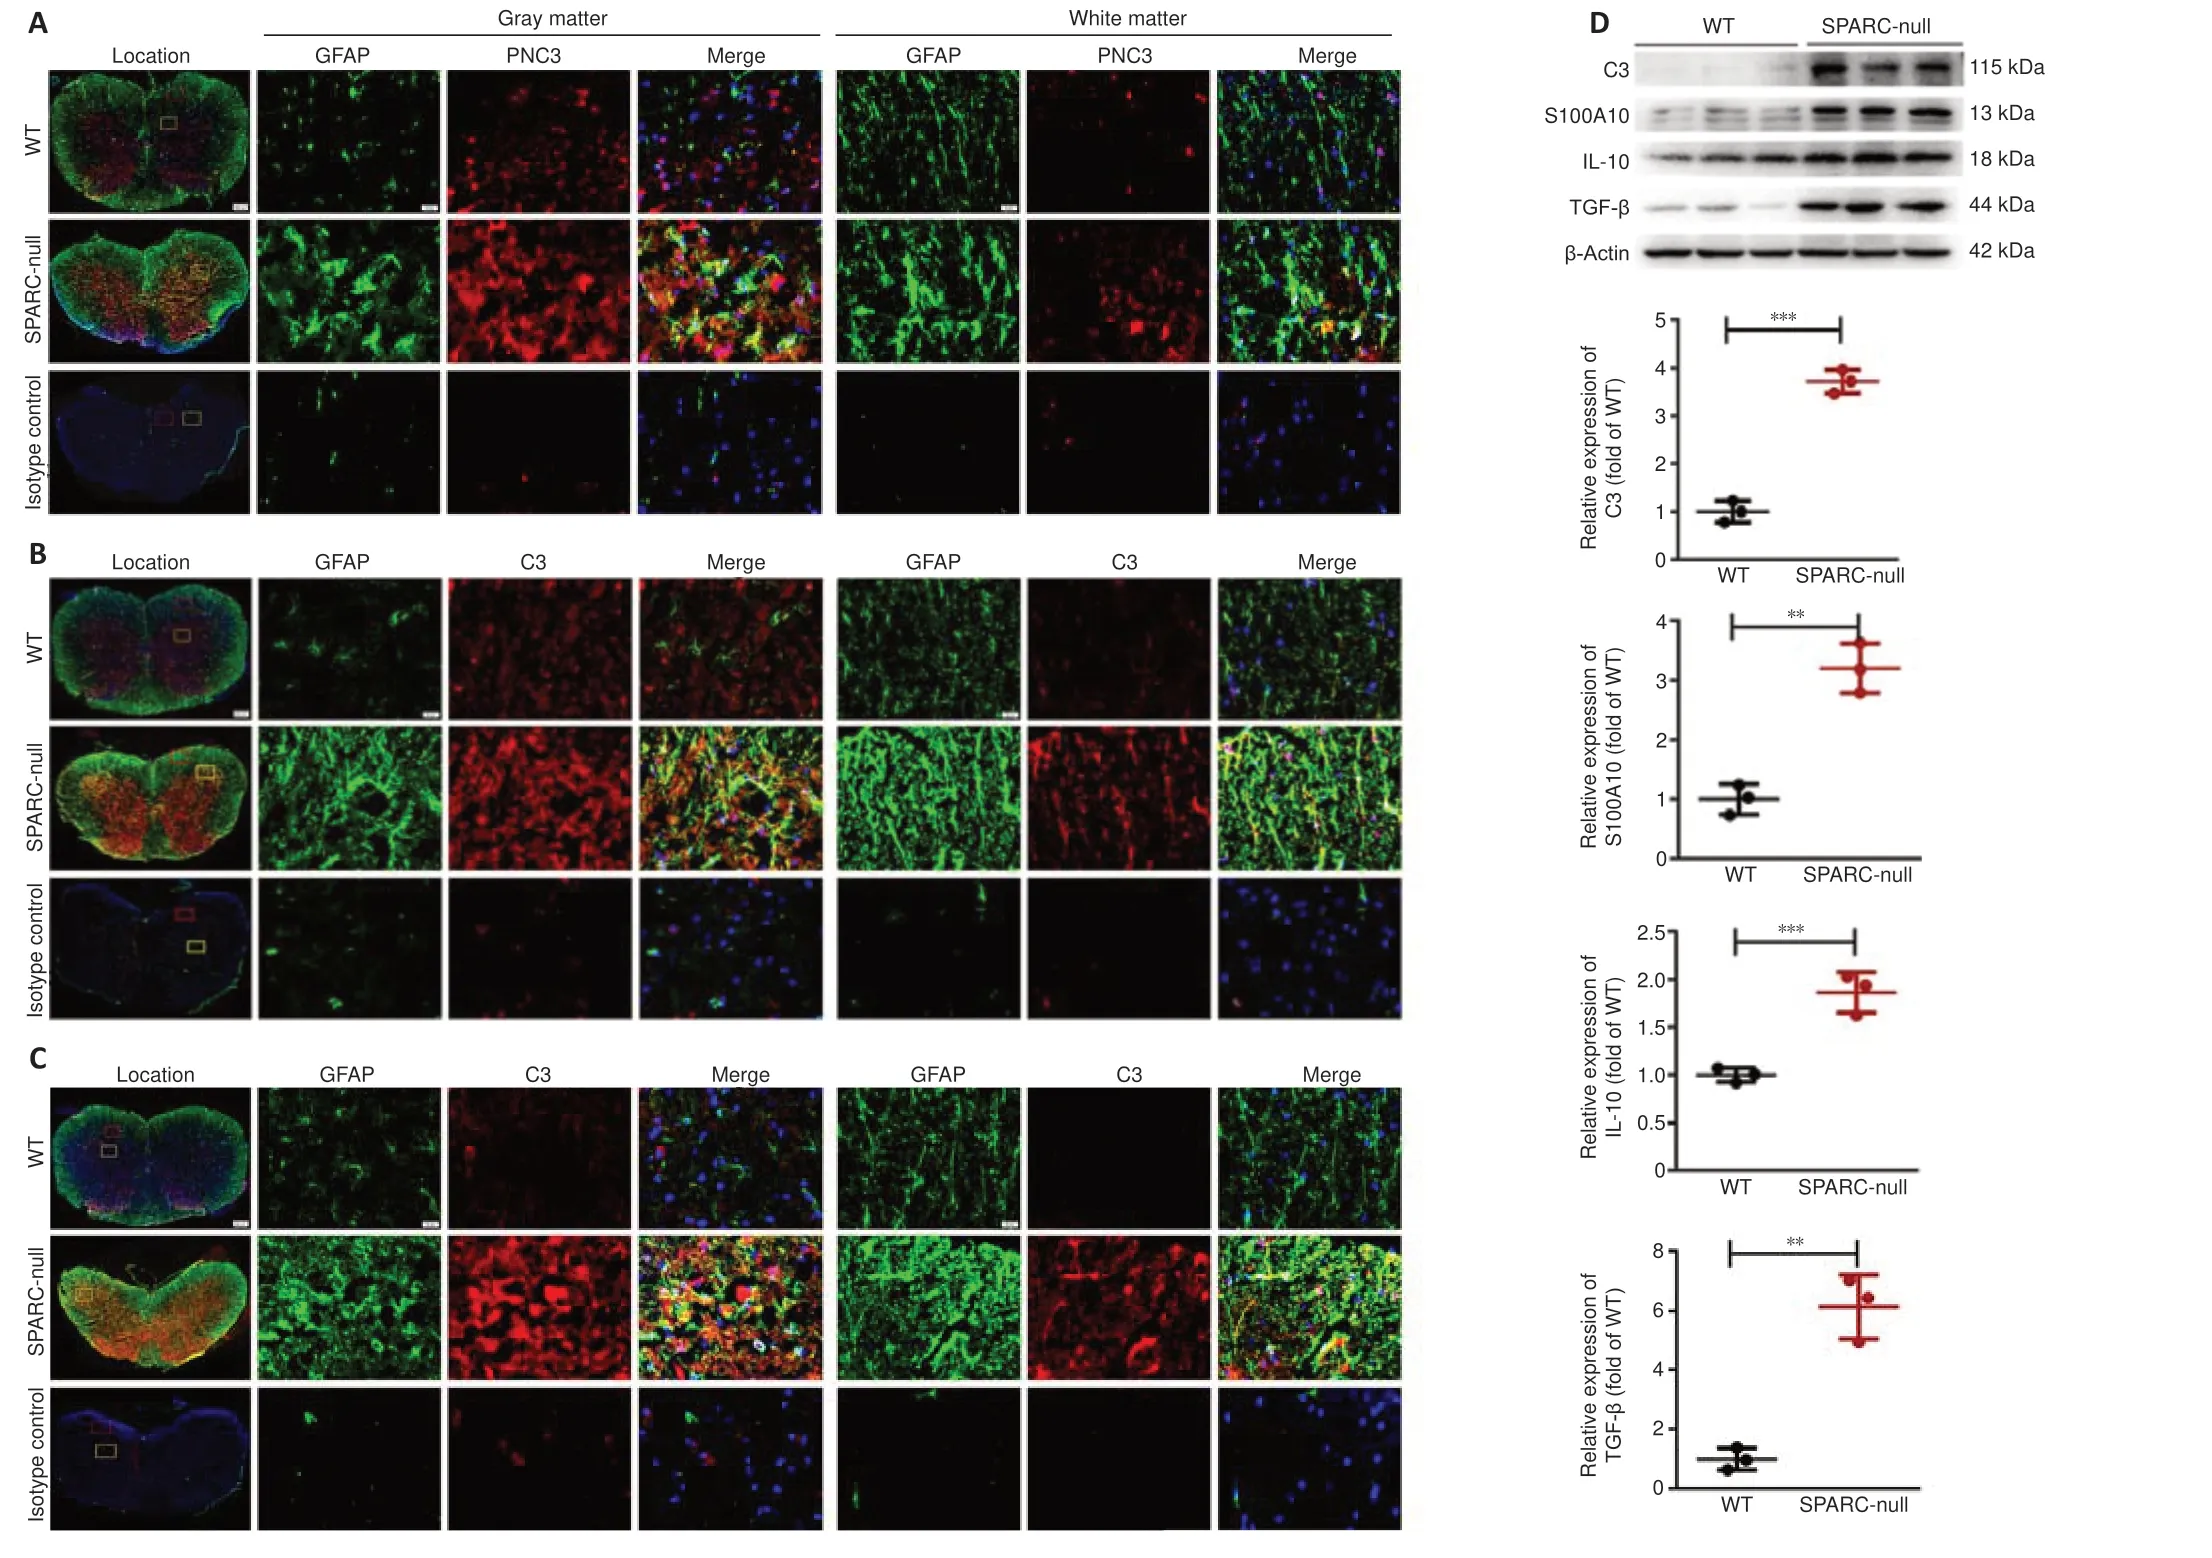
Figure 7 |Astrocyte activation in L2/3 level in SPARC-null mice. (A‒C) Immunofluorescence staining of GFAP with PCNA, C3, and S100A10. The expression of the astrocyte marker GFAP (green) was increased both in white and gray matter in SPARC-null mice compared with WT mice, PCNA, C3, and S100A10 (red) were significantly increased in SPARC-null mice. Scale bars: 500 µm in spinal cord overall view, 20 µm in gray and white matter. (D) Western blot and quantitative analysis of C3, S100A10, IL-10, and TGF-β (normalized to β-actin). Data are shown as mean ± SD (n = 3 mice in each group). **P < 0.01, ***P < 0.001 (Student’s t-test). C3: Complement component 3; GFAP: glial fibrillary acidic protein; IL-10: interleukin-10; PCNA: proliferating cell nuclear antigen; S100A10: soluble protein-100α10; SPARC: secreted protein, acidic and rich in cysteine; TGF-β: transforming growth factor-beta; WT: wild-type.
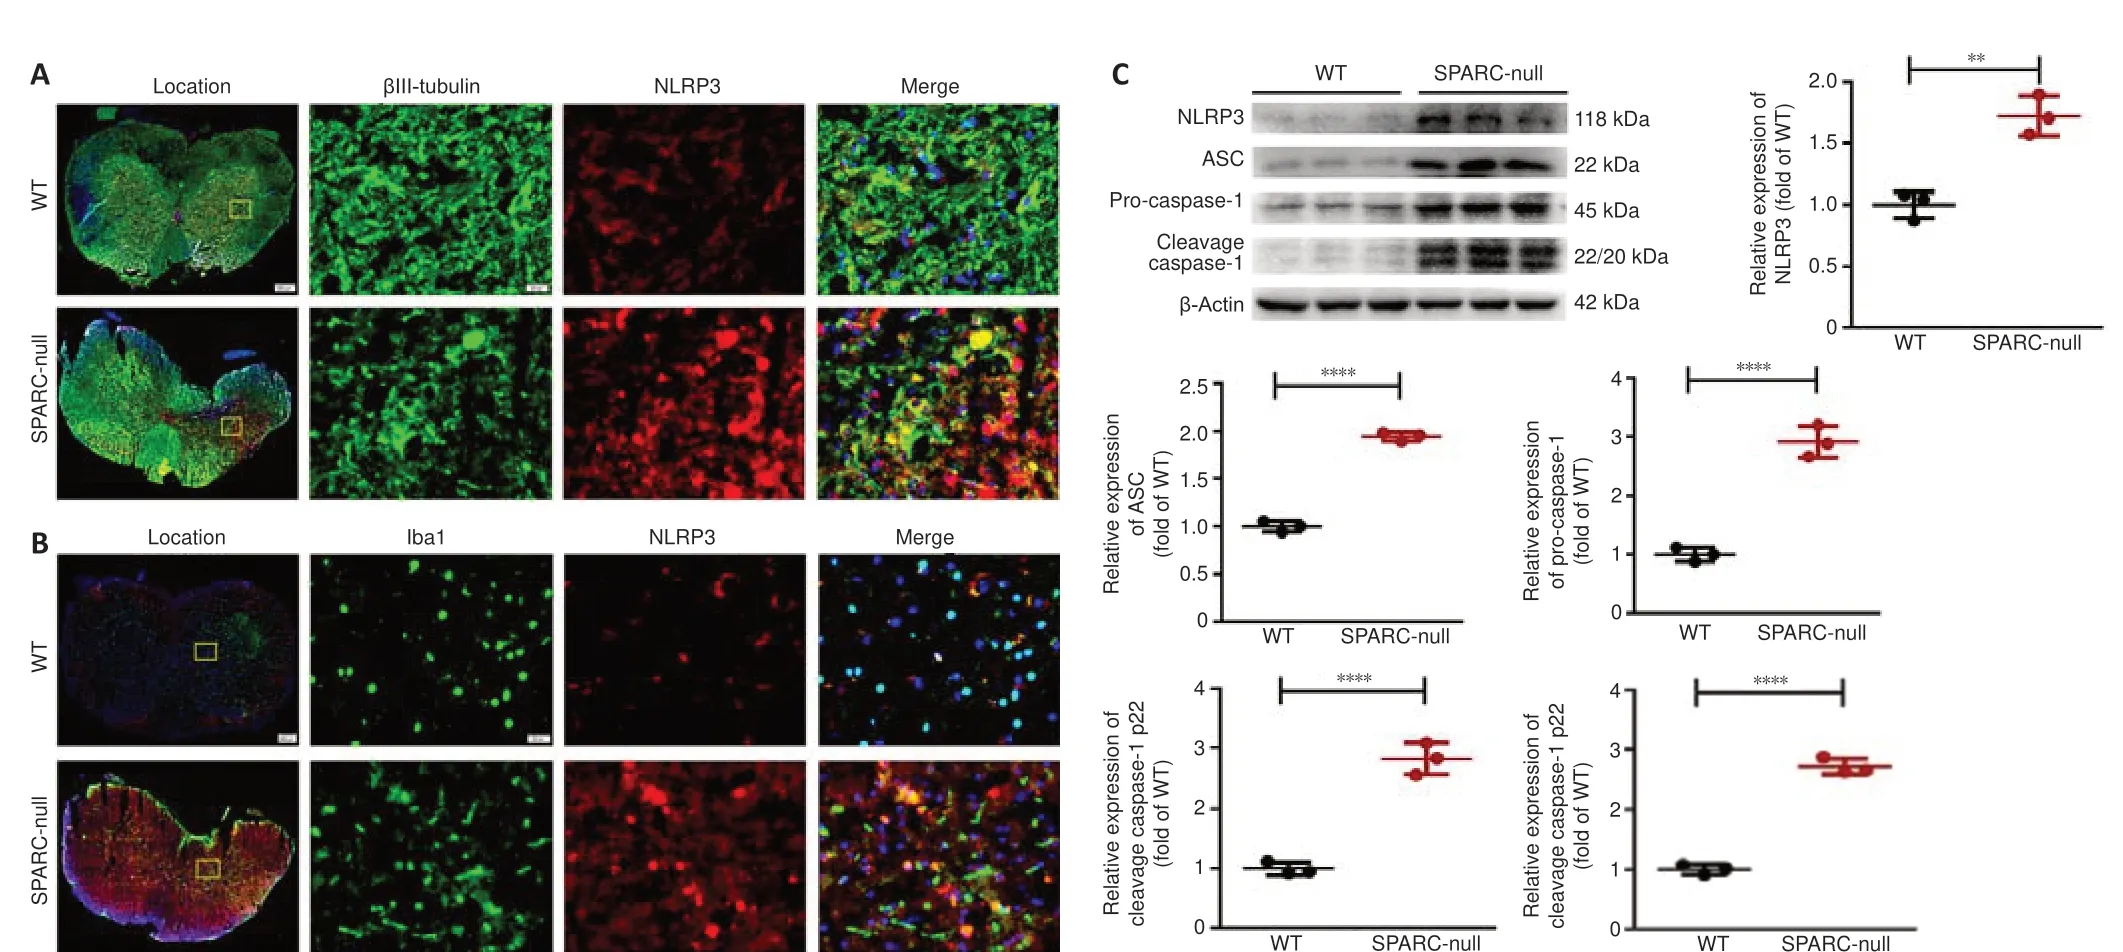
Figure 8 |The absence of SPARC activates NLRP3 inflammasomes at the L2/3 level in spinal cord. (A) Immunofluorescence staining of Iba1 (green) with NLRP3 (red). NLRP3 expression was low in WT mice, while it was enhanced in neurons of SPARC-null mice, especially in the compression part. (B) Immunofluorescence staining of βIII-tubulin (green) with NLRP3 (red). NLRP3 expression was low in WT mice, while it was enhanced in microglia of SPARC-null mice, especially in the compression part. Scale bars: 20 µm. (C) Western blot and quantitative analysis of NLRP3, ASC, pro caspase-1, and cleavage caspase-1 (normalized to β-actin). Data are shown as mean ± SD (n = 3 mice in each group). **P < 0.01, ****P < 0.0001 (Student’s t-test). ASC: Apoptosis-associated speck-like protein containing a CARD; Iba1: ionized calcium binding adapter molecule 1; NLRP3: NOD-like receptor protein 3; SPARC: Secreted protein, acidic and rich in cysteine; WT: wild-type.
The absence of SPARC inhibits the BDNF/TrkB signaling pathway
BDNF is the most abundant neurotrophic factor in the body and promotes the growth of neurons and the formation and stability of synapses in nerve cells in the brain. It also participates in cell differentiation, cell viability, and synaptic plasticity by binding to tyrosine kinase B (TrkB) (Numakawa and Odaka, 2021). Next, we examined whether spinal cord compression caused by the absence of SPARC inhibits the BDNF/TrkB pathway. Immunofluorescence staining results showed lower BDNF expression in the whole spinal cord of SPARC-null mice compared with WT mice. In SPARC-null mice, BDNF was decreased at the non-compression part, while the expression of BDNF was observed at the compression site; however, overall, it was declined in SPARC-null mice (Figure 9A
andB
). Western blot results also indicated a down-regulation of TrkB and BDNF expression in SPARC-null mice vs. WT mice (Figure 9C
). In summary, our results suggested that the absence of SPARC inhibits the BDNF/TrkB signaling pathway.
Figure 9 |The absence of SPARC inhibits the BDNF/TrkB signaling pathway at the L2/3 level in spinal cord. (A) Immunofluorescence staining of βIII-tubulin (green) with BDNF (red). Lower BDNF expression was observed in SPARC-null mice compared with WT mice in the whole spinal cord in neurons. (B) Immunofluorescence staining of Iba1 (green) with BDNF (red). Lower BDNF expression was observed in SPARC-null mice compared with WT mice in the whole spinal cord in microglia. Scale bars: 20 µm. (C) Western blot and quantitative analysis of BDNF and TrkB. Data are normalized to β-actin and shown as mean ± SD (n = 3 mice in each group). **P < 0.01, ****P < 0.0001 (Student’s t-test). BDNF: Brainderived neurotrophic factor; SPARC: secreted protein, acidic and rich in cysteine; TrkB: tropomyosin related kinase B; WT: wild-type.
Discussion
In this study, we evaluated whether SPARC-null mice might be a suitable animal model for investigating CSCC. Our data revealed significant motor dysfunction and significant radiographic and anatomical compression in SPARC-null mice. Furthermore, we found that compression of the spinal cord leads to apoptosis of neurons and oligodendrocytes, activation of M1 and M2 of microglia/macrophages, and activation of A1 and A2 of astrocytes. We also demonstrated that the neuronal death and microglial activation occur via the BDNF/TrkB signaling pathway. Finally, our results indicate that activation of the NLRP3 inflammasome may mediate microglial polarization and neuroinflammation.
To the best of our knowledge, this is the first study that reported compression of lumbar segments in the spine intervertebral disc compared with cervical or thoracic segments in SPARC knockout mice. This phenomenon is not unique to SPARC knockout mice. In a study by Alvarez-Garcia et al. (2017) of aging C57BL/6J mice (6, 12, 24, and 36 months of age), the authors detected an earlier onset of intervertebral disc degeneration in the lumbar region than in the cervical region of the spine. Gruber et al. (2002) evaluated the progression of wedging, narrowing, endplate calcification, and irregular disc margins of different disc levels in sand rats (2, 3, and 6 months old), a desert animal with lower body hydration and lower intervertebral disc water content compared with rats of other strains (Moskowitz et al., 1990). The authors concluded that lower lumbar sites were first involved, followed by involvement of higher discs with progressing age. Distal lumbar segments had significantly lower water content than more proximal segments. The lower water content was related to a lower fixed charge density, which was essential for the intervertebral disc matrix capacity of absorbing water in the sand rat (Ziv et al., 1992). Although there is no fixed charge density test related to the intervertebral disc test in mice or SPARC knockout mice, this may be a possible reason for the lower intervertebral disc and earlier degeneration in SPARC-null mice.
A previous study found no difference in rotarod results between normal and SPARC-null mice, in which the oldest SPARC-null mice group was only 9 months old (Millecamps et al., 2011). However, another study found decreased grip strength in 8-month-old SPARC-null mice compared with agematched WT mice (Krock et al., 2018). Millecamps et al. (2015) reported that 12-month old or older SPARC-null mice displayed signs of impaired motor ability, which was evaluated using a rotating rod test. In this study, we found that 22‒24-month-old SPARC-null mice showed worse results in the rotating rod test and inclined plate test compared with younger mice. The SPARCnull mice showed signs of degenerative disc degeneration two months after birth and signs of extensive disc degeneration after 2 years (Millecamps et al., 2015). The loss of spinal cord function caused by compression is a longterm process (Karadimas et al., 2015). First, the intervertebral disc protrudes and compresses the dura mater and finally compresses the spinal cord. The transition from spinal cord compression to spinal cord dysfunction is a long process. Similar processes are seen in humans (Matz et al., 2009). In cervical disc herniation, the occurrence of hand anesthesia and radiation pain is earlier than that of fine movement disorder, and walking difficulty occurs later than numbness and pain of both lower limbs (Bednarik et al., 2008). Therefore, for future studies of CSCC, mice older than 12 months should be selected.
Establishing a CSCC animal model that mimics the process of CSCC in humans is of crucial importance to explore the pathogenesis and treatment of CSCC. The current animal models of CSCC include the balloon compression model, screw compression model, tumor compression model, expandable material compression model, and Tiptoe-walking Yoshimura (Twy) mouse model. The degree of CSCC in the balloon compression model depends on the pressure provided by the balloon and the length of the compressed spinal cord. However, it is difficult to completely simulate the pathological process of CSCC using this model, as the repeated stimulation of the spinal cord by repeated inflation of the balloon can lead to acute and subacute injury. A similar problem is seen in the screw compression model (Tarlov et al., 1953; Lee et al., 2012).
The tumor compression model involves implanting tumor tissues into the epidural space that compress the spinal cord (Coman and deLong, 1951). The main limitation of this model is the uncontrolled growth of the tumor (both in size and direction).
The material compression model is a widely used model. Water-absorbable polyurethane polymer synthesized from isocyanates and polyols, polyvinyl alcohol‒polyacrylamide hydrogel to single or double segments, synthetic aromatic polyether, and water-absorbing polyurethane elastomer have been successfully applied (Karadimas et al., 2013; Dhillon et al., 2016; Cheng et al., 2019; Sun et al., 2021; Yamamoto et al., 2021; Yao et al., 2022). However, if the material expands too fast, it can cause acute or subacute injury to the spinal cord. Another challenge is distinguishing inflammation caused by external materials from inflammation caused by compression. Moreover, the damage to the lamina during the operation is likely to destroy the stability of the spine (Long et al., 2013).
A compression device has been used in larger animals. Li et al. (2022) developed an intervertebral compression device connected with subcutaneous control modules that can be implanted into the C2‒C3 intervertebral disk spaces of sheep and then connected by Bluetooth to anin vitro
control system. The device can be easily controlled and may be used to simulate chronic cervical spinal cord compression in animals.The Twy mouse is a transgenic mouse (Hosoda et al., 1981) that develops calcification deposits behind the cervical spine that gradually compresses the cervical spinal cord. However, as the compression site is limited to the cervical spine, the range of diseases that can be studied is limited to those related to the cervical vertebra. Furthermore, because of the relatively small amount of cervical pulp in mice, obtaining sufficient samples for protein analyses is challenging. Compared with the above models, Twy and SPARC-null mice are the only two non-invasive chronic progressive animal compression models. The course of disease in these models develops slowly, which is consistent with the pathological changes of chronic compression. While Twy mice are used to examine the CSCC caused by calcification of the ligamentum flavum, the SPARC-null mice reflect CSCC caused by disc degeneration, representing the major pathological factor of CSCC.
To the best of our knowledge, this is the first study that demonstrated that SPARC-deficiency in mice causes CSCC followed by disc herniation. However, this study has several limitations. Because of the limitations in samples and technology, this study did not use flow cytometry, which may determine the classification and number of cells in compressed tissue. In addition, because of individual differences between mice, there may be different levels of compression. The differing levels of compression may lead to the differing compression of the lumbar segment or whole spine.
SPARC is highly expressed by astrocytes and microglia during CNS development, but its level is reduced in adulthood (Eroglu, 2009). Interestingly, SPARC is upregulated in CNS injury and disease in brain tissue, as shown by middle cerebral artery occlusionin vivo
and oxygen-glucose deprivation inin vitro
experiments (Jones and Bouvier, 2014; Jones et al., 2018). Previous studies reported that astrocytes regulate synaptic connectivity in the CNS through secreted signals, hevin, and SPARC, which are regulators of excitatory synaptogenesisin vitro
andin vivo
. In a previous study, SPARC-null mice had increased synaptic connections in CNS injury, while hevin caused an opposite effect, suggesting that hevin is a positive and SPARC is a negative regulator of synapse formation. This further implied that astrocytes might control the formation, maturation, and plasticity of synapsesin vivo
through the regulation of hevin and SPARC (Jones et al., 2018). In contrast, increased microgliosis and enhanced functional recovery after photothrombotic stroke have been found in SPARC-null mice (Lloyd-Burton et al., 2013). Therefore, when using SPARC-null mice as a model of CSCC, it is also necessary to focus on the effect of SPARC knockout on the CNS.Together, our data suggest that SPARC-null mice results in motor dysfunction, radiographic and anatomical compression, apoptosis and demyelination of neurons in the spinal cord, activation of M1 and M2 of microglia/macrophages, activation of A1 and A2 of astrocytes, activation of NLRP3 inflammasomes, and neuroinflammation. Therefore, SPARC-null mice may be used as a valuable model for studying CSCCin vivo
.Author contributions:
Study design and manuscript writing: XJC, MY, QQL, YJW; rat feeding and MRI examination: GL, ZYL, PMP; immunofluorescence staining, western blot and HE staining: ZYL, AFZ; function score: KZ, ZZ; statistical analysis: MY, ZYL; article modify and revision: XJC, MY, ZYL. All the authors approved the final version of the manuscript.
Conflicts of interest:
The authors declare no conflict of interest.
Availability of data and materials:
All data generated or analyzed during this study are included in this published article and its supplementary information files.
Open access statement:
This is an open access journal, and articles are distributed under the terms of the Creative Commons AttributionNonCommercial-ShareAlike 4.0 License, which allows others to remix, tweak, and build upon the work non-commercially, as long as appropriate credit is given and the new creations are licensed under the identical terms.
Open peer reviewers:
Ashley Noelle Dalrymple, University of Pittsburgh, USA; Elena Giusto, San Camillo Hospital, Italy.
Additional files:
Astrocyte activation in SPARC-null mice.
Score and operational definitions for the Basso Mouse Scale.
Score and operational definitions for the Basso Mouse Scale subscore.
Open peer review reports 1 and 2.
- 中国神经再生研究(英文版)的其它文章
- Inflammation and retinal degenerative diseases
- Synaptic alterations as a common phase in neurological and neurodevelopmental diseases: JNK is a key mediator in synaptic changes
- Brain-derived neurotrophic factor in main neurodegenerative diseases
- The best of both worlds: mastering nerve regeneration combining biological and nanotechnological tools
- Exosomal miR-23b from bone marrow mesenchymal stem cells alleviates oxidative stress and pyroptosis after intracerebral hemorrhage
- Chlorogenic acid alleviates hypoxic-ischemic brain injury in neonatal mice

