Bioinformatics analysis of ferroptosis in spinal cord injury
Jin-Ze Li , Bao-You Fan , Tao Sun , Xiao-Xiong Wang , Jun-Jin Li Jian-Ping Zhang Guang-Jin Gu Wen-Yuan Shen De-Rong Liu Zhi-Jian Wei , , Shi-Qing Feng ,
Abstract Ferroptosis plays a key role in aggravating the progression of spinal cord injury (SCI), but the specific mechanism remains unknown. In this study, we constructed a rat model of T10 SCI using a modified Allen method. We identified 48, 44, and 27 ferroptosis genes that were differentially expressed at 1, 3, and 7 days after SCI induction. Compared with the sham group and other SCI subgroups, the subgroup at 1 day after SCI showed increased expression of the ferroptosis marker acyl-CoA synthetase long-chain family member 4 and the oxidative stress marker malondialdehyde in the injured spinal cord while glutathione in the injured spinal cord was lower. These findings with our bioinformatics results suggested that 1 day after SCI was the important period of ferroptosis progression. Bioinformatics analysis identified the following top ten hub ferroptosis genes in the subgroup at 1 day after SCI: STAT3, JUN, TLR4, ATF3, HMOX1, MAPK1, MAPK9, PTGS2, VEGFA, and RELA. Real-time polymerase chain reaction on rat spinal cord tissue confirmed that STAT3, JUN, TLR4, ATF3, HMOX1, PTGS2, and RELA mRNA levels were up-regulated and VEGFA, MAPK1 and MAPK9 mRNA levels were down-regulated. Ten potential compounds were predicted using the DSigDB database as potential drugs or molecules targeting ferroptosis to repair SCI. We also constructed a ferroptosis-related mRNA-miRNA-lncRNA network in SCI that included 66 lncRNAs, 10 miRNAs, and 12 genes. Our results help further the understanding of the mechanism underlying ferroptosis in SCI.
Key Words: bioinformatics; drug; ferroptosis; Gene Ontology enrichment analysis; gene-miRNA network; Kyoto Encyclopedia of Genes and Genomes pathway; mRNA-miRNA-lncRNA network; progression; spinal cord injury

Introduction 626 Methods 627 Results 628 Discussion 632
Introduction
Spinal cord injury (SCI) is characterized by high mortality and high disability rates and causes a heavy economic burden on patients and society (Priebe et al., 2007; Furlan and Fehlings, 2009; Li, 2020). Failure of regeneration and recovery after SCI is attributed to a series of complicated pathological changes (Fan et al., 2018). The primary mechanical violence causes rupture of topical capillaries and destruction of the blood-spinal cord barrier in the spinal cord parenchyma. Subsequently, hemorrhage, pro-inflammatory factors, and oxidative stress induce the irreversible loss of functional nerve cells, such as neurons and oligodendrocytes, resulting in neural disconnection and signaling transduction failure (Kastin and Pan, 2005; McDonald and Belegu, 2006). The main therapeutic strategies for treating SCI include drugs directed to targets in various pathological changes and early decompression. To improve therapeutic options, the underlying pathogenesis of SCI needs to be further explored.
Ferroptosis is a newly described mode of cell death mechanism that differs from apoptosis with three distinguishing and unique features, including iron overload, lipid peroxidation, and mitochondrial dysfunction (Dixon et al., 2012). Ferroptosis is induced by the exudation of numerous red blood cells, heme, and rich iron in bleeding, which triggers free radical production and toxicity (Hao et al., 2017). Cell death mediated by ferroptosis plays a dominant role in the pathogenesis of SCI (Chen et al., 2020). The acute phase occurs within 2 days after SCI, and the subacute phase occurs from 3 to 14 days after SCI (Ahuja et al., 2017). Research has indicated that ferroptosis is primarily involved in the acute and subacute phases of SCI. Within these two phases, the period, in which ferroptosis of SCI occurs and develops most obviously, represents the critical period. Ferroptosis inhibitors, including deferoxamine and SRS 16‒86, have been reported to ameliorate neurological impairment in rats with SCI (Yao et al., 2019; Zhang et al., 2019b; Fan et al., 2021). The inhibition of ferroptosis in SCI can prevent the death of a large number of functional nerve cells, such as neurons and oligodendrocytes, which can greatly mitigate the loss of function. Furthermore, current studies have uncovered some molecules that may be involved in the regulation of ferroptosis after SCI (Chen et al., 2020). The nuclear factor E2/heme oxygenase-1 defense pathway inhibits lipid peroxidation to prevent ferroptosis (Ma et al., 2020), and zinc was proven to improve the functional disability after SCI by activating this pathway (Ge et al., 2021). Acyl-coenzyme synthetase long-chain family member 4 (ACSL4), a primary regulator of cellular glycerolipid metabolism, modulates the process of ferroptosis. Upregulated ACSL4 is an essential factor for the occurrence of ferroptosis after SCI (Zhou et al., 2020). Identifying potential ferroptosis targets to minimize cell death after SCI has become a therapeutic need.MicroRNAs (miRNAs) are non-coding single-stranded RNA molecules that post-transcriptionally regulate gene expression. Long non-coding RNAs (lncRNAs) regulate physiological functions at transcriptional and posttranscriptional levels as well as epigenetic levels and are upstream regulators of miRNAs. These non-coding RNAs regulate various cellular functions and affect various pathological processes of diseases. Several studies have demonstrated some functions of non-coding RNAs in processes in SCI, such as neuronal apoptosis, autophagy, oxidative stress, and axonal regeneration (Yu et al., 2015; Guo et al., 2021).
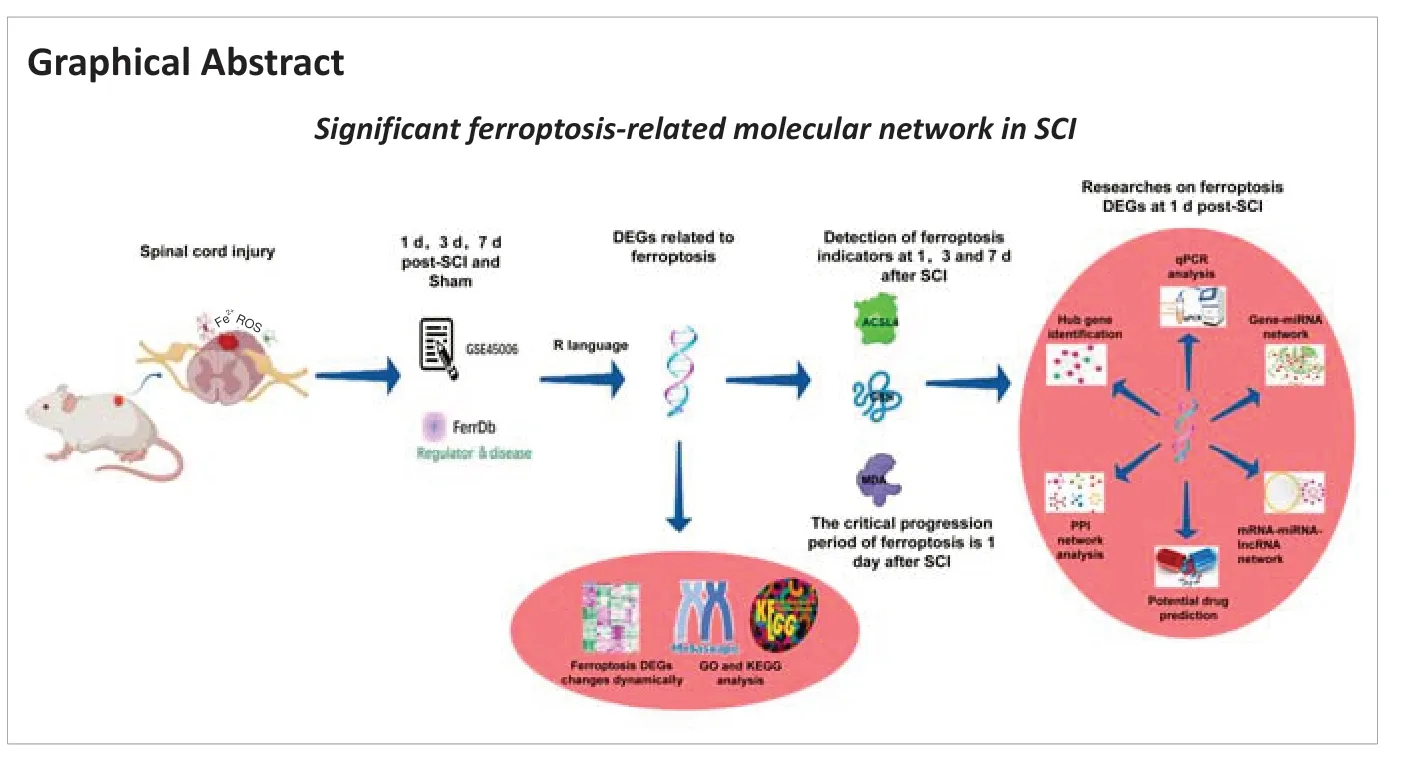
In this study, we examined the major period of ferroptosis involvement (1‒7 days after SCI) and explored key ferroptosis genes and ferroptosis-related regulatory networks in SCI. We performed bioinformatics analysis to screen the genes regulating ferroptosis in SCI. Differentially expressed ferroptosisrelated genes at different time points were obtained by intersecting data from the FerrDb ferroptosis database with differentially expressed genes (DEGs) screened at 1, 3, and 7 days after SCI. We constructed a rat SCI model to determine the critical period of ferroptosis progression within 1‒7 days after SCI. We then identified hub ferroptosis genes, constructed a gene-miRNA/mRNA-miRNA-lncRNA regulatory network, and performed drug prediction.
Methods
Animals
Rats develop urinary incontinence after SCI. Female rats are usually chosen as animal models of SCI because their urethra is short and straight, which is easier to care for and less prone to urinary infection (Wrathall and Emch, 2006; Cizkova et al., 2020). Sixty 7-week-old adult female Wistar rats weighing 200 ± 10 g were purchased from the Charles River Laboratories, Beijing, China (license No. SCXK (Jin) 2016-0006). The rats had free access to water and food and were kept in a balanced light and dark environment with humidity and temperature control.
The animals were randomly divided into four groups: the sham group (n
= 18), 1 day post-SCI group (n
= 18), 3 days post-SCI group (n
= 12), and 7 days post-SCI group (n
= 12). The SCI model was induced as described below.All experimental procedures were carried out in the animal unit (Tianjin Medical University General Hospital, Tianjin, China) following procedures authorized by the Institutional Animal Welfare and Ethical Committee of Tianjin Medical University General Hospital (approval No. IRB2021-DW-76; approved on October 29, 2021).
SCI model
A standard SCI model was established using a modification of Allen’s method (Koozekanani et al., 1976). The rats were anesthetized with 1.5 mL/kg 3% pentobarbital (MERCK, Darmstadt, Hesse-Darmstadt, Germany) by intraperitoneal injection, and the dorsal skin was prepared for the operation. A midline incision of approximately 1.5 cm on the dorsum was determined under the guidance of bone markers. T10 vertebral laminae were fully exposed after blunt dissection of the paraspinal muscles. Laminectomy was performed at the level of the T10 vertebrae. We used the New York University Impactor device (NYU, New York, NY, USA) to prepare the SCI model in rats. After the 10-g node (2.5 mm in diameter) was accurately aligned to a specific spinal segment, the impact force caused by free fall from a height of 25 cm was used to induce severe hematoma at the hit site. The area of hematoma presents dynamic changes over time after SCI. A severe hematoma occurs immediately after injury from the primary violence. In the hyperacute phase, the hematoma continues to aggravate because of bleeding and inflammatory reaction, and it gradually alleviates in the later phase (Kjell and Olson, 2016; Ahuja et al., 2017). The contusion can cause transient involuntary spasms of the hindlimbs and stiffness of the tail, which proves that the standardized and homogenized SCI model was successfully prepared. The separated muscles and skin were sutured layer by layer. The bladder of animals was manually expressed three times a day for 1 week post-injury. Animals in the sham group only underwent laminectomy at the T10 level, and the spinal cord was effectively protected. Animals in this group showed normal Basso, Beattie, and Bresnahan locomotor rating scores after the operation (Barros Filho and Molina, 2008).
At 1, 3, and 7 days after SCI, after anesthesia of experimental animals with 1.5 mL/kg 3% pentobarbital and transcardiac perfusion with 4% paraformaldehyde or phosphate-buffered saline, the spinal cord specimens were collected for subsequent analyses.
Collection and grouping of microarray data
A dataset (GSE45006) of gene expression from rats with SCI was downloaded and compiled from the Gene Expression Omnibus database (Edgar et al., 2002) (http://www.ncbi.nlm.nih.gov/geo/). The Gene Expression Omnibus database was introduced for analysis using expression profiling by array under the National Center for Biotechnology Information platform (http://www.ncbi.nlm.nih.gov/gds/).
GSE45006 includes two groups, the sham group (n
= 4) and the SCI group (n
= 20), for a total of 24 rat spinal cord samples. The 20 SCI samples were collected at different time points after SCI: 1, 3, 7, 14, and 56 days (n
= 4/subgroup).The GPL1355 platform of the Affymetrix Rat Genome 230 2.0 Array (Affymetrix, Santa Clara, CA, USA) was used for extracted RNA sequence analysis. The dataset was provided by Chamankhah et al. (2013).
Differential expression analysis and identification of ferroptosis DEGs
To screen the DEGs at different time points (1, 3, and 7 days) following SCI, the limma package based on the R language (v4.0.5, R Foundation, Vienna, Austria) was used to implement the primary task. The criterion was |log2 (fold change) > 1| andP
. adj less than 0.05. Visualization of DEGs in the three groups was achieved through the ggplot2 package in R.A dataset containing 259 genes related to ferroptosis was downloaded from FerrDb (http://www.zhounan.org/ferrdb/), a database focused on ferroptosis. An interactive online tool for creating Venn diagrams was used to calculate the intersection of the above datasets to obtain ferroptosis DEGs at various times after SCI. We also displayed the time-course expression changes of the ferroptosis DEGs after SCI using heatmaps.
Gene Ontology annotation and pathway enrichment analysis
Gene Ontology (GO) annotation of ferroptosis-related DEGs at each time point (1, 3, and 7 days) following SCI was performed using Metascape (Zhou et al., 2019) (https://metascape.org), an online tool for gene functional annotation. The complete annotation analysis involves the biological processes (BP), cellular composition, and molecular function.
We first applied “org. Rn.eg.db” to convert the gene symbols to entrezIDs. Kyoto Encyclopedia of Genes and Genomes (KEGG) enrichment analysis using clusterProfiler package in R was performed, and the results were visualized using the ggplot2 package.
Determination of glutathione
To evaluate glutathione (GSH) in spinal cord from the animal model, we ground spinal cord tissue containing a center of injury under ice-cold conditions to obtain a tissue homogenate. GSH was determined using a total GSH assay kit (Cat# S0052; Beyotime Biotechnology, Shanghai, China) following the manufacturer’s instructions. The standard curve was first measured, and the optical density (OD)-value was detected at 412 nm by a multiscan spectrum (Infinite M200 Pro, TECAN, Mannedorf, Switzerland). By comparing the OD-value of the samples to the standard curve, the GSH concentration in the samples was determined. Four biological replicates were analyzed in each group.
Malondialdehyde detection
For lipid peroxidation level detection, a commercial kit (Cat# S0131S; Beyotime Biotechnology) was used to measure malondialdehyde (MDA) in spinal cord tissue at different times after injury in accordance with the manufacturer’s protocol. Tissue lysates were prepared using ice-cold lysis buffer. After homogeneous grinding and oscillation, spinal cord tissue homogenates were centrifuged at 10,000 ×g
for 10 minutes at 4°C, and the supernatants were collected. We determined the standard curve based on the absorbance measured at 532 nm of the standards of different concentrations. The OD value of the sample was compared with the standard curve to calculate the MDA content. MDA levels were normalized to grams of tissue. Four biological replicates were analyzed in each group.Immunofluorescence staining
The dissected T10 spinal cords from rats at various time points (1, 3, and 7 days) after SCI were immersed in 4% paraformaldehyde. After fixation for 1 day, each specimen was sequentially transferred to 10%, 20%, and 30% sucrose solutions for gradient dehydration for 96 hours in total and embedded by optimal cutting temperature compound before being frozen. The tissue was sliced into a 10-µm thick transverse section. The sections were subjected to three washes with TBST (50 mM Tris-HCl, pH 8, 150 mM NaCl, 0.2% Triton X-100) and immersed in a blocking solution (0.1% Triton X-100, 5% normal goat serum in TBST) at room temperature for 1 hour; sections were then incubated with primary rabbit monoclonal antibody against ACSL4 (1:200; Abcam, Cambridge, MA, USA, Cat# ab155282; RRID: AB_2714020) in blocking solution at 4°C overnight. The sections were then rinsed three times with TBST and incubated with secondary antibodies (goat anti-rabbit IgG H&L Alexa Fluor® 488, 1:500; Abcam, Cat# ab15007; RRID: AB_301568) at 37°C for 1 hour. Samples were sealed with mounting medium with 4′,6-diamidino-2-phenylindole (Cat# ab104139, Abcam) for 5 minutes following another three washes with TBST. Imaging was obtained using a fluorescence microscope (TH4-200; Olympus, Tokyo, Japan), and the relative fluorescence intensity of ACSL4 was quantified using ImageJ software 1.52a (National Institutes of Health, Bethesda, MD, USA) (Schneider et al., 2012).
Construction of a protein-protein interaction network and module analysis
To explore the protein-protein interaction (PPI), the ferroptosis DEGs at 1 day post-SCI were submitted to the STRING database (http://string-db.org) (Szklarczyk et al., 2015), a free and accessible database for screening and integrating data (Page et al., 1999). The sample type was “Rattus norvegicus.” The minimum interaction score ≥ 0.4 was determined, and the disconnected nodes were hidden in constructing the PPI network. The Cytoscape software (version 3.7.2) was used for visualization (Shannon et al., 2003). Subsequently, the molecular complex detection plugin exploring the significant modules of the required network was used to identify core clusters with the criterion of node score cut-off = 0.2, degree cut-off = 2, k-score = 2, and max depth = 100. We showed the top three modules.
Discovery and analysis of hub genes
We used CytoHubba, an application of Cytoscape, to screen the hub ferroptosis genes with a standard of degree greater than 10. The hub genes were uploaded to Metascape to gain detailed functional insight into the genes. We performed Spearman correlation analysis of the hub ferroptosis genes using the corrplot package.
Real-time polymerase chain reaction
T10 spinal cords were harvested 1 day after SCI or after laminectomy and immediately frozen and stored at ‒80°C (six samples in each group). Total RNA was extracted from frozen spinal cord tissues using Trizol reagent (Cat# R0016; Beyotime Biotechnology). The HiFiScript gDNA Removal RT MasterMix kit (Cat# CW2020M; CWBio, Beijing, China) was used to synthesize complementary DNA from purified RNA. To examine the expression level ofSTAT3
,TLR4
,HMOX1
,JUN
,ATF3
,RELA
,PTGS2
,MAPK1
,MAPK9
,VEGFA
in the SCI group and the sham group, real-time polymerase chain reactions were performed in a total volume of 20 µL containing 2 µL complementary DNA, 10 µL 2× UltraSYBR One Step Buffer (Cat# CW0659S; CWBio), and 8 µL of each specific primer (1 µM). Reactions were performed in the LightCycler® 96 instrument (Roche, Basel, Switzerland) in accordance with the manufacturer’s instruction. Primers for each gene are listed inTable 1
. The reaction conditions were 95°C for 10 minutes for pre-denaturation; remaining cycles of 95°C for 15 seconds and 60°C for 1 minute; and the last cycle was 95°C for 15 seconds, 60°C for 1 minute, 95°C for 15 seconds and 60°C for 15 seconds.GAPDH
mRNA was used for normalization. Data were calculated relative to the expression of GAPDH mRNA using the 2method (Livak and Schmittgen, 2001).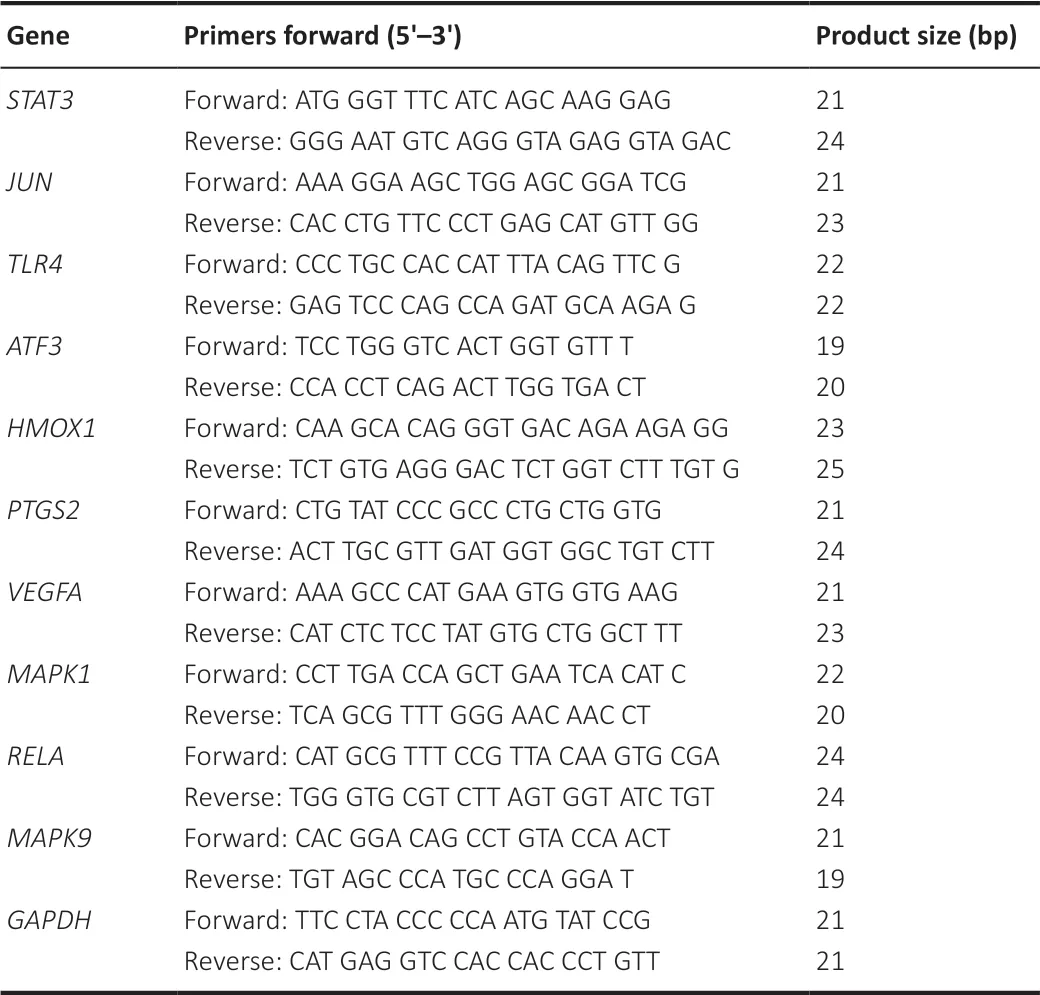
Table 1 |Primers of qPCR used in this study
Gene-miRNA interactions
The potential gene-miRNA interactions related to ferroptosis were predicted using miRWalk 2.0 software (Sticht et al., 2018) (http://mirwalk.umm.uniheidelberg.de/). The cross-linked miRNAs were identified from a screening of miRDB and miRWalk databases to reinforce reliability and accuracy. miRNAs with more than two cross-linked genes were considered crucial and selected for analyses. We used Cytoscape software to construct the ferroptosis-related gene-miRNA network and labeled the miRNAs cross-linked with more than two genes (≥ 2).
lncRNA prediction
Ferroptosis-related miRNAs with more than two cross-linked genes were submitted to miRbase (Kozomara et al., 2019) (https://www.mirbase.org/) for sequence comparison with human miRNAs to obtain co-expressed miRNAs. We predicted target lncRNAs for the identified conservative miRNAs using StarBase 2.0 (Li et al., 2014) (http://starbase.sysu.edu.cn/index.php), following a screening criterion of very high stringency (> 5). From the above screening, we constructed a lncRNA-miRNA-mRNA regulatory network related to ferroptosis in SCI. Cytoscape was used to visualize this network.
Drug prediction
The prediction of potential drugs or molecular compounds that interacted with ferroptosis DEGs was performed using the Enrichr platform (Jeon et al., 2021) (https://maayanlab.cloud), an accessible resource for collecting and integrating massive amounts of gene function information that can realize the discovery of possible targeted drugs for sensitive genomes based on the Drug Signatures database (DSigDB) (Yoo et al., 2015). The top 10 drugs in terms of theP
-value were identified.Statistical analysis
No statistical methods were used to predetermine sample sizes; however, our sample sizes are similar to those reported in previous publications (Duan et al., 2018; Yao et al., 2019; Li et al., 2021). No animals or data points were excluded from the analysis. For ACSL4 expression identification and MDA and GSH content detection experiments, a total of 48 rats were used (three experiments with four subgroups each (n
= 4/subgroup)); for the real-time polymerase chain reaction (qPCR) experiment, a total of 12 rats were used. The evaluators who performed experimental tests were strictly blinded to the groups. We used GraphPad Prism (Windows 8.02, GraphPad, San Diego, CA, USA, www.graphpad.com) to acquire graphics and perform statistical analysis. Data are shown as mean ± standard deviation (SD). Determination of the difference for ferroptosis indicators at different time points was made using one-way analysis of variance followed by Tukey’spost hoc
test. In the qPCR experiment, Student’st
-test was chosen to determineP
-values.P
< 0.05 was considered to indicate statistical significance.Results
Identification of ferroptosis DEGs at different time points following SCI
Previous studies showed that ferroptosis mainly occurs during the early phase after SCI (Yao et al., 2019; Zhang et al., 2019b; Shen et al., 2020), and therefore we obtained gene expression profiling of the sham and injury groups, including the samples from 1 ,3 and 7 days post-SCI (Additional Table 1
). Rat models of SCI were established to examine indicators associated with ferroptosis at these time points. Bioinformatics combined with experiments allowed us to explore the pathological process of ferroptosis in SCI. We examined DEGs in SCI model at various time points after SCI and identified 3716, 2414, and 2375 DEGs at 1, 3 and 7 days post-SCI, respectively (Figure 1A–C
). The principal component analysis results of the 1, 3 and 7 days post-SCI groups and the sham group are shown inAdditional Figure 1A–C
andAdditional Table 2
. The identified DEGs of the three subgroups were intersected with the 259 ferroptosis genes from the FerrDb database. The intersecting genes are displayed in a Venn diagram inFigure 1D
, and these genes were considered as ferroptosis DEGs after SCI at different time points. The results fromFigure 1D
show that 48 ferroptosis DEGs were identified in the 1 day after SCI group, 44 ferroptosis DEGs were identified in the 3 days after SCI group, and 27 ferroptosis DEGs were identified in the 7 days after SCI group.Figure 1E
shows the ratio of ferroptosis DEGs screened at different times, and the result shows that the proportion of ferroptosis DEGs was largest 1 day after injury.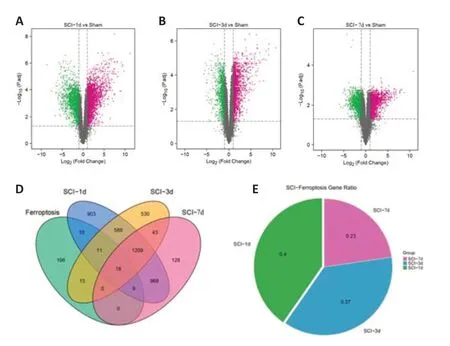
Figure 1 |Ferroptosis DEGs at different time points after SCI. (A‒C) The three volcano plots show DEGs between the sham group and 1 (A), 3 (B), and 7 (C) days post-SCI groups. The criterion of |log2 (fold change) > 1| and P. adj < 0.05 was used. The purple, black, and green points represent up-regulated genes, genes with no significant difference, and down-regulated genes, respectively. (D) The ferroptosis DEGs were obtained after intersecting the DEGs with the ferroptosis database. The Venn diagram shows that 48, 44, and 27 ferroptosis DEGs were identified in the groups at 1, 3, and 7 days following SCI, respectively. (E) The pie chart visually compares the ratio of ferroptosis DEGs screened at different times. DEG: Differential expressed gene; SCI: spinal cord injury.
Temporal changes of ferroptosis DEGs expression
The heat map and data inFigure 2A
andAdditional Table 3
show the changes of ferroptosis DEG expressions at various times after SCI. The top 10 most significant ferroptosis genes in the expression level at each time point (1, 3, and 7 days) following the injury are shown inFigure 2B
. Together these results identified 31 up-regulated and 17 down-regulated ferroptosis genes at 1 day after SCI, 33 up-regulated and 11 down-regulated ferroptosis genes at 3 days after SCI, and 20 up-regulated and 7 down-regulated ferroptosis genes at 7 days after SCI.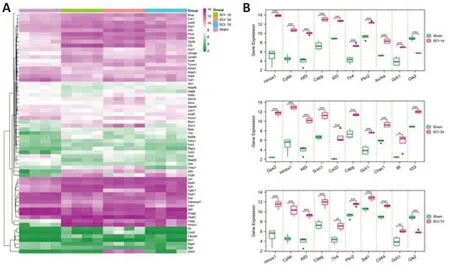
Figure 2 |The temporal change of the expression level of ferroptosis DEGs after SCI.(A) Heat map of all ferroptosis DEGs identified at different times after SCI. Green indicates down-regulation, and purple indicates up-regulation. The four columns on the left (indicated by purple bar on the top) are the sham group. The other columns are SCI groups at different time points (indicated by green, orange and blue bars on the top). (B) The boxplot of the top 10 significant differentially expressed ferroptosis-related genes at each time point (1, 3, and 7 days, from top to bottom) following SCI. ***P < 0.001. DEG: Differentially expressed gene; SCI: spinal cord injury.
GO enrichment analysis of global ferroptosis DEGs
The differentially expressed ferroptosis-related genes were submitted to Metascape for GO enrichment analysis involving BP, cellular composition and molecular function. In this enrichment analysis, we mainly focused on BP, which is of great significance for understanding the role of these genes in the pathogenesis of SCI.
In the DEGs related to ferroptosis identified at 1 day post-SCI, the genes were significantly enriched in cellular response to chemical stress, apoptotic signaling pathway, response to growth factor, inflammatory response and reactive oxygen species metabolic process in the BP category (Figure 3A
). At 3 days post-SCI, the DEGs related to ferroptosis were primarily enriched in response to oxidative stress, nutrient levels, toxic substances, reactive oxygen species metabolic process, and positive regulation of cell death in the BP category (Figure 3B
). At 7 days post-SCI, DEGs related to ferroptosis were primarily enriched in regulation of apoptotic signaling pathway, positive regulation of endothelial cell proliferation, regulation of DNAtemplated transcription in response to stress, cellular response to oxidative stress, and wound healing involved in an inflammatory response in the BP category (Figure 3C
).KEGG pathway analysis of global ferroptosis DEGs
KEGG enrichment analysis of the ferroptosis DEGs was performed with clusterProfiler package in R. The top 15 terms of the results are shown inFigure 4
in the form of a bubble chart. We found that the ferroptosis DEGs at 1, 3 and 7 days after SCI were enriched in the following pathways: mitophagy, hypoxia inducible factor-1 signaling pathway, necroptosis, and NOD-like receptor signaling pathway. The top 20 KEGG enrichment results are shown inAdditional Table 4
. These enriched pathways are inextricably linked to the occurrence and progression of ferroptosis (Basit et al., 2017; Feng et al., 2021; Mu et al., 2022).The effect of ferroptosis in SCI are different at various times
ACSL4, which influences lipid composition, acts as an important component for ferroptosis execution (Doll et al., 2017). ACSL4 has been considered as a ferroptosis related-marker (Yuan et al., 2016). Our analysis of DEGs related to ferroptosis also showed that ACSL4 expression changes after SCI. We measured ACSL4 expression in the spinal cord at various time points after SCI by immunofluorescence staining and found that ACSL4 expression was upregulated at 1 day after SCI compared with 3 and 7 days after injury (Figure 5A
andB
).Ferroptosis induced by iron overload is characterized by lipid peroxidation. MDA, the final product of lipid oxidation, inhibits mitochondrial respiratory chain complexes and critical enzyme activities, and it can also exacerbate membrane damage (Ayala et al., 2014; Rui et al., 2020). Therefore, the level of MDA can reflect the degree of lipid peroxidation. We found that the maximal surge in MDA content occurred within 1 day after SCI (Figure 5C
).GSH plays a vital role in the antioxidant protection of cells because of its ability to degrade toxic lipid peroxides to nontoxic fatty alcohols catalyzed by glutathione peroxidase 4 (GPX4) (Ursini and Maiorino, 2020). We found that GSH levels were clearly depleted on the first day after SCI, which indirectly indicates that the progression of ferroptosis may be more severe and drastic at this time point (Figure 5D
).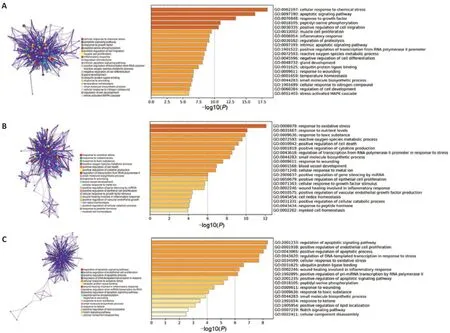
Figure 3 |Gene Ontology (GO) enrichment analysis of ferroptosis DEGs at different time points after SCI.(A‒C) Metascape analysis of GO annotation of ferroptosis DEGs at 1 day (A), 3 days (B), and 7 days (C) following SCI. The bar charts of the top 20 GO terms were drawn on the basis of P-value and the percentage of genes; terms with P-value < 0.01 are statistically significant. DEG: Differentially expressed gene; GO: Gene Ontology; SCI: spinal cord injury.
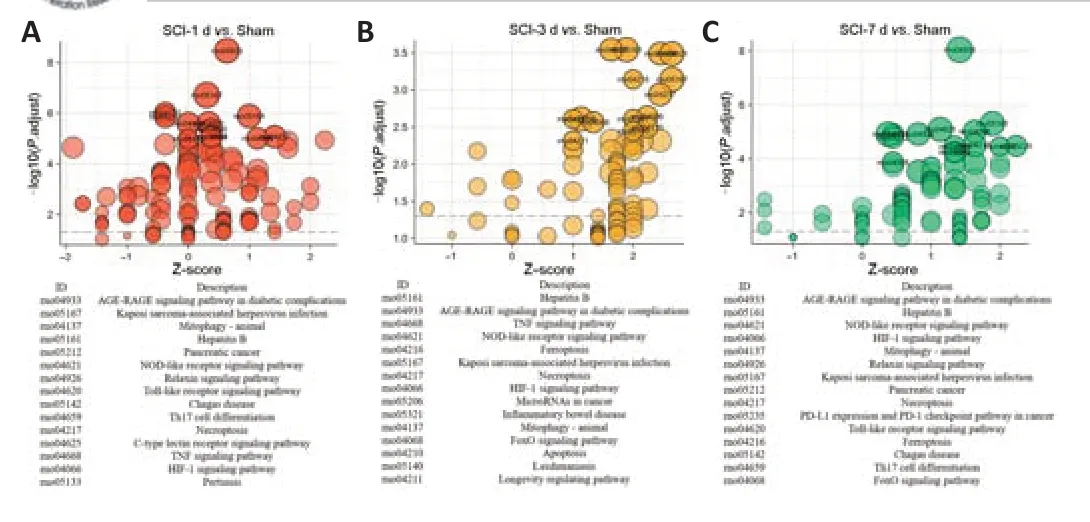
Figure 4 |KEGG enrichment analysis of ferroptosis DEGs at different time points after SCI.(A‒C) KEGG enrichment analysis based on the clusterProfiler package was performed ferroptosis DEGs at each time point (1 day (A), 3 days (B), and 7 days (C) after SCI). Z-score is the colored bar plot of KEGG terms. KEGG ID is on the x-axis, and the negative log P-value is on the y-axis. The color intensity represents the value of the Z score. A higher Z score indicated the KEGG term as an increasing term, while the lower Z score indicated it as a decreasing KEGG term. DEG: Differentially expressed gene; KEGG: Kyoto Encyclopedia of Genes and Genomes; SCI: spinal cord injury.
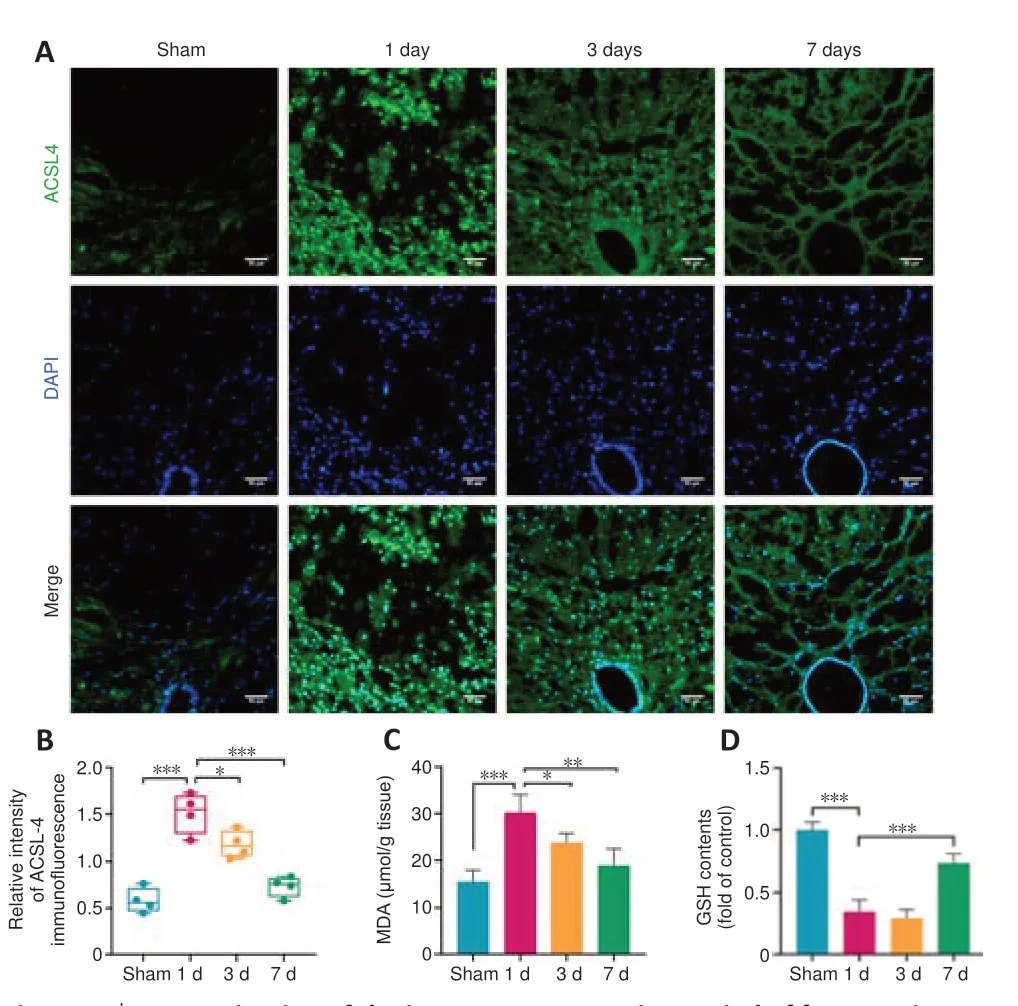
Figure 5 |Determination of the important progression period of ferroptosis following SCI.(A) Immunofluorescence imaging of ACSL4+ cells (green) in transverse sections at the central canal area and dorsal spinal cord of the injury epicenter. Scale bars: 50 µm. (B) The relative fluorescence intensity of ACSL4 was quantified in the injury epicenter. The increased expression of ACSL4 was observed at 1 day after SCI. (C) MDA detection results. The maximal surge in MDA content occurred within 1 day after SCI. (D) GSH contents were measured in injured spinal cord samples. GSH contents were depleted on the first day after SCI. Data are expressed as the mean ± SD (n = 4). *P < 0.05, **P < 0.01, ***P < 0.001 (one-way analysis of variance followed by Tukey’s post hoc test). ACSL4: Acyl-coenzyme A synthetase long-chain family member 4; DAPI: 4′,6-diamidino-2-phenylindole; GSH: glutathione; MDA: malondialdehyde; SCI: spinal cord injury.
Together, evaluation of the molecular markers of ferroptosis (ACSL4, GSH and MDA) indicates that 1 day post-SCI may be the peak of ferroptosis progression.
PPI network construction and module analysis based on ferroptosis DEGs identified at 1 day after SCI
Our DEG analysis identified the highest numbers ferroptosis DEGs at 1 day after injury compared with the other time points. Therefore, we conducted network analysis and exploration of key candidates for ferroptosis genes expressed at 1 day post-SCI.
To explore the interactions between the proteins expressed by the ferroptosis DEGs at 1 day after SCI, we constructed a PPI network using the STRING database. The differentially expressed ferroptosis-related genes were uploaded to the database with combined scores > 0.4, and visualization was achieved using Cytoscape software. A total of 41 nodes and 124 edges were discovered in the PPI network (Figure 6A
). In the analysis of the PPI network, the three most significant modules containing 21 DEGs were identified by the molecular complex detection plugin (Figure 6B
). Under the criterion of degrees more than 10, we used the CytoHubba plugin to determine a total of 10 hub genes, which has important implications for identifying potential key ferroptosis regulatory molecules in SCI. The hub genes areSTAT3
,JUN
,TLR4
,ATF3
,HMOX1
,MAPK1
,MAPK9
,PTGS2
,VEGFA
, andRELA
(Figure 6C
). The correlation between each pair of hub genes is shown inFigure 6D
. We used Metascape to perform GO and KEGG analysis on the 10 hub genes. The enriched genes were mainly involved in the regulation of stress-activated MAPK cascade, response to tumor necrosis factor and positive regulation of I-kappaB kinase/NF-kappaB signaling (Figure 6E
).Validation of hub genes by qPCR
We performed qPCR on rat spinal cord tissue collected 1 day after SCI to validate the reliability of the top 10 hub ferroptosis genes obtained from analysis of the GSE45006 database. In line with the results of the mRNA microarray, the expression levels ofSTAT3
,JUN
,TLR4
,ATF3
,HMOX1
,PTGS2
, andRELA
were upregulated in the SCI group compared with the sham group (Figure 6F
). Moreover, the expression levels ofVEGFA
,MAPK1
andMAPK9
were downregulated. Overall, the qPCR results were consistent with data mining.Mining and interaction of associated miRNAs
Next, the ferroptosis DEGs 1 day after injury that may be involved in the pathogenesis of SCI were uploaded in miRWalk 2.0, and gene-miRNA interactions were obtained (Figure 7
). The network contains 193 nodes and 200 edges. We identified 31 miRNAs (labeled with green in the network) that were cross-linked with multiple ferroptosis-related DEGs (≥ 2), including rno-miR-1193-3p, rno-miR-7b and rno-miR-493-5p. We speculate that these miRNAs may play a regulatory role in the occurrence and progression of ferroptosis after SCI.Construction of the lncRNA-miRNA-mRNA regulatory network related to ferroptosis
We conducted a conservative assessment of the identified miRNAs with crosslinked genes using miRbase, and 10 conservative miRNAs, including rno-let-7b-5p, rno-let-7g-5p, rno-miR-185-5p, rno-miR-330-5p, rno-miR-92b-3p, rnomiR-96-5p, rno-miR-16-5p, rno-let-7c-5p, rno-let-7i-5p and rno-miR-15b-5p, were identified for lncRNA prediction. A ferroptosis-related miRNA-lncRNA regulatory relationship was explored using StarBase 2.0. The network contains 66 lncRNAs with very high stringency (> 5) and the 10 conserved miRNAs. In addition, this analysis revealed the potential regulatory mechanism of miRNAs and lncRNAs of ferroptosis in SCI. Twelve ferroptosis DEGs in this interaction were also identified. Together these findings reveal an mRNA-miRNA-lncRNA regulation network related to ferroptosis in SCI (Figure 8
).Prediction of potential drugs
We next used the DSigDB database to prediction of candidate drugs that might target the 10 hub ferroptosis DEGs (Figure 6G
). The identified drugs included 1,9-pyrazoloanthrone, capsaicin, curcumin, dibenziodolium, simvastatin, N-acetyl-L-cysteine, Go 6976, fenretinide, acetovanillone, and bortezomib. We speculate that these 10 drugs may potentially exert therapeutic affects in SCI by targeting proteins encoding by the identified key genes in the ferroptosis pathway.Table 2
lists information of candidate druggene interactions obtained from the DSigDB database.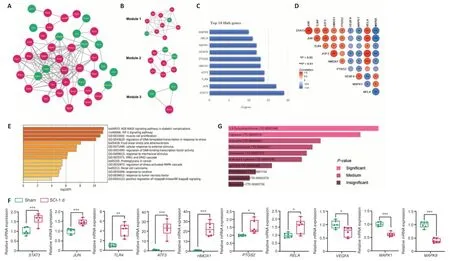
Figure 6 |PPI network construction and the discovery and validation of hub genes.(A) PPI network of ferroptosis DEGs identified 1 day post-SCI were obtained from the STRING database. The minimum interaction score ≥ 0.4 was determined in constructing the network. Green indicates down-regulation and purple indicates up-regulation. (B) The top three modules screened from the PPI network with the criterion of node score cut-off = 0.2, degree cut-off = 2, k-score = 2, and Max depth = 100. (C) Bar plot of the top 10 hub genes with the standard of degree greater than 10. (D) The Spearman correlation analysis of the top 10 hub ferroptosis genes. *P < 0.05, **P < 0.01, ***P < 0.001. (E) The bar chart of functional enrichment analysis based on top 10 hub genes using Metascape. (F) mRNA expressions of STAT3, JUN, TLR4, ATF3, HMOX1, PTGS2, RELA, VEGFA, MAPK1 and MAPK9 genes were measured in the injured spinal cord and normal samples. Data are expressed as the mean ± SD (n = 6). *P < 0.05, **P < 0.01, ***P < 0.001 (Student’s t-test). (G) Predicted top 10 drug compounds targeting ferroptosis to repair SCI according to P-value. A brighter color on the bar chart indicates a higher significance. ATF3: activating transcription factor 3; DEGs: differential expressed genes; HMOX1: heme oxygenase 1; JUN: Jun proto-oncogene; MAPK1: mitogen-activated protein kinase 1; MAPK9: mitogen-activated protein kinase 9; PPI: protein-protein interaction; PTGS2: prostaglandin-endoperoxide synthase 2; RELA: RELA proto-oncogene; SCI: spinal cord injury; STAT3: signal transducer and activator of transcription 3; TLR4: Toll-like receptor 4; VEGFA: vascular endothelial growth factor A.

Figure 7 |Interaction network between ferroptosis DEGs identified at 1 day post-SCI and the targeted miRNAs.The blue circles represent ferroptosis genes, and the orange circles represent miRNAs. The green circles represent miRNAs that have cross-linked genes. DEGs: Differential expressed genes; miRNAs: microRNAs; SCI: spinal cord injury.
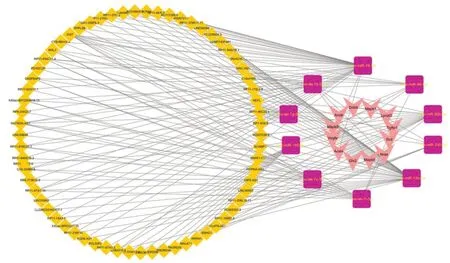
Figure 8 |Ferroptosisrelated mRNA-miRNAlncRNA regulatory networks in SCI.The V shapes in pink represent ferroptosis genes, the purple squares represent miRNAs, and the yellow diamonds represent lncRNAs. lncRNA: Long non-coding RNA; miRNA: microRNA; SCI: spinal cord injury.

Table 2 |Predicted top 10 drug compounds targeting ferroptosis to repair SCI
Discussion
In this study, we focused on the mechanisms regulating ferroptosis in the acute and subacute phase of SCI and screened ferroptosis DEGs. Our results identified 48, 44, and 27 genes at 1, 3, and 7 days after SCI, respectively. The results of GO and KEGG enrichment analyses for the ferroptosis DEGs reveal signaling pathways and biological processes associated with ferroptosis. Analysis of the expression of ACSL4, GSH depletion, and MDA production level indicated that the important period of ferroptosis progression may be 1 day after the injury. This result was in line with the highest number of DEGs identified 1 day after injury. To further explore key ferroptosis molecules, we constructed a PPI network and screened the top 10 hub genes using the ferroptosis DEGs identified at 1 day following SCI. We constructed a ferroptosis-related mRNA-miRNA-lncRNA network in SCI, involving 66 lncRNAs, 10 miRNAs, and 12 genes. Furthermore, 10 compounds were screened as potential drugs that may target ferroptosis to repair SCI.
Biomarkers that are associated with ferroptosis are used to determine the critical period after SCI (Chen et al., 2021). Our results showed that ACSL4 expression, MDA production, and GSH depletion showed marked changes on day 1 after SCI. Therefore, we focused on the DEGs identified at this time point. Through PPI network construction, we identified the top 10 hub genes, includingSTAT3
,JUN
,TLR4
,ATF3
,HMOX1
,PTGS2
,VEGFA
,MAPK1
,RELA
andMAPK9
genes, and validated their expression in the spinal cord 1 day after injury using qPCR. TLR4 (Toll-like receptor 4) is a key regulator in the inflammatory pathway. A previous study showed that up-regulated TLR4 triggers oxidative stress and enhances p38-MAPK signaling, causing neuronal ferroptotic death (Zhu et al., 2021). HMOX1 (heme oxygenase 1), a stress-inducing enzyme, catalyzes the degradation of heme to biliverdin carbon monoxide and iron. HMOX1 mediates the upregulation of glutathione peroxidase 4 to prevent neuronal ferroptosis, thereby promoting functional recovery after SCI (Ge et al., 2021). ATF3 (activating transcription factor 3) is a common stress sensor that inactivates the amino acid antiporter system Xcby suppressing SLC7A11 expression in a p53-independent manner (Wang et al., 2020). Previous studies have confirmed a significant down-regulation of xCT expression after SCI (Yao et al., 2019). Therefore, we speculate that ATF3 may be involved in this regulatory process. No reports have examined the relationship of STAT3 (signal transducer and activator of transcription 3), PTGS2 (cyclooxygenase-2), MAPK1/9 (mitogen-activated protein kinase 1/9), RELA/nuclear factor-kappaB (NF-kappaB), VEGFA (vascular endothelial growth factor A) and JUN (Jun proto-oncogene) with ferroptosis and SCI. Because of their high degree value in the PPI, more research is warranted to explore their possible involvement in ferroptosis and SCI.In this study, we constructed a gene-miRNA/mRNA-miRNA-lncRNA network from the ferroptosis DEGs identified 1 day following SCI. This network will provide a reference for the study of the regulatory relationship between potential ferroptosis-related lncRNAs and miRNAs on target genes. The identification of the miRNAs and lncRNAs in the network may also provide insights into the mechanisms of gene regulation in ferroptosis during SCI. The network included 162 miRNAs potentially associated with ferroptosis. We also uncovered 10 conserved miRNAs linked to more than two differential expressed ferroptosis-related genes. A previous study showed that let-7b-5p induced the occurrence of ferroptosis by upregulating p53 (Dong et al., 2021). In addition, a total of 66 lncRNAs were predicted to be associated with conservative ferroptosis-related miRNAs.
Targeting ferroptosis is of great significance for the repair of SCI. The glial scar formed by excessively activated astrocytes obstructs axonal regeneration during the chronic phase. Ferroptosis inhibitors also play a significant role in controlling the formation of glial scar, which has positive consequences for long-term functional improvement (Hao et al., 2017; Zhang et al., 2019b). Additionally, the inflammatory response is persistent throughout SCI. Given the close relationship between ferroptosis and inflammation, manipulation of ferroptosis may help reduce inflammatory toxicity and further ameliorate severe pathological changes after SCI (Sun et al., 2020; Wang et al., 2021).
We used DSigDB database to identify the top ten candidate pharmacological compounds predicted by the hub ferroptosis DEGs: 1,9-pyrazoloanthrone, capsaicin, curcumin, dibenziodolium, simvastatin, N-acetyl-L-cysteine, Go6976, fenretinide, acetovanillone and bortezomib. This list of compounds will provide important directions for future translational research and identifying potential strategies for treatment of SCI by targeting ferroptosis. Notably, several of these drugs have been linked to the repair of SCI or processes related to SCI. Curcumin promotes the release of neural factors and anti-inflammatory factors and enhances cell viability (Kocaadam and Şanlier, 2017; Guo et al., 2020). Fenretinide resists oxidative stress and inflammation after SCI (López-Vales et al., 2010). Simvastatin, a hydroxymethylglutaryl coenzyme A reductase inhibitor, acts on the Wnt/β-catenin signaling pathway to reduce neuronal cell loss and promote recovery after injury (Gao et al., 2016). A study showed that N-acetyl-L-cysteine has a positive role in the functional recovery after spinal cord ischemia and reperfusion injury by inhibiting the occurrence of autophagy. Of note, Go6976, one of the protein kinase inhibitors, significantly reduces peroxide production and inhibits erastin-induced ferroptosis (Xie et al., 2017). An analog acetovanillone of dibenziodolium has been reported to inhibit reactive oxygen species production, thereby inhibiting ferroptosis (Doll et al., 2019; Zhang et al., 2019a). Previous studies have shown that SP600125, a c-Jun N-terminal kinase (JNK) pathway inhibitor, significantly improves exercise performance following SCI (Martini et al., 2016; Kong et al., 2019). Therefore, we speculate that 1,9-pyrazoloanthrone, another c-Jun N-terminal kinase inhibitor, may also exert a positive effect on the recovery of SCI. Further exploration on the pharmacological mechanism of these drugs and their relation with ferroptosis DEGs is warranted.
This study has several limitations. First, the study only used bioinformatics analysis to explore the key ferroptosis genes after SCI. Further research into the mechanisms of ferroptosis in SCI is required. Second, we mainly focused on the occurrence and development of ferroptosis at 1, 3, and 7 days post-SCI. The induction and development of ferroptosis in the hyperacute phase after SCI (< 8 hours) should also be explored. In addition, the spatial expression patterns of ferroptosis genes at the epicenter of the injury and across different segments should also be investigated. Furthermore, previous studies have shown that various types of nerve cells, such as neurons and oligodendrocytes, exhibit different susceptibility to ferroptosis (Zhang et al., 2020; Fan et al., 2021). Therefore, the mechanisms underlying the different sensitivity of nerve cells to ferroptosis and the expressions of the DEGs in these nerve cells need to be studied.
In summary, we conducted an in-depth exploration of the expression patterns of ferroptosis genes at different time points in the acute and subacute phases of SCI. We analyzed the BP and signaling pathways of genes related to ferroptosis. Our results confirmed that 1 day after SCI was the critical progression period of ferroptosis. Our subsequent systematic analyses of the ferroptosis DEGs identified during this critical period provide a basis for further exploring the role of ferroptosis in the pathogenesis of SCI. Our results provide insights into the pathological mechanism of ferroptosis in SCI, as well as potential strategies for the diagnosis and treatment of SCI.
Author contributions:
Experiment design and manuscript writing: JZL, BYF, TS, ZJW, SQF; data collection and analysis: JZL, JPZ, XXW; immunostaining, MDA and GSH detection: GJG, JJL, TS; statistical analysis: WYS, DRL. All authors have read and approved the final manuscript.
Conflicts of interest:
The author declares that no conflict of interest exists in this article.
Availability of data and materials:
All data generated or analyzed during this study are included in this published article and its supplementary information files.
Open access statement:
This is an open access journal, and articles are distributed under the terms of the Creative Commons AttributionNonCommercial-ShareAlike 4.0 License, which allows others to remix, tweak, and build upon the work non-commercially, as long as appropriate credit is given and the new creations are licensed under the identical terms.
Open peer reviewer:
Hyun Joon Lee, University of Mississippi Medical Center, USA.
Additional files:
The gene expression profiling of sham, and 1, 3, 7 days after spinal cord injury groups.
The principal component analysis respective results of the 1, 3, and 7 days post-SCI groups with the sham group.
The identified ferroptosis DEGs in 1, 3, 7 days post-SCI.
TOP 20 KEGG enrichment analysis of ferroptosis genes identified 1, 3 and 7 days after SCI.
The principal component analysis results of the 1 (A), 3 (B), and 7 (C) days post-SCI groups and the sham group.
Open peer review report 1.
- 中国神经再生研究(英文版)的其它文章
- Inflammation and retinal degenerative diseases
- Synaptic alterations as a common phase in neurological and neurodevelopmental diseases: JNK is a key mediator in synaptic changes
- Brain-derived neurotrophic factor in main neurodegenerative diseases
- The best of both worlds: mastering nerve regeneration combining biological and nanotechnological tools
- Exosomal miR-23b from bone marrow mesenchymal stem cells alleviates oxidative stress and pyroptosis after intracerebral hemorrhage
- Chlorogenic acid alleviates hypoxic-ischemic brain injury in neonatal mice

