
Effects of single synthetic jet on turbulent boundary layer
2022-08-01 06:01:46JinHaoZhang张津浩BiaoHuiLi李彪辉YuFeiWang王宇飞andNanJiang姜楠
Chinese Physics B 2022年7期
Jin-Hao Zhang(张津浩), Biao-Hui Li(李彪辉), Yu-Fei Wang(王宇飞), and Nan Jiang(姜楠),2,†
1Department of Mechanics,School of Mechanical Engineering,Tianjin University,Tianjin 300350,China
2Key Laboratory of Modern Engineering Mechanics,Tianjin 300350,China
Keywords: turbulent boundary layer,synthetic jet,hairpin vortex,drag reduction
1. Introduction
High efficiency and energy saving is one of the main goals of today’s industrial development, and the flow resistance of fluid will cause great energy loss. The frictional resistance between the turbulent boundary layer and the wall is an important part of the flow resistance, so it is of great significance to reduce the friction drag by controlling the turbulence.The controlling methods can be divided into active control[1–5]and passive control[6–9]according to whether additional energy input is needed. Active control can actively adapt itself to changes in flow conditions through reasonable design to expand the applicable scope of drag reduction.
Park and Choi[10]investigated the effect of uniform blowing and suction from the slit on turbulent boundary layer(TBL) by direct numerical simulation (DNS) and found that the wall friction in the downstream direction of the slot decreases rapidly in the suction process while the opposite scenario occurs in the case of suction. The DNS results acquired by Kametani and Fukagata[11]show that the average influence of suction and blowing is drag reduction,and the blowing control effect is much stronger than the existing active control method. Keirsbulcket al.[12]found that blowing reduces the anisotropy of coherent structure in the near-wall region and the longitudinal integral length scale is inversely proportional to blowing velocity by using hot-wire velocimetry. Baiet al.[13]investigated that the drive wave generated by the piezoelectric ceramic actuator can produce a layer of highly structured streamwise vortex, which creates a barrier effect between the wall and the large-scale coherent structure to achieve the drag reduction effect.
Barton and Glezer[14]proposed that the synthetic jet is a planar turbulent jet formed by the interaction among a series of reversely rotating vortex pairs at the edge of the orifice plate through the periodic movement of the elastic diaphragm in a closed cavity. Parket al.[15]used PIV to study the effects of synthetic jets with different vibration frequencies and incident angles,and found that the drag reduction effect is not uniform under different circumstances. The results presented by Lasagnaet al.[16]describe that the vortex structure generated by the synthetic method is intermittently distributed in the transient flow field and increases in percentage with frequency increasing,but not affected by the yaw angle. Berket al.[17,18]found that the synthetic jet leads to local momentum loss in TBL, which is caused mainly by the vortex structure generated by the interaction between the synthetic jet and TBL.Iuso and Cicca[19]drew a conclusion that a large-scale longitudinal vortex structure with reverse rotation and periodic organization along the spanwise is generated by spanwise inclined circular synthetic jets. Chaudhry and Zhong[20]experimentally explored the flow characteristics of a single circular synthetic jet entering into laminar and turbulent boundary layers respectively,thus effectively studying the interaction between vortex and variable boundary layer.
According to the generating mechanism of hairpin vortex,[21]the research on artificial hairpin vortex has become popular. Now there are three artificial methods of producing hairpin vortices,i.e.,manufacturing a low-speed zone,[22]hemispherical induction,[23,24]and synthetic jets.[25]
Previous studies have concluded that circular synthetic jet can produce drag reduction effect and periodically generate hairpin vortex structure. In this paper, the time-resolved particle image velocimetry(TR-PIV)system is utilized to implement the quantitative measurements of the flow field under the influence of the synthetic jet actuator (SJA), and the wall friction velocity is calculated by the single-pixel ensemble correlation[26,27](SPEC). The velocity fields of streamwisewall–normal plane and streamwise–spanwise plane are collected, and then the generation process of hairpin vortex and the drag reduction mechanism of synthetic jet in these two planes are studied. The rest of this paper is organized as follows. In Section 2, the experimental instruments and measurement methods are described. In Section 3,the generating process of hairpin vortex and the mechanism of drag reduction are investugated. Finally,some conclusions are drawn in Section 4.
2. Experimental setup
The present experiments were carried out in the lowspeed recirculating water channel facility at the Tianjin University. The channel was half-closed,creating a test section of 6.20 m×0.29 m×0.38 m (length×width×height as indicated in Fig.1(a)). The bottom and the sidewalls of the test section was made of plexiglass to allow light access.
The researches were conducted in two parts, including the measurement of TBL on a classical plate and the measurement of that with SJA. In each part, the velocity field of the streamwise–wall–normal plane and the streamwise–spanwise plane were measured. As shown in Fig. 1, the side view and the top view of the two planes’shooting process are given respectively. In the experiment, the freestream turbulence intensity was less than 1.5% at a free-stream velocityU∞= 0.255 m/s, and the kinematic viscosity of water wasυ=9.6×10⁻⁷m2/s. The turbulent boundary layers were developed on a smooth flat plate,and a 2-mm-diameter tripwire was fixed at 0.2 m in the downstream direction of the leading edge to stimulate into the full-developed TBL.The plate was 2.9-m long, 0.25-m wide, and 0.02-m thick, which had a 4:1(long axis: short axis)elliptical leading edge. A circular hole with a diameter of 4 mm was made at the center line 2.45 m away from the leading edge. An actuator was mounted under a cavity at the bottom of the plate and generated the synthetic jet periodically through the hole after giving a sinusoidal signal with a fixed voltage and an excitation frequency(10 V and 26 Hz in the investigations,which was the working condition with the best drag reduction effect in order to study the drag reduction mechanism of synthetic jet). The size of the cavity and details of the actuator are shown in Fig.1. In the present work,x,y,andzdenote the streamwise direction,wall–normal direction,and spanwise direction,respectively;u,v,andware defined as the instantaneous velocities in their respective directions;besides,the relevant fluctuation velocity components are given byu′,v′, andw′. The streamwise location and the spanwise location of the hole are defined asx=0 andz=0,and the upper surface of the plate in wall–normal direction is set to bey=0.
The instantaneous velocity field was measure by the TRPIV system. The flow was sprinkled by polyamide particles with a density of 1.03 g/mm3and an average diameter of 20 μm. A continuous laser sheet, with a thickness of 1 mm,was used to illuminate the test section.
When measuring the streamwise–wall–normal plane (x–yplane), the laser illuminated the flow field vertically downwards and the laser plane through the hole was parallel to the direction of incoming flow. A Speed Sense 9072 12-bit charge-coupled device(CCD)camera#1 recorded the images from a direction perpendicular to the laser plane, which had a Nikon lens with a focal length of 60 mm. The camera’s resolution was set to be 1280 pixels×800 pixels and the particle image density was about 23 per 32 pixels×32 pixels. The field of view(FOV)was approximately 107 mm×67 mm inxdirection andydirection and the left edge of FOV was 15-mm upstream of the orifice. In one set of data,a total of 41080 images were obtained with the sampling ratefs=360 Hz. Then these particle images were transformed into the corresponding velocity field by an iterative multi-grid cross-correlation algorithm. The adaptive correlation approach was used, with interrogation windows of 32 pixels×32 pixels and an overlap rate of 75%, resulting in a vector distance of 0.69 mm in the coordinate system. For camera #2 with a 200-mm Nikon lens, its resolution and sampling frequency were the same as those of camera #1. The size of its measurement area was about 26.06 mm×16.29 mm, and the left edge of FOV was 15 mm in the downstream direction of the hole. The relevant spatial resolution was 0.0204 mm/pixel, which was adequate to record the flow in the viscous sublayer. The images captured by camera #2 were utilized to calculate the friction velocity by SPEC.Because of the very thin viscous sublayer,the areas that needed to be processed with SPEC was set to be 1280 pixels×80 pixels(26.06 mm×1.63 mm in thexdirection andydirection).
When measuring the stream–spanwise plane(x–zplane),the laser surface was parallel to the plate on the side of the channel. The camera#1 captured the flow from above,and the other settings of it reminded unchanged. The FOV recorded was approximately 107 mm×67 mm in thexdirection and thezdirection, and its left edge was located 15-mm upstream of the orifice. The distance between the laser plane and the plate could be adjusted freely to acquire the velocity fields at two different heights(4.5 mm and 10.5 mm).
3. Results and discussion
3.1. Flow basic parameters
To describe the experimental conditions more clearly,the flow parameters of the boundary layer without control (00 V 00 Hz)under the condition of fully developed turbulent boundary layer state are listed in Table 1. The friction velocityuτ=11.21 mm/s is fitted by the Spalding profile[28]which is in the following form:
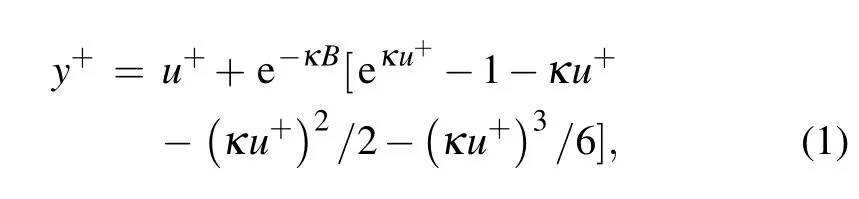
with the log-law constantsκ=0.41 andB=5.2; using the SPEC method and linear law fitting method,uτis obtained to be 11.22 mm/s. The goodness of fit acquired by these two measurements is greater than 0.9996 and the results are basically consistent.Then,uτ=11.21 mm/s is defined as the standard value to be utilized later. Figures 2(a)and 2(b)show the profiles of mean streamwise velocity and the intensity of turbulence inx–yplane, respectively. For comparison, the DNS data of the zero-pressure gradient TBL obtained by Schlatter and Orlu[29]are put in these figures with similar values ofReτ.Obviously, the two sets of data are basically the same, which indicates that a fully developed TBL has been obtained. In the diagram,both velocity and length are dimensionless by innerscale units,which areu+=u/uτandy+=yuτ/υ.
The thicknessδof boundary layer is based on a height of 0.99U∞. The skin friction stress is calculated from
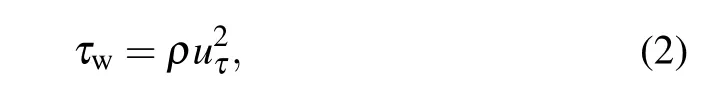
where the densityρof water is 998 kg/m3. The corresponding skin friction coefficient is described by the following formula:

Then,the drag reduction rate can be defined as

whereCf0represents the frictional factor without control,andCf1denotes that after control,the computing method ofReτis obtained according to
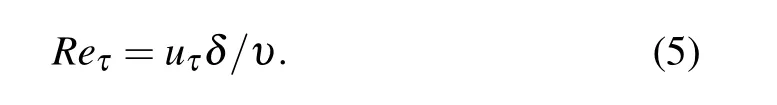
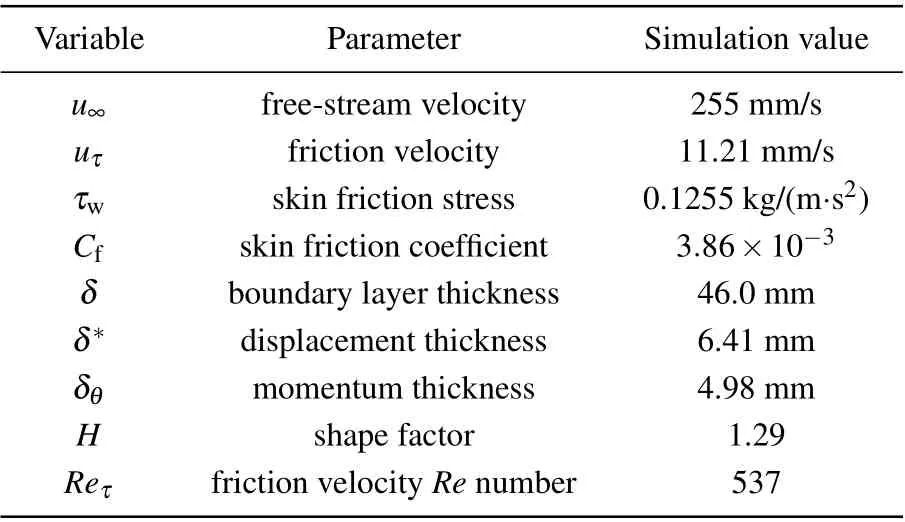
Table 1. Flow parameters of boundary layer.
According to the above,after using the synthetic jet control,the results are as follows:uτ=10.86 mm/s calculated by the SPEC method,τw=0.1178 kg/(m·s2),Cf1=3.63×10-3,DR=6.2%. It can be found that under the influence of synthetic jet,the flow field shows the phenomenon of drag reduction of about 15 mm–41 mm in the downstream direction of the jet hole(xranges from 15 mm to 41 mm).

Fig. 2. Profiles of (a) mean streamwise velocity and (b) streamwise and wall–normal turbulent fluctuation intensity,with scatter points showing experimental data,and curves representing DNS results.
Figure 3 illustrates the viscous sublayer’s mean streamwise velocity profiles normalized by the same inner-scale unituτ=11.21 mm/s. As can be seen from the figure,the viscous substrate is thickened after the synthetic jet control, which is the representative characteristic of drag reduction in TBL.
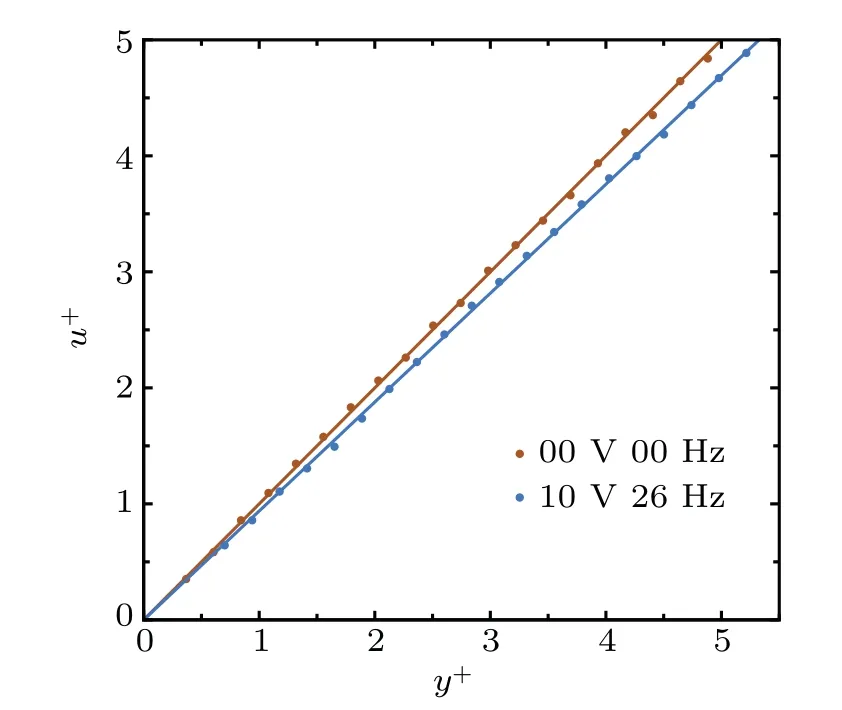
Fig.3. Mean streamwise velocity profiles of viscous sublayers.
3.2. Phase average of flow field
The influence of the synthetic jet on the static flow field is presented in Fig.4. The red dotted line shows where the value is zero. It can be found that the central region with positive wall–normal velocity and the two side regions with negative wall–normal velocity are generated by the jet flow. Obviously,the value and area of the former are larger than those of the latter. This is consistent with the conclusion obtained by Sane and Hirayama[30]that for the same mass flux,the average influence of blowing on the flow field is greater than that of suction. Strong shear can be seen from the dense contour lines between the middle and both sides,resulting in the generation of vortex structure.

Fig.4.Nephogram and vectors of time-averaged wall–normal velocity component in x–y plane without U∞.
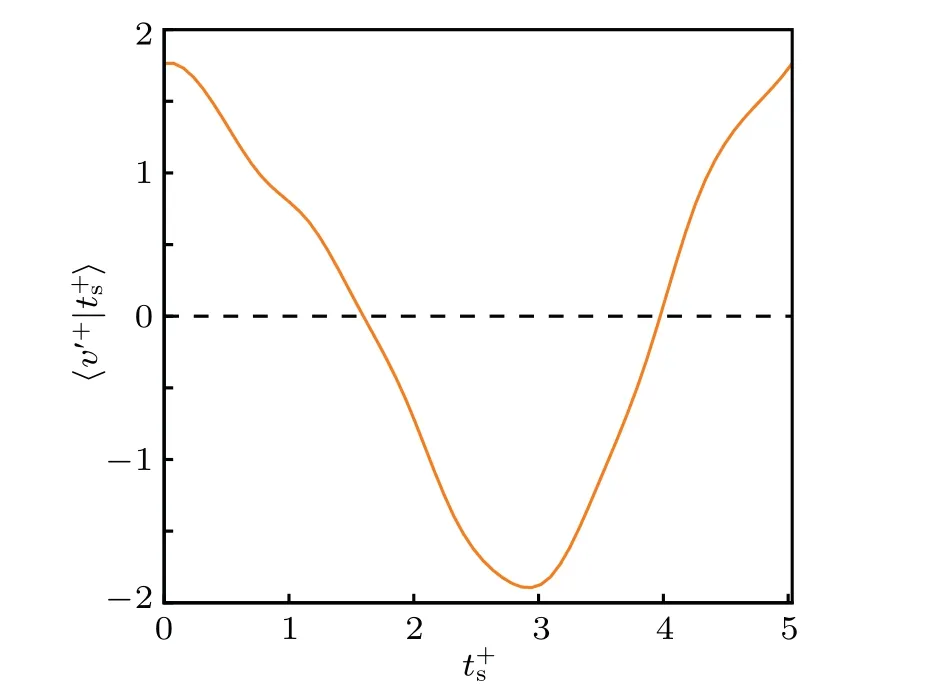
Fig. 5. Wall–normal fluctuation velocity curve of one period after phase averaging.
Periodic disturbance of the synthetic jet can produce periodic coherent structures of flow field which appear in the same place every cycle,[31]so they have a statistical distribution. In order to study the effect of the synthetic jet in one period,the phase averaging analysis of the flow field is carried out,which is obtained by averaging the superposition of velocity fields at the same phase time in different periods. Figure 5 shows the curve of wall–normal fluctuation velocity versus time of phase averaging at the location above the hole (x+=0,y+=26).The time of maximum wall–normal fluctuation velocity is set to bet+s=0,wheret+sis computed from

here,tsis the time in second during one period. It is observed that the full cycle time of the synthetic jet at a fixed frequency of 26 Hz ist+s≈5.032=T, and the absolute values of the maximum and minimum normal fluctuation velocities are almost equal.
Figure 6 illustrates the phase-averaged fluctuation velocity vector diagrams and the contours of vortex intensityΛciin streamwise–wall–normal plane withoutU∞, where the values of timet+sare 0,T/6,2T/6,3T/6,4T/6,5T/6 respectively.The solid red line indicates thatΛciis 5. The expression ofΛciis given by

whereλciis the imaginary part of the complex eigenvalue of velocity tensor, andωdenotes the vorticity perpendicular to the plane. We can see that under the influence of the synthetic jet, a complete spanwise vortex pair of reverse rotation will be generated near the hole every period. Whent+sis between 0 and about 2T/6,the normal fluctuation velocity is positive,indicating blowing. As can be seen from the figure,the vortex pair spews out at a faster speed in this process,and the scope of vortex region becomes larger and larger. Whent+schanges from 2T/6 to 4T/6, the normal fluctuation velocity is negative, showing the phenomenon of suction. During this time,the height of the vortex pair basically does not change,which can be explained by the fact that the distance between the vortex pair and the hole is so far that the suction of the synthetic jet cannot pull it back. Furthermore, induced by this vortex pair,the flow field maintains the phenomenon that the normal velocity is high in the middle and low on both sides, thereby generating the next vortex pair in the next period.
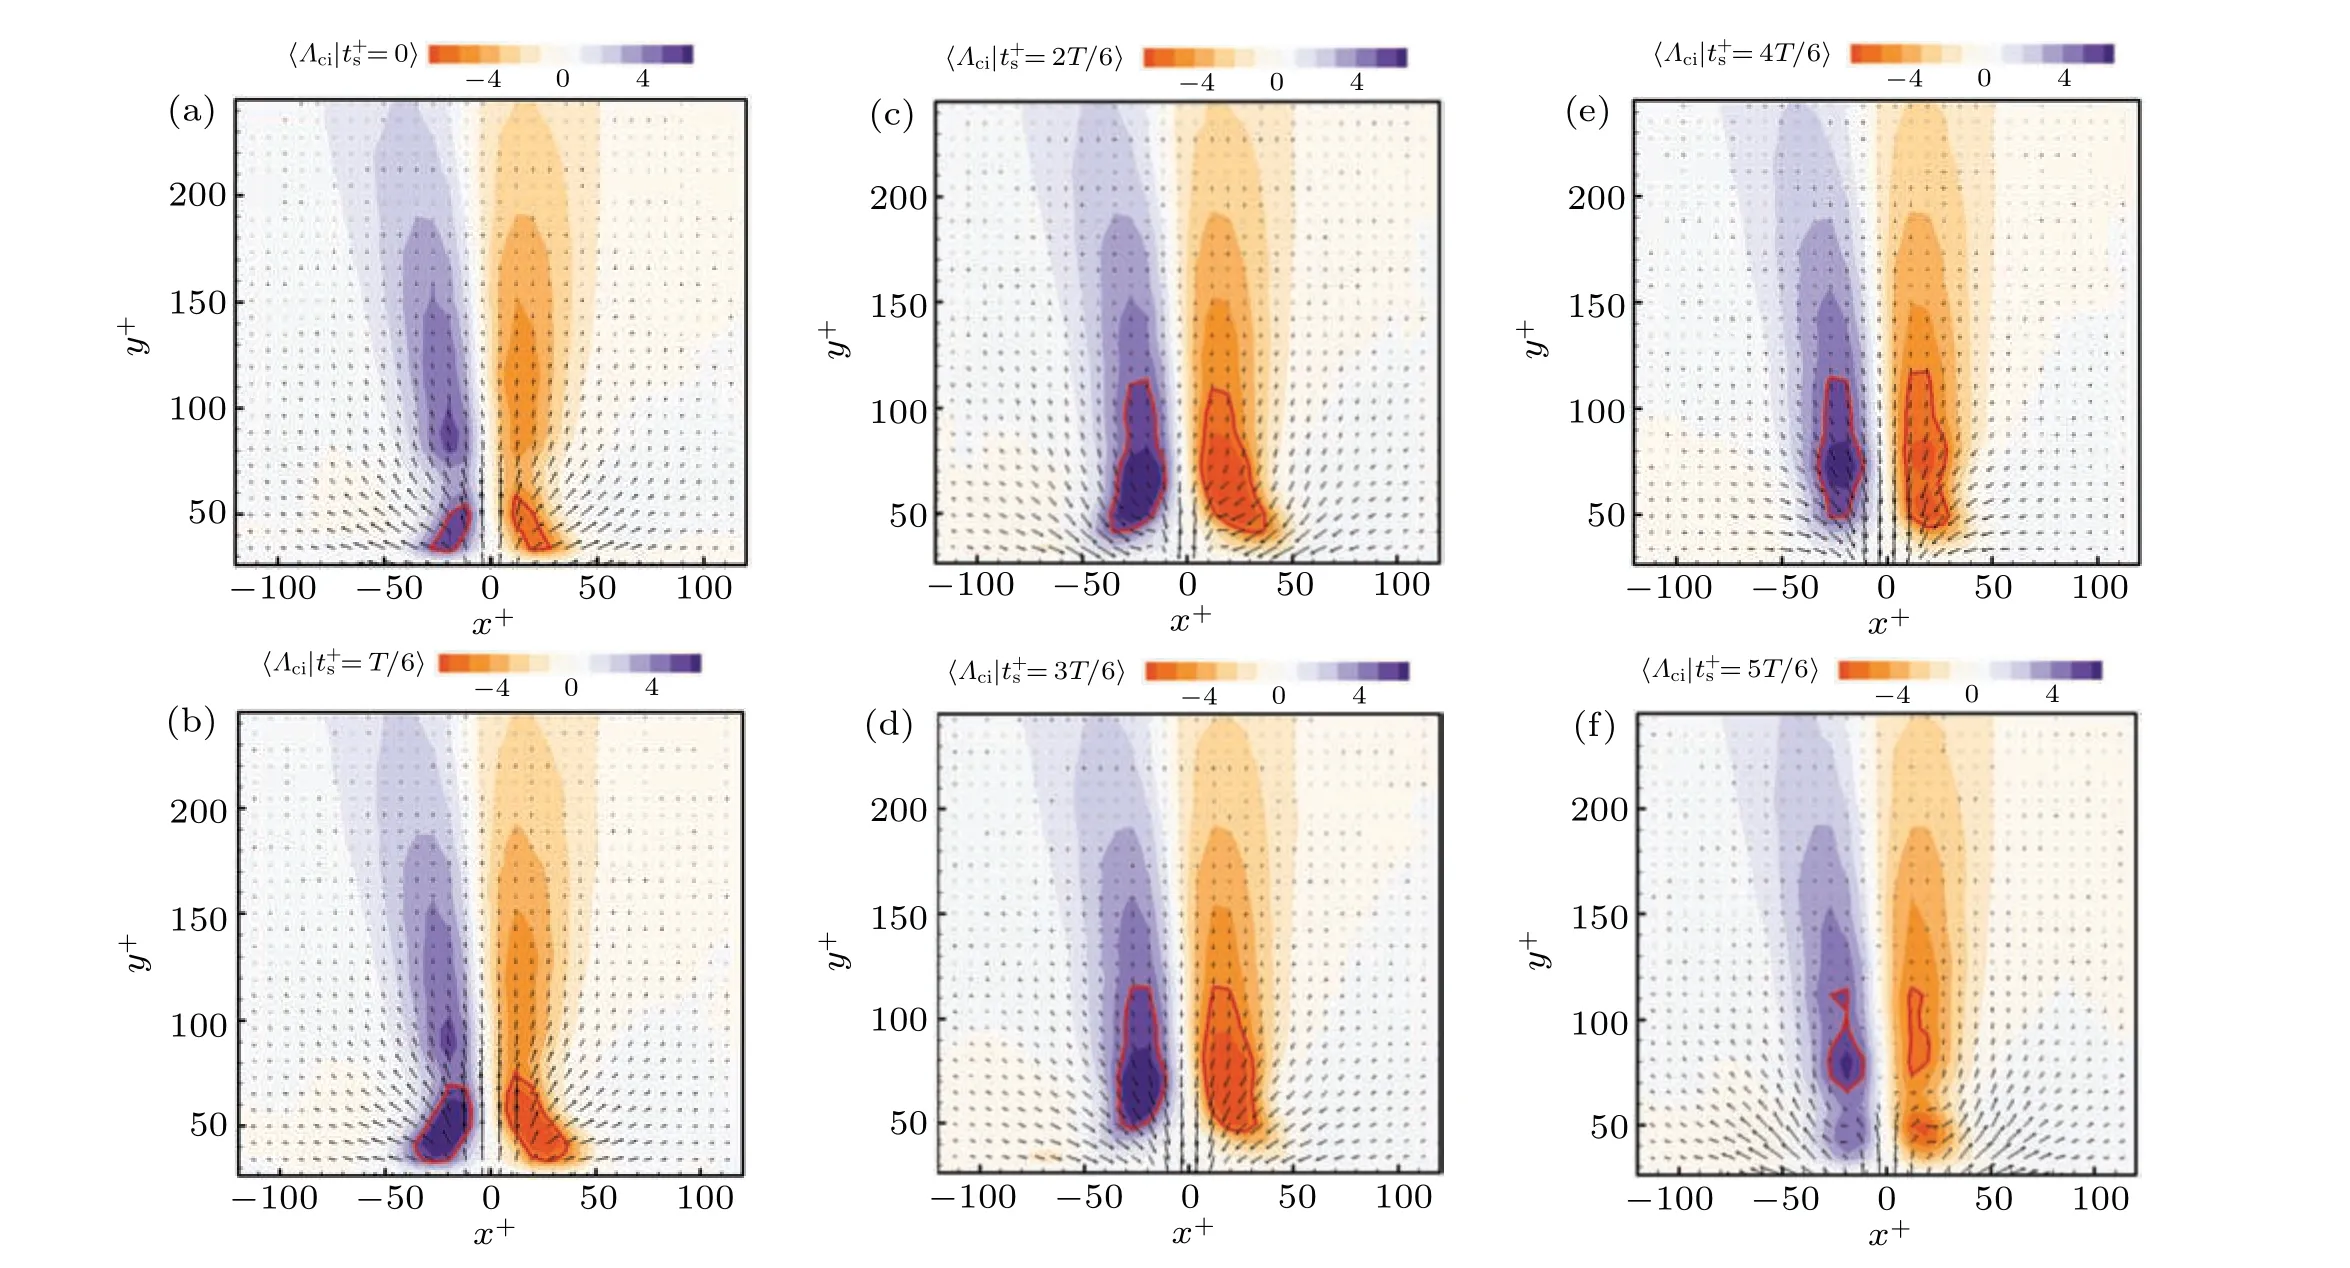
Fig. 6. Vectors of phase-averaged fluctuation velocity and the contours of vortex intensity at phase of (a)t+s =0, (b)t+s =T/6, (c)t+s =2T/6, (d)t+s =3T/6,(e)t+s =4T/6,(f)t+s =5T/6 in x–y plane without U∞.
In Fig. 7 the incoming flow velocityU∞is used on the basis of Fig. 6, and other conditions are the same as before.The solid red line shows the region whereΛciis 0. As can be found from these panels,there are almost no places whereΛciis negative. In other words, the reverse vortex generated upstream of the small hole decays so fast that it disappears from the FOV, while the consequent vortex in the downstream direction of the hole continues to evolve downstream under the action of free flow and its height gradually increases. The reason is that under the influence ofU∞,the shear strength of the TBL is enough to cancel the negative vorticity of the vortex pair and make it become a hairpin-like structure,[32]while the downstream side is subjected to a self-induced velocity,leading to its tilt in the direction ofU∞. After synthetic jet periodic disturbance, only three consecutive aligned forward vortices are observed in the figure due to the continuous attenuation of them in the process of development. Then a structure similar to hairpin vortex package is formed, where the forward vortex is the vortex head of hairpin vortex. The distance between each vortex depends onU∞and the frequency of the synthetic jet.[15]
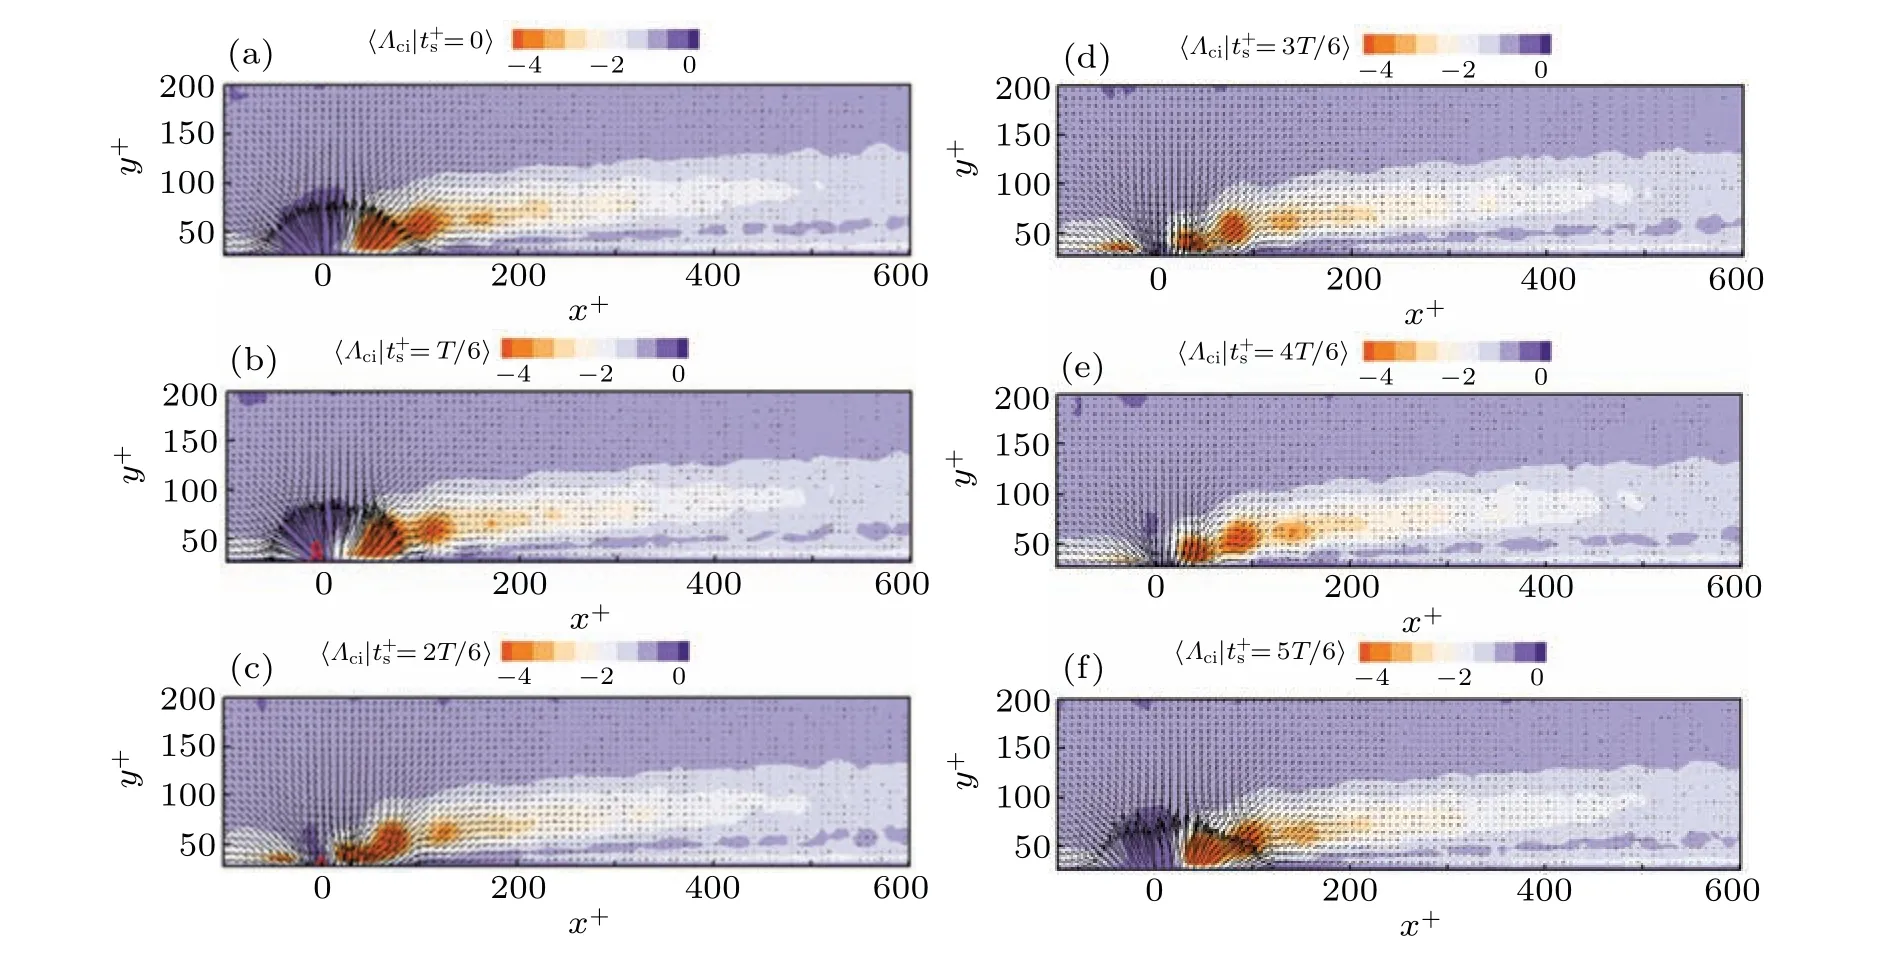
Fig.7.Vectors of phase-averaged fluctuation velocity and contours of vortex intensity at phase of(a)t+s =0,(b)t+s =T/6,(c)t+s =2T/6,(d)t+s =3T/6,(e)t+s =4T/6,and(f)t+s =5T/6 in x–y plane.
Figure 8 demonstrates the contours and vectors in streamwise–spanwise plane aty+= 53 corresponding to Fig. 7. It can be seen that in one period, a pair of counterrotation normal vortices is created on either side of the hole,and it moves downstream at an almost constant rate. The reason is that the velocity generated by the synthetic jet is far less thanU∞, and the movement velocity of the vortex is mainly provided byU∞. As shown in Figs.8(b)–8(d),only two complete vortex pairs can be observed and they almost dissipate from the flow field atx+≈150. It is caused by the lifting action of the vortex structure which makes it gradually move away from the measuring plane.The distance between the two vortices in the vortex pair gradually increases in the process of downstream evolution.Combined with the phenomenon of the spanwise vortex,these are consistent with the evolution characteristics of the hairpin vortex,and the normal vortex pair is the two legs of the hairpin vortex.
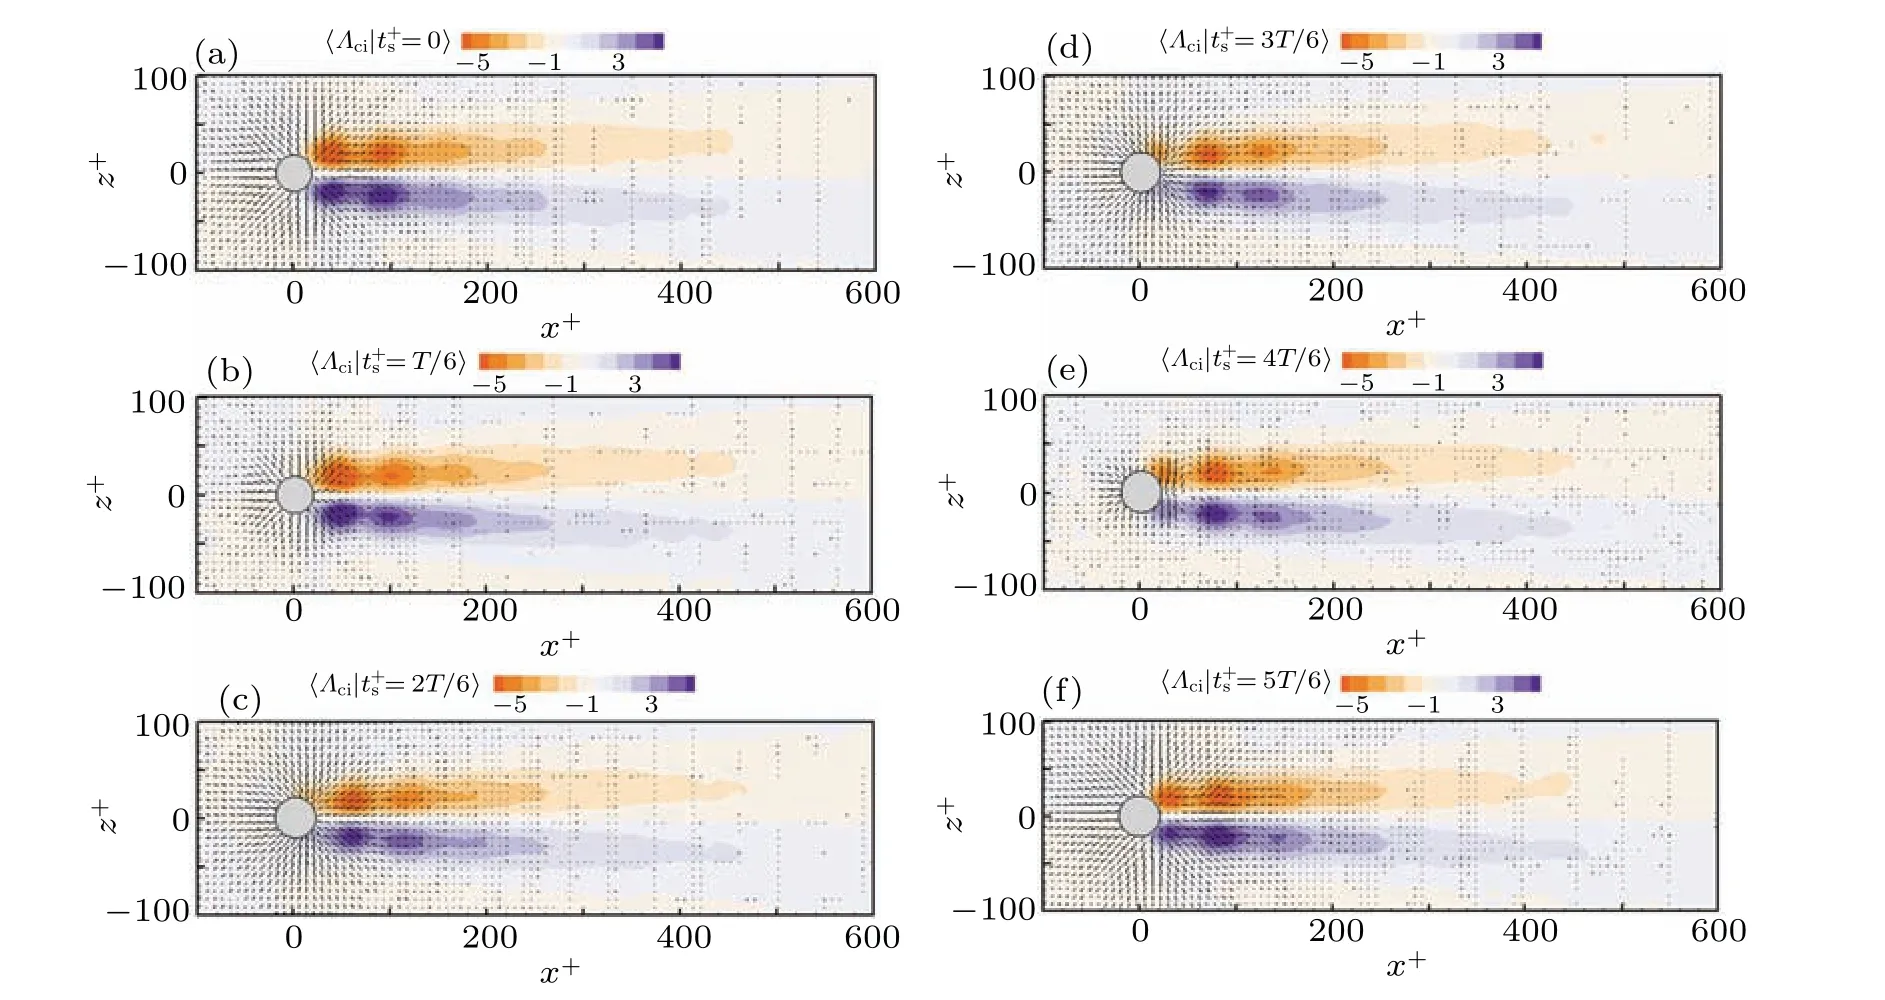
Fig.8.Vectors of phase-averaged fluctuation velocity and contours of vortex intensity at phase of(a)t+s =0,(b)t+s =T/6,(c)t+s =2T/6,(d)t+s =3T/6,(e)t+s =4T/6,(f)t+s =5T/6 in x–z plane at y+=53.
3.3. Statistical average
After the control is applied to the flow field,the synthetic jet enters into the TBL along the wall–normal direction, and the ejected fluid has a low momentum in the streamwise direction. Therefore,after the drastic momentum exchange occurs,a large velocity deficit can be generated in the TBL.[33]
Figure 9 describes the time-averaged difference between control and non-control of streamwise velocity, and that of wall–normal velocity in streamwise–wall–normal plane. The zero isoline is marked by solid red line.According to Fig.9(a),under the influence of the synthetic jet, most velocity deficit regions appear in the flow field withy+<150, which are caused by the joint backward induction of the forward vortices.The velocity deficit reaches its maximum value atx+≈85,and then decreases continuously along the downstream direction. The contour line is similar to the ellipse inclined to the downstream direction. Observing the Fig.9(b),there is a large normal velocity increment above the center of the orifice position. A big overlap between Δv+>0 and Δu+<0 occurs in the downstream direction of the outlet,which indicates that the synthetic jet makes the low-speed fluid at the bottom of the TBL manifest itself an upward movement trend, namely a large range of Q2 event. This is consistent with the phenomenon observed by Rathnasingham and Breuer.[34]
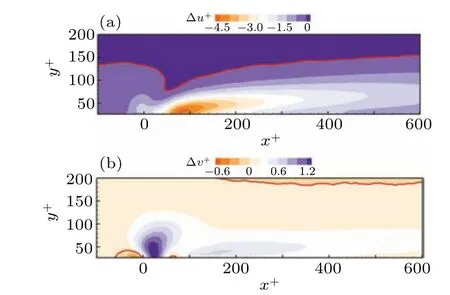
Fig. 9. Nephograms of (a) time-averaged difference between controlled and non-controlled streamwise velocity, and (b) time-averaged difference between controlled and non-controlled wall–normal velocity in x–y plane.
Figure 10 illustrates the time-averaged difference between control and non-control streamwise velocity, and the time-averaged difference between control and non-control spanwise velocity in streamwise–spanwise plane aty+=53.The solid red line shows where Δu+=0 and Δw+=0.2 in Figs. 10(a) and 10(b) respectively. As can be found from Fig. 10(a), the streamwise velocity deficit area is symmetrically distributed alongz+=0. The velocity deficit reaches its maximum value atx+≈85 and gradually decreases downstream, which reflects that the synthetic jet generates a lowspeed streak. The variation trend of zero isoline alongxis almost consistent with the motion routes of the normal vortex pairs, which indicates that the low-speed streak is generated and developed under the induction of the vortex structure. As for Fig.10(b),the ejection of the synthetic jet causes the outlet velocity to expand laterally. As the normal vortex pair gradually lifts away from the measurement plane, the graph manifests that under the induction of two hairpin vortex legs, the fluid below moves towards the middle.
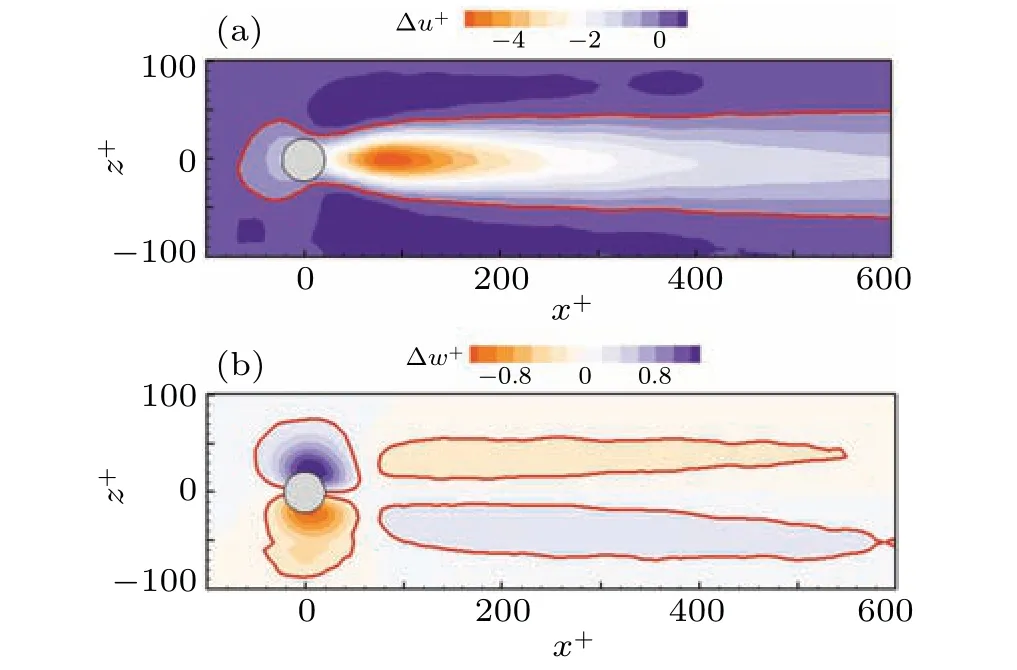
Fig. 10. Nephograms of (a) time-averaged difference between controlled and non-controlled streamwise velocity, and (b) time-averaged difference between controlled and non-controlled spanwise velocity in x–z plane at y+=53.
3.4. Inspection of partial drag reduction
For studying the drag reduction strength of the synthetic jet at different streamwise positions,figure 11 depicts the variation of the ratio of wall friction coefficientCf1with the control of the synthetic jet to coefficientCf0without the control of the synthetic jet along thexdirection. Because the selected streamwise distance is short,Cf0is regarded as a constant,which is 3.86×10⁻³from the average value. Among them,the data used derive from the near-wall velocity field and are collected by camera #2, and the skin-friction drag coefficient is obtained by fitting with a linear law.
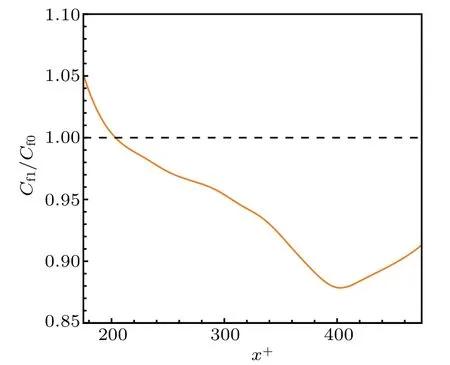
Fig.11. Curve of skin-friction drag coefficient in x direction.
According to formula (4), whenCf1/Cf0<1, the flow field is characterized by drag reduction, and the smaller the value, the better the drag reduction effect is. It can be seen from Fig. 11 that the wall friction resistance of the flow field increases with respect to no control scenario in the region wherex+<200 approximately, but the increment quickly dwindles to zero. At the downstream position, the synthetic jet begins to generate the drag reduction effect and reaches its maximum value at aboutx+=400,where the drag reduction rate is about 12.2%.
In the further downstream direction, the effect gradually decreases as it keeps away from the synthetic jet control,which is similar to the result from Luet al.[35]In total, the synthetic jet has a drag reduction effect on the local flow field and the effect is not uniform.
Figure 12 demonstrates the variation of the streamwise and normal fluctuation intensity in thexdirection aty+=26,where the subscripts 0,1 represent non-control case and control case respectively. The results show that the rapid decrease of the fluctuation intensity at the positionx+<200 leads the skin-friction drag to drop sharply,and the reason for the large value is that the area is too close to the hole, which is more affected by disturbance. In the range ofx+>200, the synthetic jet restrains the streamwise fluctuation of the fluid so as to inhibit the streamwise momentum exchange and energy transport,and the inhibition effect reaches its maximum value at positionx+=390 which approximates to the extreme point of the drag coefficient. On the whole, the normal fluctuation intensity is always enhanced relative to no control case and gradually decreases until the value tends to 1 after leaving the disturbance range. The streamwise fluctuation intensity changes along thexdirection in a similar way to the resistance coefficient, which indicates that one of the reasons for drag reduction is that the synthetic jet weakens the streamwise fluctuation intensity in the downstream direction of the orifice.
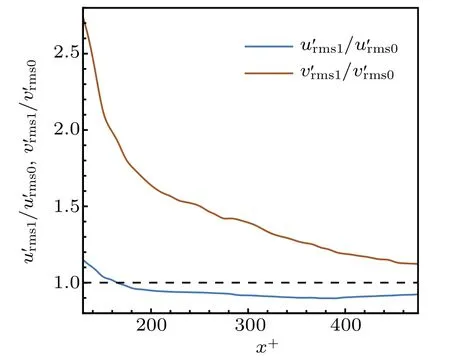
Fig.12. Curves of turbulent fluctuation intensity in x direction at y+=26.
3.5. Two-point correlation analysis
Coherent structure is the main mechanism for the maintenance,evolution and development of TBL,which plays an important role in transporting the turbulent energy and momentum. A large number of studies[36,37]on TBL show that there are coherent structures near the wall,such as streamwise vortices and hairpin vortices. They induce the surrounding fluid in the flow and form a high-speed or low-speed fluid region with a certain spatial scale correlation, which has a definite order in space. If the correlation or scale of the generated coherent region is weakened,the intensity and induction degree of the coherent structure are reduced, and then the resistance is reduced. In order to investigate the scale change of coherent structure after applying synthetic jet control,a spatial twopoint correlation analysis[38,39]is carried out. In this part,two normal heights are selected,y+=53 which is more affected by the synthetic jet andy+=123 which is less affected by it.
The two-dimensional correlation function can obtain the scale information about the coherent motion in the plane and reveal the spatial morphology of the coherent structure in the boundary layer. The two-dimensional spatial correlation function of streamwise fluctuation velocity in streamwise–wall–normal plane used here is defined as

whereyrefis the normal position of the reference section,andσu′is the root mean square value of streamwise fluctuation velocityu′. The above formula represents the correlation function between flow direction fluctuation velocity at each position in the flow field and that at the normal reference position.
Figure 13 describes a comparison between the twodimensional correlated streamwise fluctuation velocities without and with the synthetic jet at positionx+=430,y+=53,andz+=0. The red dotted line represents the contour lineRu′u′=0.2. The results show that there is large-scale coherent structure in the flow field, and the streamwise scale is larger than the normal and spanwise scale. Coherent structure has a certain angle with the direction ofU∞,which exhibits that the upstream of the structure is close to the wall and the downstream is far from the wall. The reason is that the coherent structure is constantly uplifted by the normal motion during the migration to the downstream direction,and the downstream development time is longer and in a higher height. In the streamwise–wall–normal plane, the dimensionless length and width of the contour lines marked are about 780 and 230 without control,and 510 and 140 with control. It is observed that the streamwise and normal scale of the coherent structure are more inhibited by the synthetic jet. In streamwise–spanwise plane,the change of the spanwise scale is not obvious.
Figure 14 demonstrates the two-point correlation results at positionx+=430,y+=123,andz+=0 corresponding to Fig.11.Under the influence of the synthetic jet,the two scales change from 880, 320 to 680, 235 approximately, but the inhibition extent is less than the previous one. There is also no obvious change on a spanwise scale. This indicates that as the normal height is gradually away from the control of the synthetic jet,the inhibition on the streamwise and normal scale of the coherent structure will be weakened.
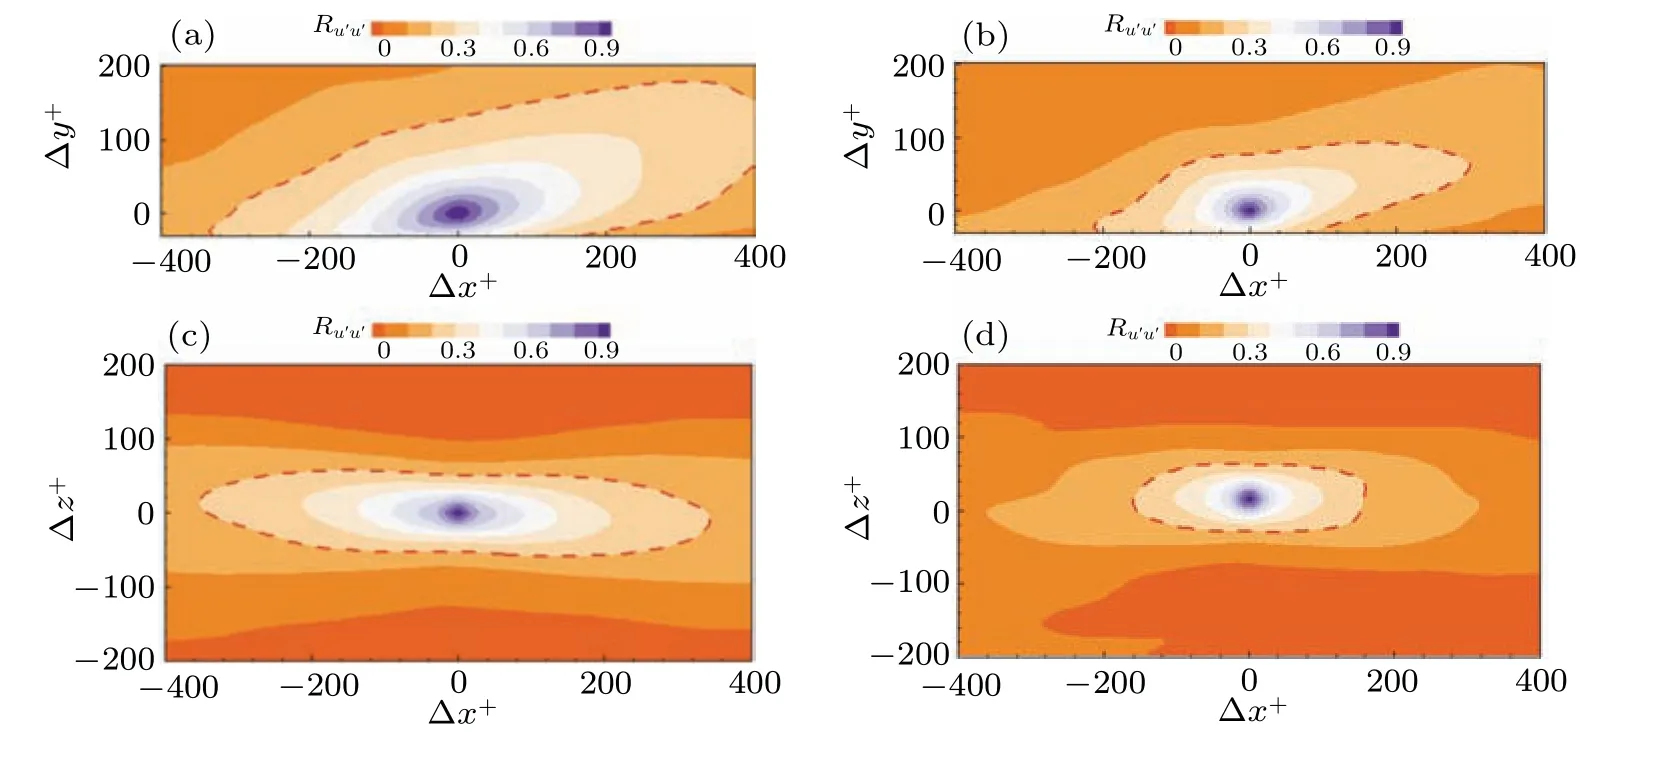
Fig.13. Nephograms of spatial two-point correlation of the streamwise fluctuation velocity with(a)non-control and(b)control in x–y plane,and with(c)non-control and(d)control in x–z plane at position x+=430,y+=53,and z+=0.
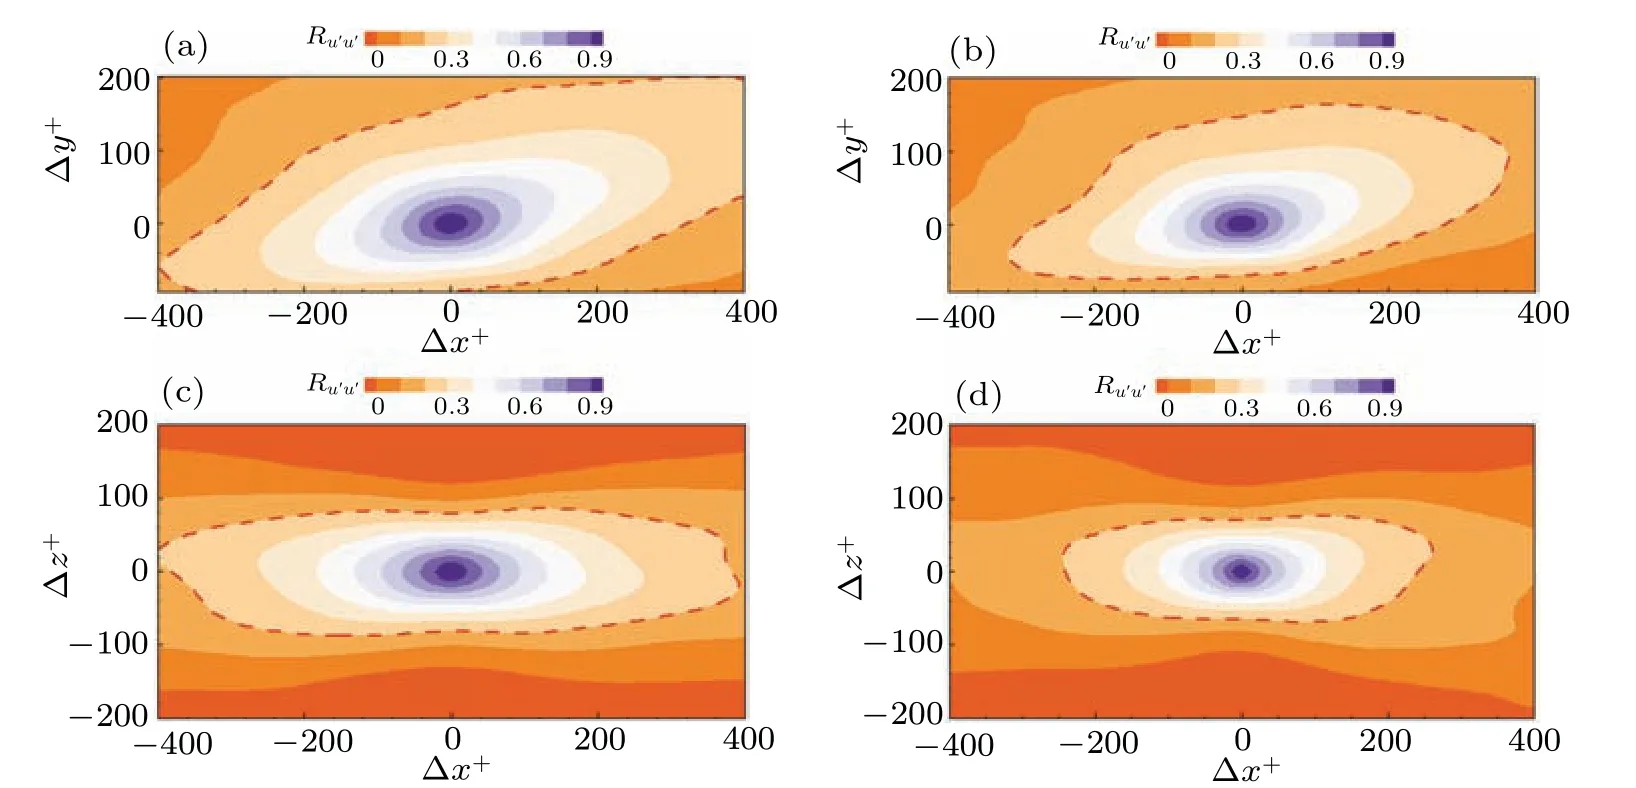
Fig.14. Nephograms of spatial two-point correlation of streamwise fluctuation velocity with(a)non-control and(b)control in x–y plane,and with(c)non-control and(d)control in x–z plane at position x+=430,y+=123,and z+=0.
Figure 15 shows the curves of the correlation coefficient versus spanwise position along the line Δx+=0,clearly showing the changes of the spanwise scale.The results describe that the scale is suppressed on both sides, and a little more at the top.
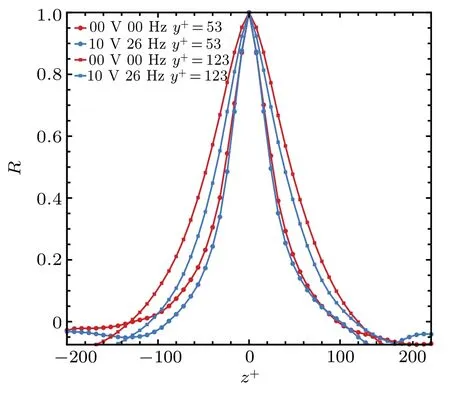
Fig.15. Curves of correlation coefficient distribution in spanwise direction.
In general, the synthetic jet inhibits not only the downstream migration of coherent structures,but also their normal uplift and slightly weakens their spanwise motion,thus achieving the effect of drag reduction.
4. Conclusions
A 2D TR-PIV is utilized to collect the velocity field of the TBL inx–yplane andx–zplane. The friction velocity is calculated by the SPEC algorithm, and the average drag reduction rate is about 6.2%, whenx+changes from 175 to 475 downstream of the jet opening. The time-averaged normal velocity generated by the synthetic jet in a stationary fluid is positive in the middle and negative on both sides,and there are strong shear forces at the junction.
The phase average analysis of synthetic jet with and without incoming flow are carried out. The results show that the period of the synthetic jet at the input frequency of 26 Hz ist+s≈5.032,and a pair of spanwise vortices with opposite rotation directions is generated every period. In addition, the synthetic jet cannot suck back the vortex pairs that have been blown out in the suction stage. Through the influence ofu∞,the reverse vortex upstream of the hole decays quickly,while the downstream consequent vortex continues to develop downstream into a structure similar to the hairpin vortex.In the process of its further development downstream, the vortex head rises continuously and the two vortex legs move to both sides.Under the continuous action of synthetic jet, the hairpin vortex packet structure composed of three hairpin vortices can be observed.
By subtracting the velocity field after time-averaging with control from that without control, it can be seen that the synthetic jet produces a large area of Q2 event and a low-speed streak downstream of the hole. Induced by two hairpin vortex legs,the fluid below them converges to the middle.
Under the influence of the synthetic jet, the flow field generates local drag reduction effect. Under this experimental condition,the effect reaches its maximum value atx+=400,when the drag reduction rate reaches about 12.2%. The inhibition of the streamwise fluctuation intensity by the synthetic jet is also a reason for drag reduction.
The spatial two-point correlation analysis is used for the regions with two heights. The results illustrate that the synthetic jet can significantly inhibit the streamwise scale and normal scale of the large-scale coherent structure,and slightly weaken its spanwise motion. When the normal height is gradually away from the influence of the synthetic jet, the inhibition effect on the former is obviously weakened,while that on the latter is slightly enhanced. Finally,under the action of the synthetic jet,the drag reduction effect of flow field is obtained.
Acknowledgements
Project supported by the National Natural Science Foundation of China(Grant Nos.11732010,11972251,11872272,11902218,and 12172242)and the National Key Research and Development Program of the Ministry of Science and Technology,China(Grant No.2018YFC0705300).

- Chinese Physics B的其它文章
- Solutions of novel soliton molecules and their interactions of(2+1)-dimensional potential Boiti–Leon–Manna–Pempinelli equation
- Charge density wave states in phase-engineered monolayer VTe2
- High-pressure study of topological semimetals XCd2Sb2(X =Eu and Yb)
- Direct visualization of structural defects in 2D semiconductors
- Switchable down-,up-and dual-chirped microwave waveform generation with improved time–bandwidth product based on polarization modulation and phase encoding
- Machine learning potential aided structure search for low-lying candidates of Au clusters