The Synergism between Methanogens and Methanotrophs and the Nature of their Contributions to the Seasonal Variation of Methane Fluxes in a Wetland: The Case of Dajiuhu Subalpine Peatland※
Luwen WANG , Jiwen GE* , Liang FENG , Yaoyao LIU , Yu LI , Jiumei WANG ,Xiang XIAO, and Zhiqi ZHANG
1Laboratory of Basin Hydrology and Wetland Eco-Restoration,China University of Geosciences,Wuhan 430074,China
2Hubei Key Laboratory of Wetland Evolution and Ecological Restoration,China University of Geosciences,Wuhan 430074,China
3Institution of Ecology and Environmental Sciences,China University of Geosciences,Wuhan 430074,China
4Shennongjia National Park Administration Bureau,Shennongjia Forestry District 442417,China
ABSTRACT Wetland ecosystems are the most important natural methane (CH4) sources, whose fluxes periodically fluctuate.Methanogens (methane producers) and methanotrophs (methane consumers) are considered key factors affecting CH4 fluxes in wetlands. However, the symbiotic relationship between methanogens and methanotrophs remains unclear. To help close this research gap, we collected and analyzed samples from four soil depths in the Dajiuhu subalpine peatland in January, April, July, and October 2019 and acquired seasonal methane flux data from an eddy covariance (EC) system, and investigated relationships. A phylogenetic molecular ecological networks (pMENs) analysis was used to identify keystone species and the seasonal variations of the co-occurrence patterns of methanogenic and methanotrophic communities. The results indicate that the seasonal variations of the interactions between methanogenic and methanotrophic communities contributed to CH4 emissions in wetlands. The keystone species discerned by the network analysis also showed their importance in mediating CH4 fluxes. Methane (CH4) emissions in wetlands were lowest in spring; during this period, the most complex interactions between microbes were observed, with intense competition among methanogens while methanotrophs demonstrated better cooperation. Reverse patterns manifested themselves in summer when the highest CH4 flux was observed. Methanoregula formicica was negatively correlated with CH4 fluxes and occupied the largest ecological niches in the spring network. In contrast, both Methanocella arvoryzae and Methylocystaceae demonstrated positive correlations with CH4 fluxes and were better adapted to the microbial community in the summer. In addition, soil temperature and nitrogen were regarded as significant environmental factors to CH4 fluxes. This study was successful in explaining the seasonal patterns and microbial driving mechanisms of CH4 emissions in wetlands.
Key words: CH4 fluxes,wetland,methanogens,methanotrophs,molecular ecological network
1.Introduction
Methane (CH4) is a potent greenhouse gas in the atmosphere with a warming potential 26 times higher than that of carbon dioxide (CO2) (IPCC, 2013). Since the pre-industrial period, global atmospheric CH4levels have increased threefold, reaching 1877 ±2 ppb in 2019 (WMO/GAW, 2020).Wetlands are considered the largest natural source of CH4,which contribute about 20% to the global CH4emissions to the atmosphere (Saunois et al., 2020). Thus, exploring the CH4emission dynamics in wetlands could increase the understanding of global CH4emissions.
The dramatic seasonal changes of CH4fluxes in wetlands were observed in early studies. Overall, they were highest in summer and lowest in winter (Long et al., 2010; Hao et al.,2020). The production of CH4in wetlands is mainly due to the synergistic effect of methanogens and the other microbes within the anaerobic food chain, which gradually decompose soil organic carbon and generate CH4under anaerobic conditions (Wagner, 2017). At the same time, CH4is utilized by methanotrophs as an energy source (He et al.,2015). The influences of the methane metabolic microbial community succession on CH4fluxes have been discussed in previous research. The diversity (Yavitt et al., 2012), community structures (Liebner et al., 2015), and relative abundances (Peltoniemi et al., 2016) of methanogenic and methanotrophic communities have been proven to be closely related to the production and emissions of CH4; nevertheless, some research suggests a more complicated relationship between CH4production and methanogenic and methanotrophic communities. Ramakrishnan et al. (2001) discovered that the compositions of methanogens were relatively similar despite a greater than 10-fold difference in CH4production rates across 11 rice field soils. Juottonen et al. (2008)observed large variations in CH4production but relatively little change in methanogenic composition and abundance across seasons in a boreal mire. Thus, the synergism between methanogens and methanotrophs should be considered, which could shed light upon the comprehensive interpretations of seasonal variations of CH4fluxes in wetlands.
The interactions among the methane metabolic microbial communities may have a greater impact on ecosystem functions than simply the community structure and abundance.The analysis of phylogenetic molecular ecological networks(pMENs) has been widely used in recent years because it can reveal the complex ecological interactions among microbes (Barberán et al., 2012) as well as the visual responses of microbes to environmental variations (Huang et al., 2019). Keystone species and other important microbes can be identified based on network topological parameters (Steele et al., 2011; Zhou et al., 2011). By employing a molecular ecological network analysis, Zhang et al.(2018) found a tight co-occurrence of methanogens in one module with some other species, indicating the potential for a tight co-occurrence with these kinds of microbes. Furthermore, Li et al. (2021) proposed that the methanogenic groups involved in commonly co-occurring links among networks contributed most to CH4emissions. However, both methanogens and methanotrophs are the dominant microbes that affect the CH4emissions in wetlands; therefore, the functions of methanotrophs should be considered. Hence, studies on the interactions between methanogens and methanotrophs can help us further comprehend the periodical variations of CH4fluxes in wetlands.
In this study, the eddy covariance (EC) system was used to observe the dynamics of CH4fluxes in the Dajiuhu subalpine peatland, the high-throughput sequencing technology and pMENs analysis methods were employed to explain the interactions of methanogenic and methanotrophic communities. The objectives of this study were to detect temporal patterns in CH4emissions and analyze the interactions between methanogenic and methanotrophic communities at seasonal scales.
The remainder of this paper is organized as follows. Section 2 discusses the data and methods, section 3 presents the results, section 4 discusses the results, and section 5 concludes.
2.Materials and methods
2.1.Site description
The study area (Fig. 1a), established in July 2015, was located in the Dajiuhu subalpine peatland of Shennongjia National Park, Shennongjia Forestry Administrative District, Hubei Province, China (31°28′44.45″N, 110°00′14.61″E, 1758 m). The Dajiuhu subalpine peatland is the best-preserved subalpine peatland in southern China,located in the north subtropical monsoon climate zone of the mid-latitudes. The annual average temperature in the study area is 7.4°C, and the annual average precipitation is 1560 mm. The total area of the wetland is 13.846 km2, with soil types mainly consisting of bog soil, meadow marsh soil,and meadow soil. The dominant plant species is Sphagnum palustre, and the companion species include Polytrichum commune, Juncus effusus, Carex argyi, Festuca rubra,Euphorbia esula, Sanguisorba officinalis, and Drosera rotundifolia,etc.
2.2.CH4 fluxes measurement and data quality control
Methane (CH4) fluxes were measured from December 2018 to November 2019 using the open-path eddy covariance method at the height of 3 m. The EC system consists of a three-axis sonic anemometer (CSAT-3, Li-Cor, USA), an open-path CO2/H2O infrared gas analyzer (LI-7500, Li-Cor,USA), an open-path CH4analyzer (LI-7700, Li-Cor, USA),and a micrometeorological measurement system(Biomet100, LI-Cor, USA) (Fig. 1b). It can continuously measure CH4fluxes. The CR1000 data collector of the EC system automatically records data once every 30 minutes. The raw data was processed using the EddyPro 7.0.6 software (LICOR). Low-quality data were removed, including those obtained under rainy and nonstationary conditions. CH4fluxes were also eliminated when the friction velocity was lower than 0.15 m s-1during nighttime. After quality control, the data availability was 42.70%. Data gaps in the halfhourly CH4fluxes were filled using the Mean Diurnal Variations and Gliding-window Method.
2.3.Soil sample collection
The footprint of the EC tower was shown in Fig. 1c,and the sample point was located in the main contribution area of the eddy covariance system. The samples collected in January, April, July, and October 2019, represented the seasons of winter, spring, summer, and autumn, respectively.To eliminate errors caused by soil depth, soil samples were collected at depths of 0, 10, 30, and 50 cm using a soil sampling rig. After removing roots, rocks, and other debris, a total of 48 soil samples were stored in a mobile refrigerator at 4°C in 50 ml centrifuge tubes and sterile bags. After transport back to the laboratory, the centrifuge tubes were stored at -80°C for high-throughput sequencing. The sterile bags were stored at -20°C for the determination of physical and chemical properties.
2.4.Soil physicochemical analysis
The soil's pH and Oxidation-Reduction Potential (Eh)were measured in situ using a portable pH meter (IQ Scientific Instruments, USA). Total organic carbon (TOC) and total nitrogen (TN) were calculated with an elemental analyzer(varioELcube, Germany). The presence of ammoniumnitrateand nitritewere determined with an automated discrete analyzer (SmartChem200,AMS-Alliance).
2.5.DNA extraction,PCR amplification,and highthroughput sequencing
Deoxyribonucleic acid (DNA) was extracted from soil using the OMEGA Soil DNA Kit (OMEGA Bio-Tek, GA,United States). The quality of the DNA extracts was assessed via gel electrophoresis. The primer pairs used for PCR amplification of mcrA and pomA genes were MLr (5'-TTCATTGCRTAGTTWGGRTAGTT-3'), MLf (5'-GGTGGTGTMGGATTCACACART AYGCWACAGC-3'), and A189 (GGNGACTGGGACTTCTGG), A650 (ACGTCCTT ACCGAAGGT), respectively. The PCR products were purified with a PCR purification kit (AXYGEN, AZ, United States) and quantified via a Microplate reader (BioTek,FLx800). The Illumina TruSeq Nano DNA LT Library Prep Kit was used to prepare libraries and sequenced on the Illumina MiSeq platform (Illumina, CA, United States). All steps were finished at Parsenor Biotechnology Co., Ltd,Shanghai.

Fig. 1 Location map of the Dajiuhu subalpine peatland with the study site indicated (a), the image of the Eddy Covariance system (b), and the footprint of the Eddy Covariance tower with the sample point indicated (c).
2.6.Molecular ecology networks construction and analysis
Phylogenetic molecular ecological networks (pMENs)were constructed by sequencing of mcrA and pomA genes amplicons. The pMENs analysis was performed via a Random Matrix Theory (RMT)-based approach in a molecular ecological network analysis pipeline (MENA, http://ieg4.rccc.ou.edu/MENA/). Network visualization was completed using Gephi 0.9.2 (Zhao et al., 2021). Various network topological properties were characterized by similarity matrices.These included the average clustering coefficient, average degree, average path length, and modularity. Individual operational taxonomic units (OTUs) in the networks can be separated into four types of topological nodes in accordance with the values of the among-module connectivity (Pi) and within-module connectivity (Zi) (Wang et al., 2018). The peripherals (Zi≤ 2.5, Pi≤ 0.62), network hubs (Zi> 2.5,Pi> 0.62), module hubs (Zi> 2.5, Pi≤0.62), and connectors(Zi≤ 2.5, Pi> 0.62) were considered as keystone OTUs.
3.Results
3.1.Dynamics of CH4 fluxes
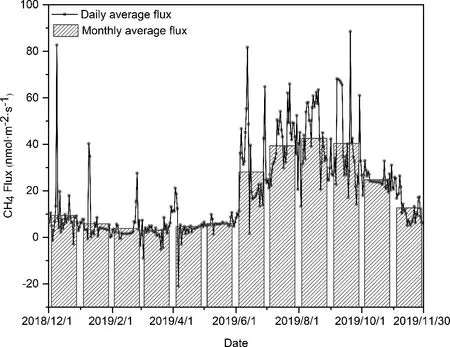
Fig. 2 Daily and monthly variations of CH4 fluxes (nmol m-2 s-1) from December 2018 to November 2019.
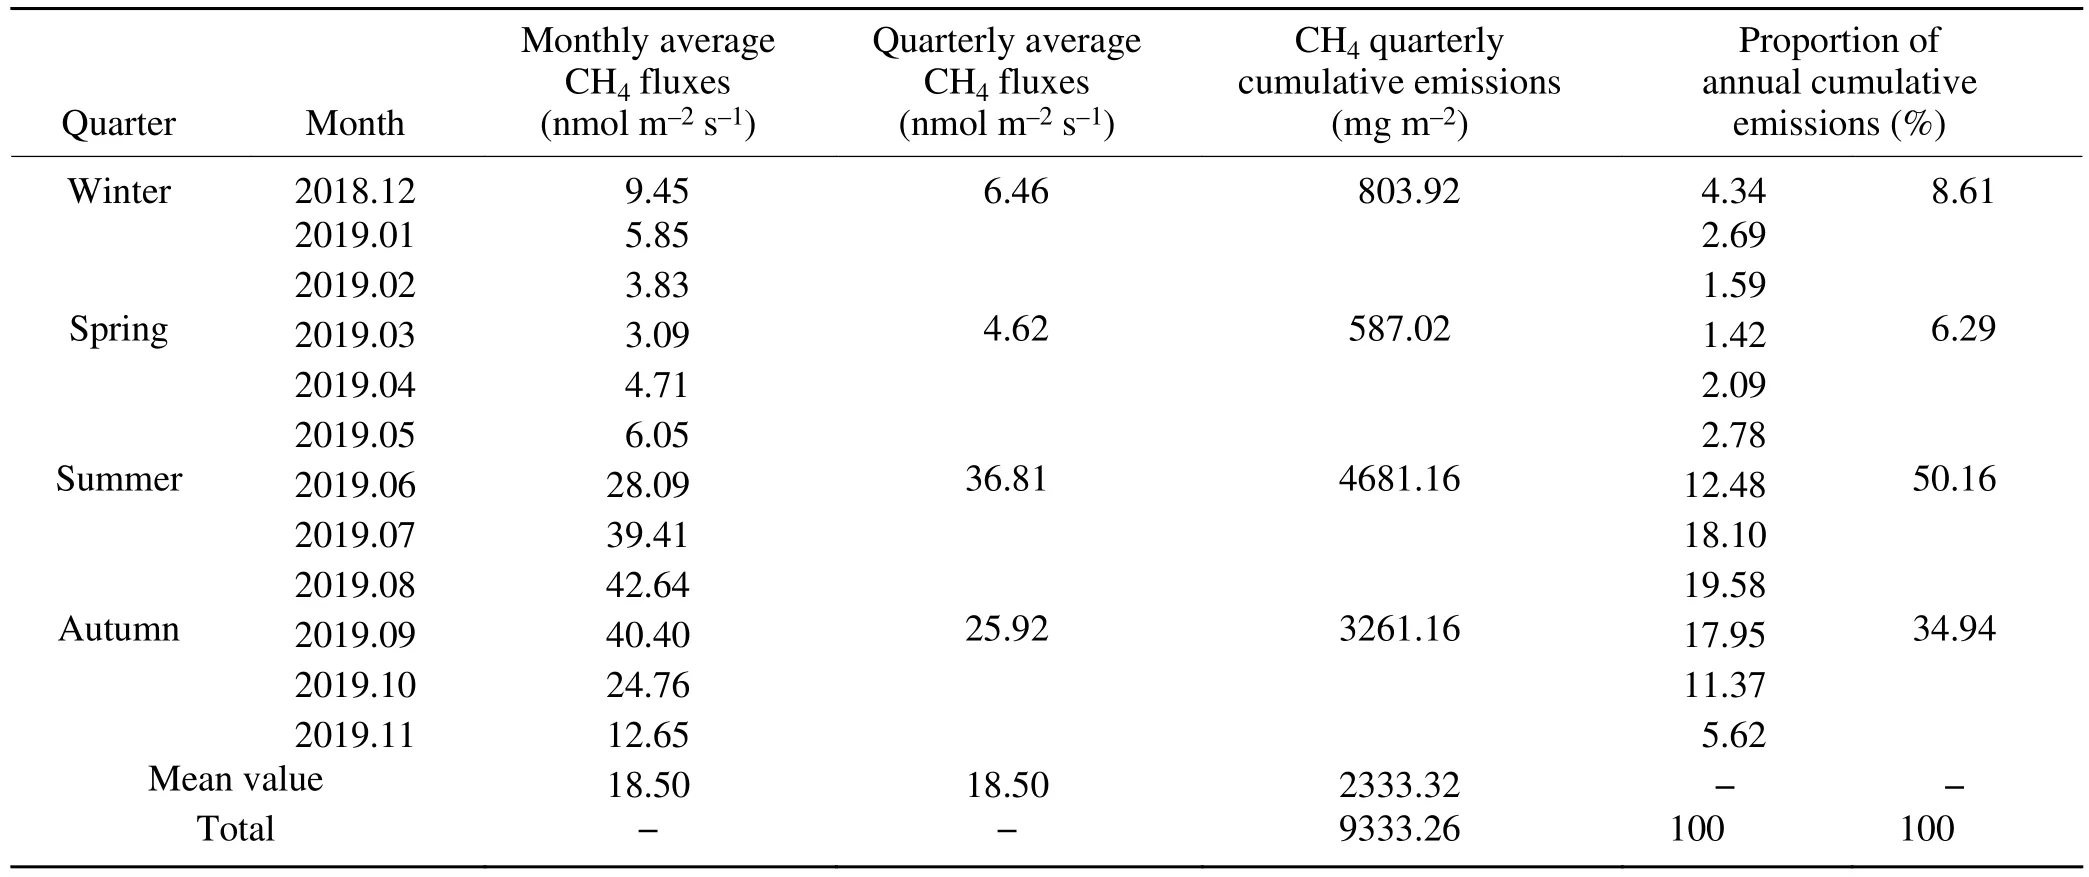
Table 1. CH4 emissions in different time scales of Dajiuhu subalpine peatland.
The remarkable seasonal variations of CH4fluxes are shown in Fig. 2. The Dajiuhu subalpine peatland was the source of CH4(Table 1), with an average CH4release rate of 18.50 nmol m-2s-1. The maximum monthly release rate was 42.64 nmol m-2s-1in August, which was 13.8 times than that of in March (3.09 nmol m-2s-1). The monthly average release rate remained steady from December 2018 to May 2019 and then rose from May to August. The cumulative emissions of CH4were highest in summer (4681.16 mg m-2)and lowest in spring (587.02 mg m-2).
3.2.Molecular ecological networks of methanogenic community
The topological structure of the methanogenic networks in four seasons was different (Fig. 3a and Table S1 in the Electronic Supplementary Materials, ESM). The maximum number of nodes and edges appeared in spring (nodes: 621,edges: 32159). An obvious reduction occurred in summer(nodes: 512, edges: 8030) when the smallest average path length, average clustering coefficient, and the largest average degree of the spring network were observed. In the summer network, the average path length and the average clustering coefficient were both the largest. The tightest connections in spring could be inferred, while the lowest degree of connectivity occurred in summer. The modularity value of networks was larger in summer, and the smallest values occurred in spring. The proportion of negative edges to the total edges in the winter, spring, summer, and autumn networks were 29.90%, 73.26%, 47.19%, and 50.63%, respectively.
The topological roles of the OTUs in the four seasonal networks also showed seasonal changes (Fig. 3b and Table S2 in the ESM). Although network hubs are considered as super generalists (acting as both module hubs and connectors) (Olesen et al., 2007), no network hub was observed in the networks. There were 12, 3, 8, and 2 module hubs in the winter, spring, summer, and autumn networks, respectively.The nodes of connectors in the spring and summer networks were 17 and 1, respectively. Most of the module hubs and connectors of the winter, spring, and autumn networks belonged to Methanoregula formicica, whereas most in the summer networks were Methanocella arvoryzae.
3.3.Molecular ecological networks of methanotrophic community
The differences in the topological structure were shown in the four seasonal methanogenic networks (Fig. 4 and Table S1 in the ESM). The maximum number of nodes and edges appeared in spring (nodes: 811, edges: 377775),while minimum values emerged in summer (nodes: 589,edges: 2715). The average degree and network density of the summer network were the smallest, while there were larger values in the spring. There was also a decrease in the average path length and the average clustering coefficient in the spring network than in the summer. The highest degree of connectivity occurred in spring, and the lowest occurred in summer, which could be inferred by these topological parameters. The modularity value of networks was largest in summer and smaller in spring. The proportion of negative edges in the four networks was 47.79%, 7.70%, 28.18%,and 69.62%, respectively. We conclude that the competition among methanotrophs was weakest in spring.
The topological nodes varied in the four seasonal networks (Fig. 4b and Table S3 in the ESM). Only one network hub was found in the spring network, which belonged to Methylocystaceae. The nodes of module hubs in the winter,spring, summer, and autumn networks were 19, 9, 12, and 8,respectively, and there were 2, 2, and 8 connectors in the winter, spring, and summer networks, respectively. Most of the module hubs and connectors belong to Methylocystaceae,Methylocapsa aurea, and Candidatus Methyloumidiphilus alinensis. The module hubs and connectors in the spring and summer network were mainly attached to Methylocystaceae,while module hubs in the autumn network were affiliated with the Methylocapsa aurea.

Fig. 3 Ecological molecular networks of the methanogenic community (a). Each node represents an OTU, sorted in color by modularity class, the size of each node is proportional to the number of connections, the red lines represent the positive(cooperative) interactions and the green lines represent the negative (competitive) interactions. The methanogenic Zi-Pi plot of the topological role of each OTU (b).
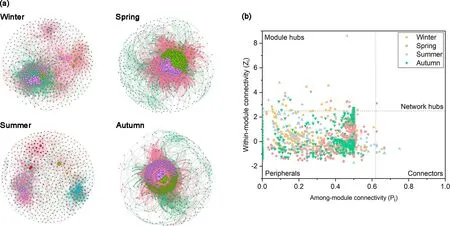
Fig. 4 Ecological molecular networks of the methanotrophic community (a) and the methanotrophic Zi-Pi plot of the topological roles of OTU (b).
3.4.Co-occurrence patterns of methanogens and methanotrophs
The interactions between the methanogenic and methanotrophic communities caused the seasonal variations (Fig.5). The number of edges in the four networks was 252, 456,185, 233 in sequence; the number of negative edges among them was 128, 225, 102, and 122 in sequence. These data imply that strong competition and cooperation existed between methanogens and methanotrophs in spring and summer, respectively. The majority of the methanogen connections were associated with Methanoregula formicica (winter:178, spring: 228, summer: 128, autumn: 135), followed by Methanocella arvoryzae (winter: 48, spring: 103, summer:50, autumn: 90). Methanocella arvoryzae played a pivotal role, evidenced by its numerous positive connections with other species; however, Methanoregula formicica was more competitive in summer. For the methanotrophs, Methylocystaceae accounted the majority of the connections (winter: 64,spring: 35, summer: 114, autumn: 64) in the networks. Methylocapsa aurea (winter: 27, spring: 22, summer: 35, autumn:65) and Candidatus Methyloumidiphilus alinensis (winter:66, spring: 64, summer: 7, autumn: 12) accounted for a large part otherwise. Numerous negative connections with the other species, Methylocapsa aurea and Candidatus Methyloumidiphilus alinensis, deemed them as competitors in spring, while Methylocystaceae contributed to maintaining community stability.

Fig. 5 The interactions between methanogens and methanotrophs. The red and blue nodes represent OTUs of the methanogens and methanotrophs, respectively; the red lines represent the positive (cooperative) interactions, the blue lines represent the negative (competitive) interactions.
3.5.Correlations among environmental factors,methane metabolic microbial,and CH4 fluxes
The correlation analysis was carried out to demonstrate the correlations among environmental factors, methane metabolic microbials, and CH4fluxes (Fig. 6, Table S4, and Table S5 in the ESM). Among the environmental factors measured, total nitrogen (TN) had the most significant influence on methanogens and methanotrophs, whereas theandalso exerted obvious effects. The CH4fluxes were positively correlated with soil temperature (r = 0.757)(r: Pearson correlation coefficient) but negatively correlated with the water table (r = -0.539), TN (r = -0.231),(r = -0.425),(r = -0.336), and(r = -0.202).The cumulative CH4emissions were positively correlated with the average clustering coefficient of the methanogenic community (r = 0.759), the diameter (r = 0.871) and average path length (r = 0.641) of the methanotrophic community,and the proportions of negative edges between methanogenic and methanotrophic communities (r = 0.961).
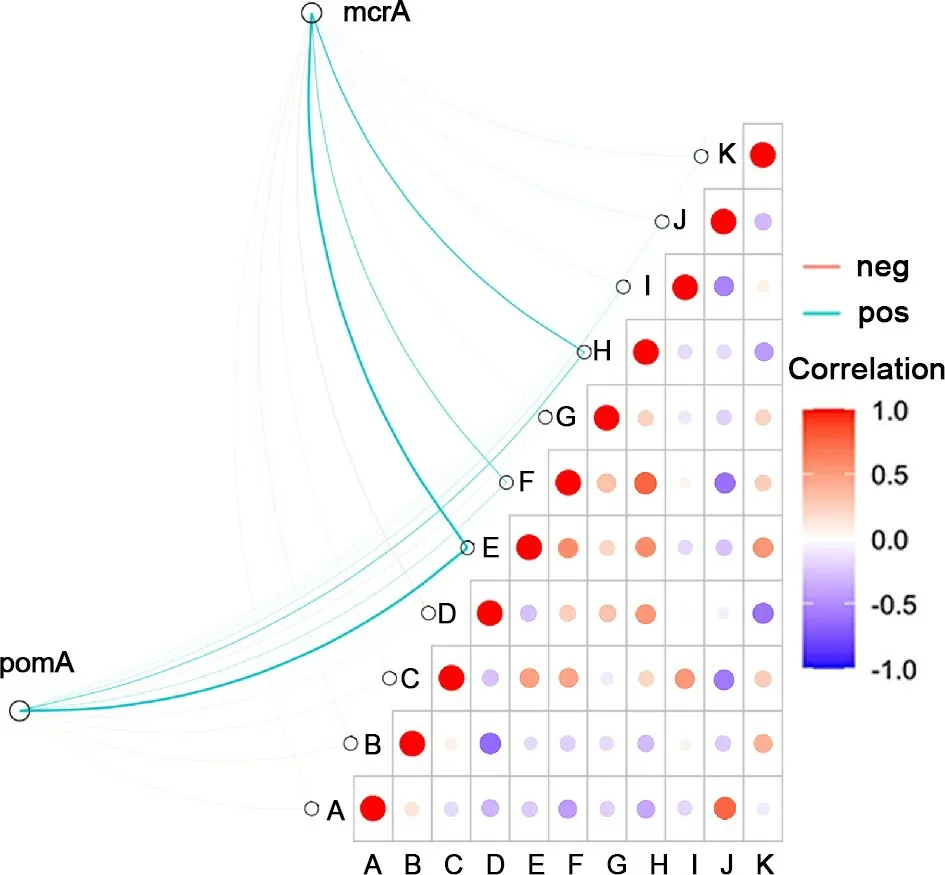
Fig. 6 Correlations among environmental factors, methane metabolic microbials, and methane fluxes. In order from A to K are: CH4 fluxes, water table, pH, Oxidation-Reduction Potential (Eh), total nitrogen (TN), -N, -N, -N,total organic carbon (TOC), soil temperature (Ts), and soil water content (SWC).
4.Discussion
Methane emissions from the Dajiuhu subalpine peatland had obvious seasonal variations, CH4emissions were highest in summer and lowest in spring. The remarkable changes of CH4fluxes in wetlands were observed in previous studies,with the lowest emissions occurring in winter (Pypker et al.,2013; Zhang et al., 2016; Drollinger et al., 2019). However,in our study, there was a remarkable decrease in CH4fluxes during spring. It is clear that methanogens are important sources of CH4in wetlands (Thauer et al., 2008), and the biological activity of methanogens decreases in winter.Notably, CH4fluxes may fall to their minimum in spring.Some studies proposed that the abundances of methanogenic and methanotrophic communities underwent periodic variations (Chapman et al., 2017; Ren et al., 2018),but it was not a sufficient explanation for the changes of CH4fluxes.
In complex wetland ecosystems, interactions among methane metabolic microbial communities may have a greater influence on ecosystem functions. Using network analysis to explore the cooperative and/or competitive relationships between microbial taxa in complex communities could help us to understand the ecological laws and ascertain the functional roles of microbes comprehensively (Ma et al.,2016, 2020). In the present study, pMENs analysis was used to explore the variations of interactions between methanogenic and methanotrophic communities. The results demonstrated that the seasonal variations of the interactions between methanogens and methanotrophs were a crucial factor in CH4emissions. Moreover, some keystone species that were discerned by network analysis had correlational relationships with CH4 fluxes, reflecting their importance in mediating CH4fluxes.
Network modeling provides a great advantage in incorporating the complex relationships among microbes into an integrated pattern (Bascompte, 2007). The marked variations observed between the four seasonal networks indicated the variable interactions among methane metabolic microbial communities based on the season, which may affect the CH4fluxes. The largest number of nodes and edges was observed in the spring networks. Similarly, the high average degree and short average path length indicate that the spring networks had tight connectivity, conducive to the rapid and effective transmission of information (Zou et al., 2007). The edges in the network could be used to infer the interactive relationship between microbes. Positive correlations might reflect the same ecological niche or symbiotic relationship of the microbes allowing bacterial communities to potentially mitigate environmental stresses and expand their ecological niches through positive interactions (Zhang et al., 2019). In contrast, negative correlations suggest the presence of potential competition or a predation relationship (Layeghifard et al., 2017), which seemed more important when resources were relatively scarce (De Menezes et al., 2017). The largest and the smallest proportions of methanogenic negative edges and methanotrophic positive edges were presented in the spring networks, respectively. The intense competition among methanogens limited the production of CH4, while better cooperation among methanotrophs was conducive to the consumption of CH4. In summer, with the easing of competition between methanogens and the aggravation of competition between methanotrophs, a better realization of methanogenic community functions led to a general increase in the CH4emissions. In networks, nodes in the same module have similar ecological functions and niches(Newman, 2006), less modules could ensure a more efficient regulation and communication between modules when facing environmental stimuli. It follows that in summer, modules of the methanogenic and methanotrophic networks were the smallest and the largest, respectively, which helps to explain that the centralized functions and niches in methanogenic communities were advantageous to CH4production, whereas methanotrophic communities could not efficienly respond to external disturbances and maintain functional stability.
In addition, the variations of topological roles in networks could also support our conclusions. Network hubs strongly support the structure of ecological networks, and are expected to create niches for other taxa (Toju et al.,2018). Only one network hub was found belonging to Methylocystaceae in the methanotrophic spring network. Module hubs and connectors are keystone species of the pMEN,which critically impact microbial community structures and their potential functions (Berry and Widder, 2014; Xie et al.,2020). For methanogens, growth in the number of module hubs in the winter and summer networks was observed, and connectors increased in the spring network. In terms of methanotrophs, there were more module hubs in the autumn and winter networks and more connectors in the summer network. Ninety-three percent of module hubs and connectors of the methanogenic networks, belonging to Methanomicrobiales and Methanocellales, were assigned to Methanoregula formicica and Methanocella arvoryzae, respectively, and both were able to utilize H2/CO2only to produce CH4(Horn et al., 2003). Methanoregula formicica had more negative than positive interactions with other OTUs, most of the time, which were liable to survive in the fierce competition; whereas, Methanocella arvoryzae only showed strong negative interactions with other OTUs in spring. Moreover,in agreement with previous studies, the results show that the presumptive keystone species differed as environmental conditions changed (Lu et al., 2013; Berry and Widder, 2014;Lupatini et al., 2014). Methanocella arvoryzae occupied the majority of module hubs in the summer network; on the other hand, most of the module hubs and connectors in other seasons were Methanoregula formicica.
Pearson's correlation analysis showed that Methanoregula was negatively correlated with CH4fluxes; nevertheless,Methanocella positively correlated with CH4fluxes (Table S6 in the ESM). Therefore, Methanoregula formicica inhibited CH4production when it occupied a large ecological niche in the spring. In contrast, Methanocella arvoryzae enhanced CH4production and emissions with a more favorable microbial community in the summer. Seventy-six percent of module hubs and connectors of the methanotrophic networks were assigned to Methylocapsa aurea, Methylocystaceae, and Candidatus Methyloumidiphilus. Methylocapsa aurea and Methylocystaceae belong to Rhizobiales and are type II methanotrophs. Candidatus Methyloumidiphilus belongs to Methylococcales and is a type I methanotroph.Type I methanotrophs adapt to the aerobic environment; however, the anaerobic environment is more suitable for type II methanotrophs (Amaral et al., 1995). Consistent with previous research, type II methanotrophs were the dominant flora in Dajiuhu subalpine peatland, characterized as an acidic,anaerobic wetland (Chen et al., 2008). Methylocapsa aurea had more negative than positive interactions with other OTUs most of the time. Methylocystaceae and Candidatus Methyloumidiphilus alinensis exhibited a similar change pattern, with more negative connections occurring in winter and summer with fewer in spring and autumn. Connectors and module hubs observed in the summer network were almost entirely Methylocystaceae, but the Methylocystaceae population plunged and even disappeared in the other seasons. Methylocystaceae showed positive correlations with CH4fluxes (Table S6), indicating that its roles in microbial communities have a critical impact on CH4emissions. Therefore, CH4oxidation was reduced and CH4emissions were increased when Methylocystaceae occupied a larger niche in summer.
Furthermore, CH4emissions in wetlands were also affected by many environmental factors. From the perspective of microbes, both methanogens and methanotrophs that were influenced by environmental factors could impact CH4fluxes. Pearson's correlation analysis showed that the CH4fluxes were significantly and positively correlated with soil temperature. The bioactivity of methanogens was relatively higher at 0°C-35°C. In a certain range, the diversity and quantity of methanogens increased with the rise of temperature, and the rate of CH4production grew accordingly(Kolton et al., 2019). In addition, summer was the growth period for Sphagnum palustre. During that time, the degradation rate of root exudates was accelerated, and the supply of methanogenic substrates was increased, which proved conducive to CH4production and emissions. The optimal temperature for methanotrophs was 25°C, but methanogens were much more sensitive to temperature than methanotrophs.Methane (CH4) can be oxidized by methanotrophs at both low (-2°C) and high (30°C) temperatures (Chowdhury and Dick, 2013). In the study area, the soil temperature in spring was only 9°C-11°C, and the activity of methanogens decreased. At the same time, the methanotrophs maintained high activity under this condition which reduced the emissions because of steady CH4oxidation. The CH4fluxes were negatively correlated with soilN, and TN, as well. Significant effects on methanogens and methanotrophs of TN,were also shown by the correlation analysis. The results demonstrated that the contents of andand TN demonstrated a downward trend from winter to the next autumn.Microbes could use nitrates as electron acceptors in an anaerobic environment when oxidizing organic substrates (Bodelier et al., 2000), the gradual climb in nitrogen uptake by the growing plants could diminish the nitrogen available for CH4oxidation, which contributed to the high emission rates of CH4summer when plants matured (Bodelier and Laanbroek,2004). Therefore, regulating the interactions between methanogens and methanotrophs through environmental factors may be an effective method to deal with excessive CH4emissions in wetlands.
The study provided a perspective to further reveal the impacts of microbes on CH4emissions in wetlands; however, it was not enough to consider the interactions between methanogenic and methanotrophic communities. In future research, the role of other relevant microbes in CH4emissions should be involved.
5.Conclusion
In conclusion, the seasonal co-occurrence patterns of methanogenic and methanotrophic communities and microbial driving mechanisms of CH4fluxes in Dajiuhu subalpine peatland were evaluated. The results implied that the methanogenic and methanotrophic co-occurrence patterns contributed to the seasonal variations of CH4fluxes. Specifically, the interactions, connectivity, and modularity of microbial networks were tied to CH4fluxes. The most complicated interactions among microbes and lowest CH4fluxes were observed in spring with the intense competition among methanogens. At the same time, methanotrophs demonstrated better cooperation, which was not conducive to the production of CH4and, instead, supported the consumption of CH4. In contrast, the simplest networks and the highest CH4flux occurred in summer. Correspondingly, seasonal variations of topological roles and keystone species were closely related to CH4emissions, which suggested their importance in mediating CH4fluxes. Methanoregula formicica was negatively correlated with CH4fluxes and occupied larger ecological niches in the spring network. In contrast, Methanocella arvoryzae and Methylocystaceae positively correlated with CH4fluxes and adapted better to the microbial community in the summer. The results also indicated that soil temperature and nitrogen were crucial environmental factors that influenced CH4fluxes by indirectly affecting the biological activity of methanogens and methanotrophs.
Acknowledgements.This work was supported by the National Science Foundation of China (Grant No. 31971490). We thank the Institute of Shennongjia National Park Administration Bureau for data collecting assistance.
Electronic supplementary material:Supplementary material is available in the online version of this article at https://doi.org/10.1007/s00376-021-1255-z.
 Advances in Atmospheric Sciences2022年8期
- Advances in Atmospheric Sciences的其它文章
- COP26: Progress, Challenges, and Outlook※
- Climate Warming Mitigation from Nationally Determined Contributions※
- The Chinese Carbon-Neutral Goal: Challenges and Prospects※
- A Concise Overview on Solar Resource Assessment and Forecasting※
- Frontiers of CO2 Capture and Utilization (CCU)towards Carbon Neutrality※
- The Variability of Air-sea O2 Flux in CMIP6: Implications for Estimating Terrestrial and Oceanic Carbon Sinks※
