
Usefulness of serum C-reactive protein and calprotectin for the early detection of colorectal anastomotic leakage: A prospective observational study
2022-07-08 03:06NunoRamaMarleneLagesMariaPedroGuarinoOscarLourengoPatriciaMottaLimaDianaParenteCandidaSilvaRicardoCastroAnaBentoAnabelaRochaFernandoCastroPocasJoaoPimentel
World Journal of Gastroenterology 2022年24期
Nuno ] G Rama, Marlene C C Lages,Maria Pedro S Guarino,Oscar Lourengo, Patricia C Motta Lima, DianaParente, Candida S G Silva, Ricardo Castro, Ana Bento,Anabela Rocha, Fernando Castro-Pocas,Joao Pimentel
Abstract
Key Words: Anastomotic leakage; Colorectal; Surgery; Biomarkers; C-reactive protein; Calprotectin
INTRODUCTION
Colorectal anastomotic leakage (CAL) is one of the most frequent complications after colorectal surgery,representing a dreaded issue for patients and surgeons. The reported incidence ranges from 0.2% to 27.2%, depending on the study nature, level of anastomosis, or pathology[1-5]. This occurrence is associated with increased morbidity, mortality, reoperation, and health care costs[6-9]. Thus, its clinical relevance should not be underestimated. It also has a negative impact on a patient’s quality of life[2,4].
Early CAL detection is key to decreasing related morbidity and mortality; therefore, a prompt and timely diagnosis is crucial[5,10,11]. Initially, it is difficult to distinguish CAL from other postoperative abdominal complications. Surgeons should be aware of subtle clinical signs, and then order additional tests including serum biomarkers, proper imaging, or even early reoperation. Unfortunately, diagnosis is often delayed, because of a misleading clinical picture, non-systematic assessment, or inconclusive investigations[11-15]. Βesides clinical parameters, several biomarkers (plasma or intraperitoneal),imaging methods such as abdominal computed tomography (CT) scan or water-soluble contrast enema,and scores have been proposed to reduce the time to diagnosis and to establish an appropriate management pathway[16-19].
Plasma C-reactive protein (CRP) has been proposed as an early predictor of postoperative infectious complications[16,20-23]. This biomarker is an acute phase protein, increasing between 6 h and 48 h after surgery, and returning to baseline if inflammation ceases. After this period, a high CRP level is associated with postoperative infectious complications, especially in patients with CAL[24-26]. On the other hand, calprotectin (CLP) is a useful biomarker of inflammation and infection[18,27]. Fecal CLP has been widely used as a marker of gastrointestinal inflammation. However, some authors suggest that high levels of serum CLP could be associated with septic intra-abdominal complications, such as earlystage CAL[18,28].
The aim of this study was to evaluate the utility of plasma CRP and CLP, individually or combined,to shorten the time to CAL diagnosis.
MATERIALS AND METHODS
Study design and population
This was a prospective observational, single-center study that included adults over 18-years-old who underwent urgent or elective colorectal resection, regardless of the surgical approach (open or laparoscopic), indication (benign or malignant), and option for a protective stoma. The study was conducted in the colorectal division of a non-academic hospital accredited by Joint Commission International®and included about 500000 inhabitants. The data were collected between March 1, 2017 and August 31, 2019.The local ethics committee approved the study, and potential participants provided written informed consent before inclusion.
Definitions
CAL was defined in accordance with the following criteria[29]: (1) Clinical: Enteric discharge from abdominal drain or wound, rectovaginal fistula, or anastomotic defect found by digital examination; (2)Radiological (CT): Extravasation of endoluminally administered contrast, intra-abdominal collection around the anastomosis, presacral abscess near the anastomosis or perianastomotic air, and free intraabdominal air; and (3) Surgical findings (reoperation): Necrosis of the anastomosis or signs of peritonitis and anastomotic defect.
Faced with clinical deterioration and/or serum biomarker increase, patients underwent further imaging with abdominopelvic CT scan (and water-soluble contrast enema if colorectal anastomosis was present). Once diagnosed, anastomotic leakage was classified into two categories: (1) Minor: Patients with CAL and Clavien-Dindo grade I or II, requiring no active intervention (radiological or surgical intervention) (Grade A of the International Study Group of Rectal Cancer definition); and (2) Major: All other patients with CAL[30,31]. Definitions of other postoperative complications, such as pneumonia,urinary tract infection, paralytic ileus, and surgical wound infection, are available in Supplementary material 1A (Definitions).
Exclusion criteria
Patients were excluded from the study if they were younger than 18-year-old, pregnant, unable to give or not providing written informed consent, R0 resection with anastomosis not having been performed,or presence of inflammatory bowel disease.
Study protocol and variables
Prospective data were collected and recorded in an electronic database according to the study protocol (Supplementary material 1Β – Study protocol). Five biomarkers were measured in the first 5 postoperative days (POD), including white blood cell (WΒC) count, eosinophil cell count (ECC), CRP, CLP,and procalcitonin (PCT). Clinical criteria, such as abdominal pain and clinical condition, were also assessed. Βlood samples were analyzed at the Leiria Hospital Centre laboratory, according to the techniques described in Supplementary material 1C (Laboratory). The 90-d follow-up included data of all postoperative complications, the length of hospital stay, and the readmission rate. Discharge criteria are available in the Supplementary material 1Β (Study protocol). All patients received prophylactic antibiotic accordingly to hospital infection control committee protocol.
Statistical analysis
Data were analyzed by using standard descriptive statistics and graphical analysis. One-way analysis of variance was performed to compare the differences in mean biomarkers’ values across the three relevant groups of patients (G1 – no complications; G2 – complications not related to CAL; and G3 – CAL). Chisquared tests were conducted to assess the association between other categorical variables and the patients. Receiver operating characteristic (ROC) curve analysis was employed to evaluate each biomarker as an appropriate classifier to detect CAL early. The area under the receiver operating characteristic curve (AUROC) was used to establish the diagnostic performance of the studied biomarker.Liu’s method was used to establish the threshold value of each biomarker, and its sensitivity (SS) and specificity (SP) were defined[32]. The negative likelihood ratio (NLR) and positive likelihood ratio(PLR), and the negative predictive value (NPV) and positive predictive value (PPV) were computed by combining the observed incidence of CAL with the estimated SS and SP at the optimum cut-off value.
The added value of combining two different biomarkers, observed on POD3 or POD5, as a classifier to predict early CAL was explored. Regression models (probit, logit, and complementary log-log) were used to analyze binary dependent variables, and the observed CAL status (0/1) in a pairwise manner of all biomarkers included in our study: WΒC, ECC, CRP, PCT, and CLP. Several potential classifiers of CAL were built, applying a non-linear combination of two different biomarkers. To minimize overfitting, the “leave-one-out” methodology was adopted[33]. The AUROC graph was used to select the classifier (defined by the model and the combination of two biomarkers) with the best predictive diagnostic performance. Liu’s method was adopted to select the cut-off value for CAL.
The expected reduction in time to CAL diagnosis obtained by using one biomarker or a pairwise combination of biomarkers was estimated. This was the difference between the observed and the expected mean time to CAL diagnosis, if a specific classifier is used. The expected time to CAL diagnosis was computed by using the following expression: S × d1 + [(1 – S) × d2], where S is the SS of the classifier, d1 is the POD of the classifier yielding a positive cut-off value for CAL, and d2 is the day of diagnosis if the classifier provides a false-negative result (time to CAL diagnosis estimated in the dataset). The statistical methods of this study were reviewed by Óscar Lourenço from the Faculty of Economics, CeΒER, University of Coimbra, Portugal. All data management and statistical analyses were conducted with Stata Statistical software (Release 16; StataCorp, College Station, TX, United States).
RESULTS
Patients and outcomes
During the study period, we included 458 consecutive patients who underwent colorectal resection, and 62 (13.5%) were ruled out [exclusion criteria (n= 31), no consent (n= 15), no anastomosis (n= 16)] as shown in Figure 1. Patient characteristics, divided into three groups (G1, G2, and G3, as previously defined), are shown in Table 1. Age, the Charlson Comorbidity Index, and American Society of Anesthesiologists grade seem to affect CAL onset.
Table 2 summarizes the main operative characteristics. Eighty-two percent of patients had a laparoscopic approach, and the most common procedures performed were right colectomy (n= 196; 49.5%)and sigmoid colectomy/rectosigmoid resection (n= 74; 18.7%). The surgical approach (P< 0.001), the volume of blood loss (P< 0.001), the occurrence of intraoperative complications (P< 0.001), and the duration of the procedure (P= 0.011) were significantly related to the development of CAL.
In this study, CAL developed in 25 of 396 patients (6.3%) and was more frequent in men than women(68%vs32%). Twenty-three patients with CAL (92.0%) were diagnosed during the first hospital admission. The mean ± SD and median time for CAL detection were 9.0 ± 6.8 d and 8 d (interquartile range = 7), respectively. Anastomotic leak was significantly associated with a longer hospital stay(median of 21 dvs7 d and 13 d, in G1 and G2 patients, respectively;P< 0.001), the readmission rate(20%vs6.4% and 5.4%), and the reoperation rate (12%vs3.2% and 1.8%). Table 3 provides a summary of 90-d morbidity and mortality rates. Βased on the Clavien-Dindo classification, grades III and IV complication were significantly higher in the G3 cohort (84.0%vs17.0%;P< 0.001) (Table 4).

Table 1 Patient demographic and clinical characteristics
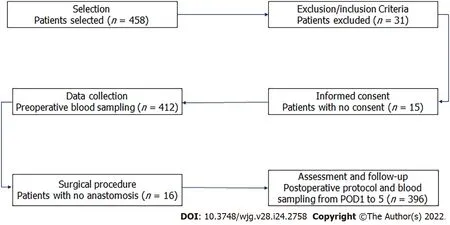
Figure 1 Flow diagram of patients according to the study protocol. POD1: Postoperative day 1.
Table 5 outlines the intraoperative and postoperative details of patients with CAL (G3) based on the CAL classification (minorvsmajor). Seven patients (28.0%) were managed nonoperatively and two(8.0%) underwent radiologic drainage of intraabdominal collections. The remaining 16 patients (64.0%)required surgical intervention. Of the 16 reoperated patients, 10 (56%) had an anastomosis takedown with an end stoma and 6 (44%) received a defunctioning stoma. The 90-d mortality rate was 0.8%,representing 3 patients with CAL.
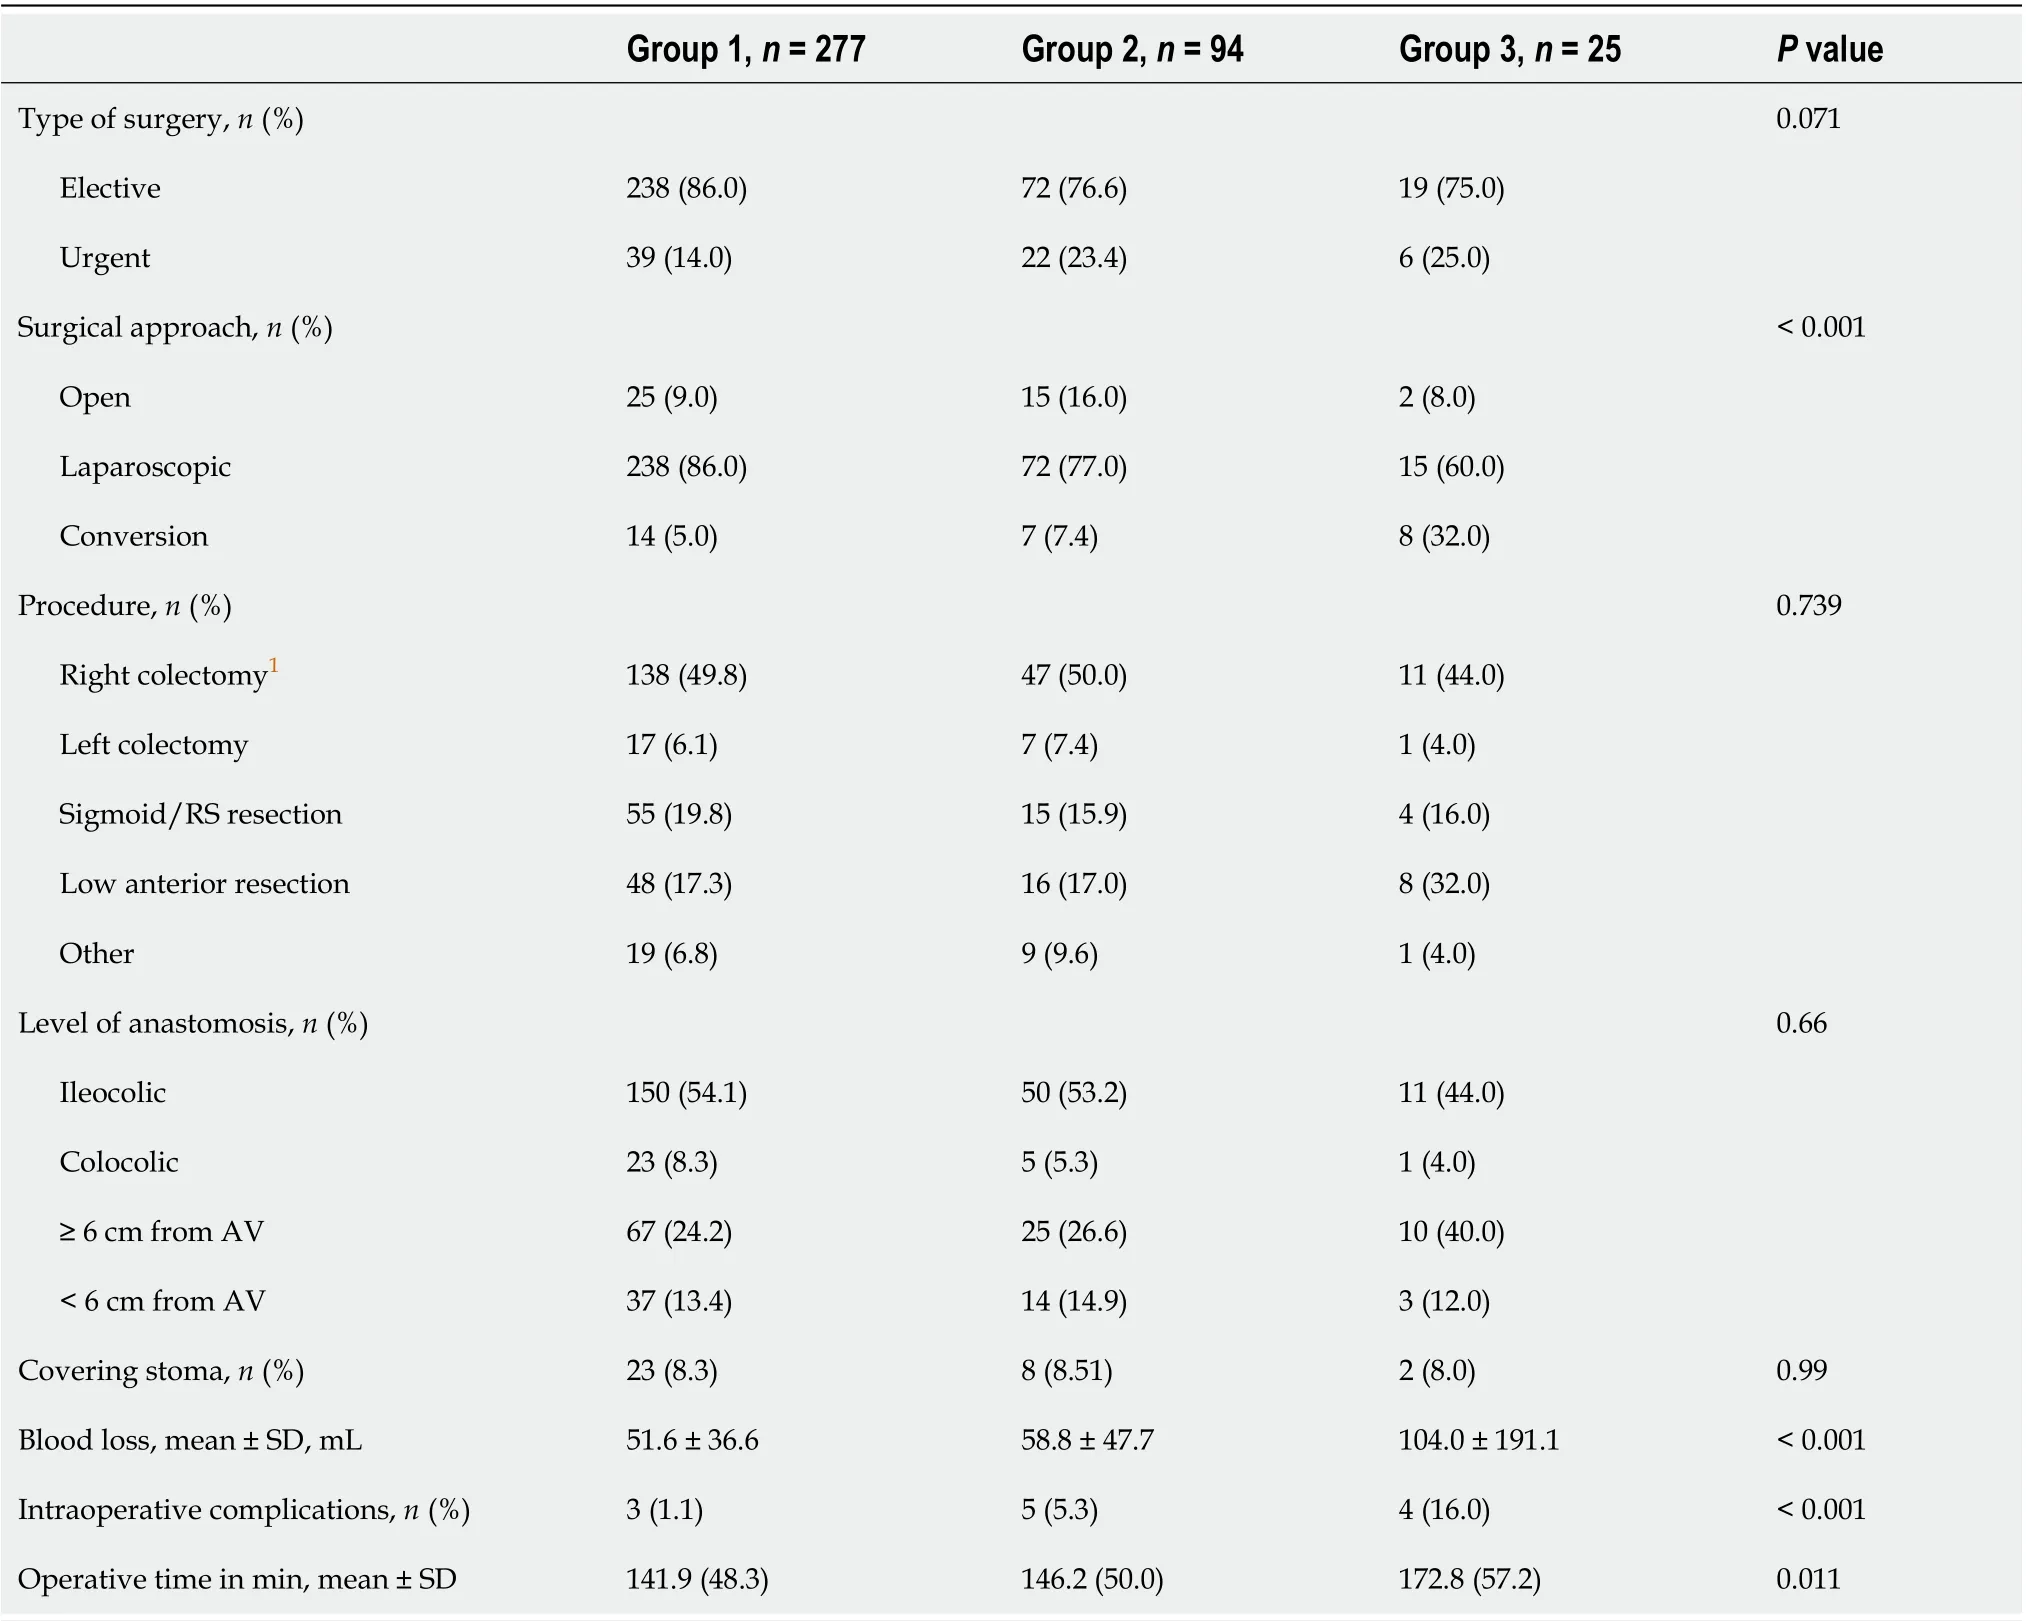
Table 2 Patients’ operative characteristics
Clinical criteria – postoperative trend and predictive effect
Abdominal pain: Abdominal pain was markedly higher and persistent from POD3 onwards in G3 patients (Figure 2A). The AUROC for abdominal pain on POD3, POD4, and POD5 was 0.77, 0.84, and 0.83, respectively, as shown in Supplementary Table E (Supplementary material 2A) and Figure 3A. The predictive effect was higher on POD4 with an estimated AUROC of 0.84.
Clinical condition: The clinical condition was worse in G3 compared with G2 patients, and it was significantly different after POD3 (P=0.001). The overall postoperative trend was a declining clinical condition, as shown in Figure 2Β. The AUROC for the clinical condition on POD3, POD4, and POD5 was 0.62, 0.81, and 0.90, respectively, as shown in Supplementary Table E (Supplementary material 2A)and Figure 3Β. The prediction effect was higher on POD5 with an estimated AUROC of 0.90.
Biomarkers – postoperative trend and predictive effect
WBC count and ECC: During the first five POD, WΒC in G3 patients was higher than that in patients without CAL and was significantly different on POD2, POD4, and POD5 (P= 0.01 for each day). On the other hand, ECC was lower in G3 patients and significantly different on POD1 and POD5 (P= 0.04 andP= 0.01, respectively), as presented in Supplementary Figures 1 and 2 (Supplementary material 2Β).Overall, the postoperative course showed a sustained trend for both blood cell counts, except for ECC on POD5. The AUROC for WΒC and ECC from POD1 to POD5 is presented in Supplementary Figures 3 and 4, respectively ( Supplementary material 2Β). The predictive effects of blood cell count were better on POD5. On POD5, when ECC was greater than 250 cells/μL, the AUROC, SS, and SP were 0.70, 89.0%, and 43.0%, respectively, as shown in Table 6.
CRP, PCT, and CLP: The mean values of CRP, PCT, and CLP increased promptly after surgery in allgroups. CRP decreased in G1 patients and remained elevated in patients with a complicated postoperative course, but was significantly higher than in G3 patients. On POD5, the mean CRP level in G3 patients was significantly higher than that in G1 patients (195.5 ± 139.9 mg/Lvs59.5 ± 43.4 mg/L;P< 0.00001) (Figure 4A). Patients with major CAL had a higher mean CRP level than those with minor CAL (251.45 mg/dLvs107.64 mg/dL;P= 0.01) (Table 5). On POD3, POD4, and POD5, the overall diagnostic accuracy of CRP to detect CAL was expressed by an AUROC of 0.76, 0.76, and 0.81,respectively (Figure 5A). On POD5, the optimum cut-off value of 96.8 mg/L was estimated, resulting in an SS and SP of 78%, an NPV of 98%, and a PPV of 19% (Table 6).

Table 3 Ninety-day postoperative morbidity and mortality
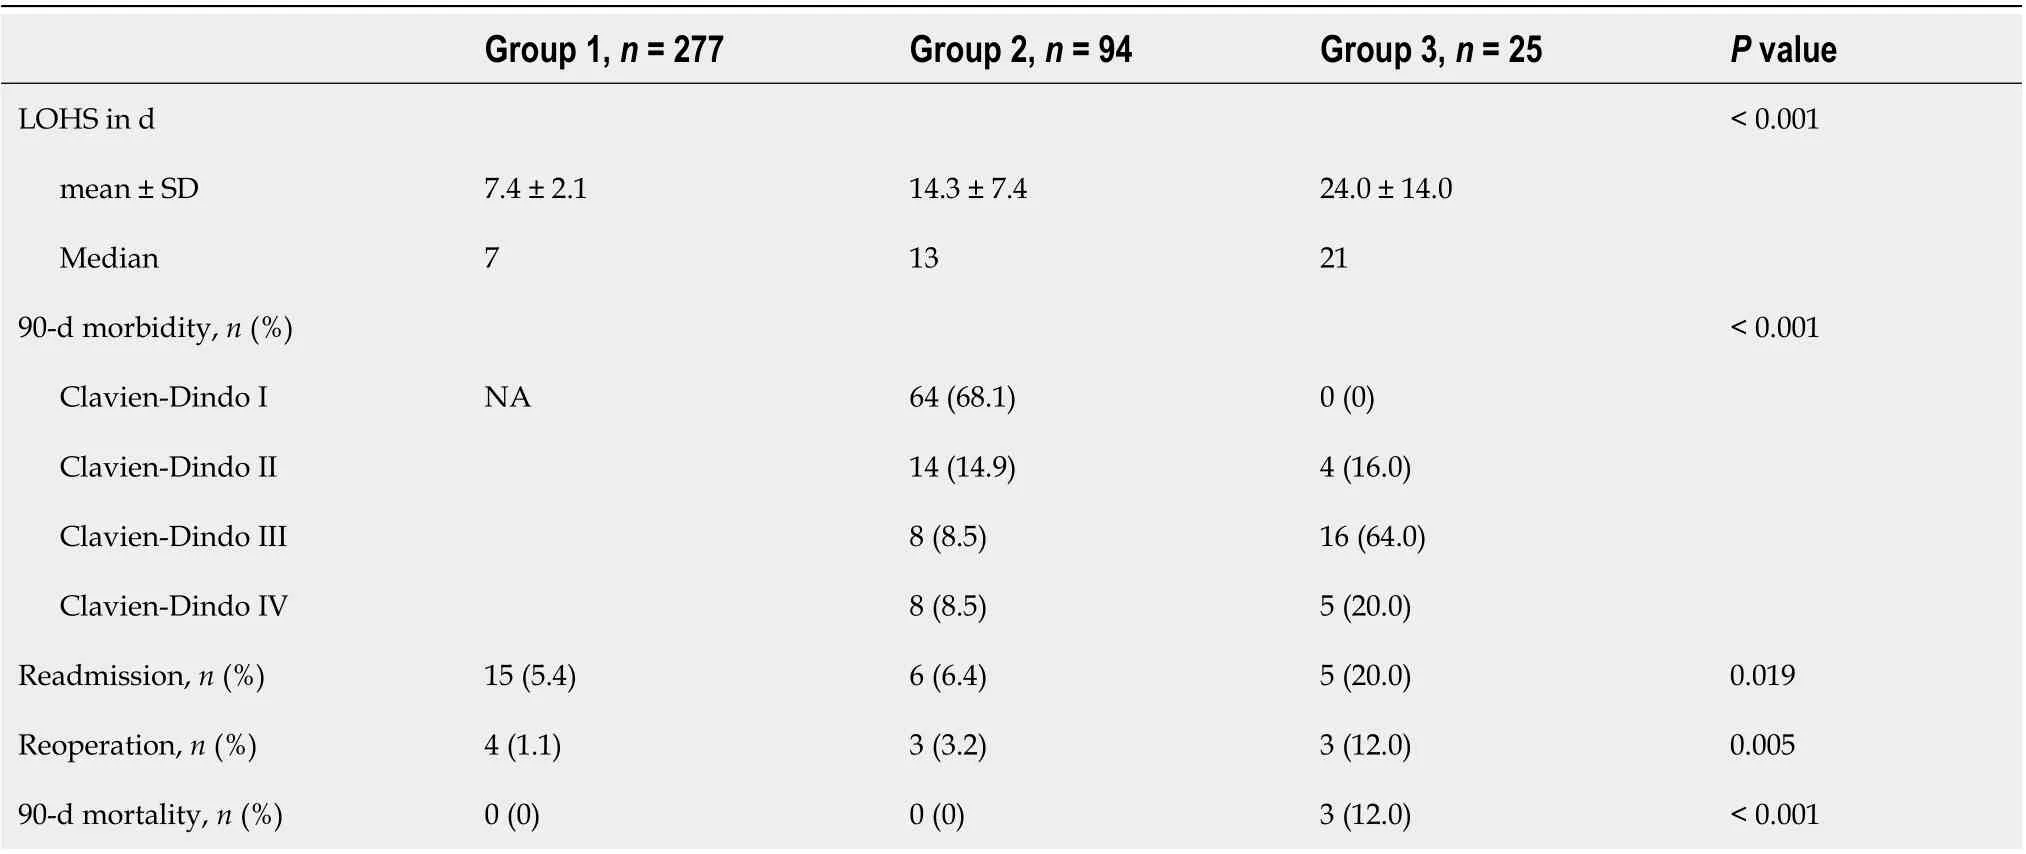
Table 4 Short-term outcomes by group
The PCT level tended to be stable from POD3 onwards. The mean values were higher in G3 patients than in patients without CAL, but without statistical significance [on POD5, 0.23 ± 0.08 ng/mLvs0.22 ±0.07 ng/mL; Supplementary Figure 5 (Supplementary material 2C)]. The AUROC on POD3, POD4, and POD5 was 0.57, 0.50, and 0.61, respectively, as shown in Supplementary Figure 6 (Supplementary material 2C). The best predictive effect was on POD5. When PCT was greater than 0.39 ng/mL, the SS and SP were 44.0% and 79.0%, respectively (Table 6).

Table 5 Intraoperative and postoperative details of patients with colorectal anastomotic leakage (minor vs major)
In the first 5 POD, the mean CLP value tended to follow the pattern of CRP, although it was not as pronounced (Figure 4Β). The mean CLP value was significantly higher in G3 patients from POD2 onwards. On POD3, the mean values of G1vsG3 patients were 5.26 ± 3.58 μg/mLvs11.52 ± 6.81 μg/mL(P< 0.00005). On POD3, POD4, and POD5, the CLP AUROC was 0.78, 0.67, and 0.65, respectively, as presented in Table 6 and Figure 5Β. On POD3, a cut-off value of 6.57 μg/mL yielded a sensitivity of 71.0% and a specificity of 72.0% (Table 6).
Finally, when we analyzed the best predictors (CRP and CLP) for major CAL, the AUROC of CRP was 0.74 and 0.88 for POD3 and POD5, respectively. CLP was a better predictor of CAL than CRP at POD3, with an AUROC of 0.92 (Figure 5C and D).
Combination of biomarkers: Tables 7 and 8 present the AUROC of several possible classifiers of CAL,built with the Probit model, on POD3 and POD5, respectively. The combination of CRP and CLP on POD3 showed the best performance, with an AUROC of 0.82 (Table 7). Of note, on POD5, the combination of CRP and ECC also generated good predictive performance (AUROC = 0.81). However,with the aim of early CAL diagnosis, we chose the combination of CRP and CLP on POD3. Thereafter,we determined the probability of CAL, based on the computed equation P (CAL) = F [-3.0842 + (0.094 ×CLP_D3) + (0.0059 × CRP_D3)], where F is the cumulative standard normal distribution. Applying Liu’s method, this classifier had an optimum cut-off point of 0.055, evidencing the existence of CAL above 0.055 on POD3, with an SS and SP of 86% and 75%, respectively. For hypothetical patient X on POD3 with CRP and CLP plasma levels of 137.4 mg/L and 8.75 μg/mL, respectively, the computed probability of CAL is high (score = 0.074). Βy adopting this classifier, the time to CAL diagnosis is estimated as 3.8 d [(0.86 × 3) + (0.14 × 9.0)], which represents a 5.2-d reduction compared with the baseline results.

Table 8 Area under the receiver operating characteristic curve of pairwise combination of biomarkers on postoperative day 5

Figure 2 Distribution of rates of abdominal pain (A) and clinical condition (B). G1: No complications; G2: Complications not related to colorectal anastomotic leakage; G3: CAL. POD: Postoperative day.
DISCUSSION
This study assessed the usefulness of biomarkers for the early detection of CAL. Clinical criteria demonstrated high diagnostic accuracy (AUROC > 0.8) on POD4 and POD5. Changes in the abdominal pain pattern and worsening of the clinical condition were associated with an increased risk of CAL diagnosis. Βoth clinical criteria seem to be an useful early markers for this condition, producing the best overall diagnostic accuracy of the parameters analyzed. Three large and well-conducted studies on the association between pain and postoperative complications are worth reporting. Βoströmet al[34]examined a cohort of 3084 patients and estimated that increased postoperative pain is associated with a high risk of CAL, being an independent marker and suggesting a need for further diagnostic measures.The other two studies had similar conclusions, although they were not exclusive for colorectal surgery[14,35]. A worse clinical condition and abdominal pain not localized to the wound are two of four modified Dutch leakage (DULK) score criteria, scoring 1 point each. Using a cut-off value of 1 point produced an overall SS and NPV of 97.0% and 99.5%, respectively[10]. We should bring the clinical method to the forefront, being aware of the clinical signs of CAL. They are very helpful for the early diagnosis, as “red flags” for further investigation.
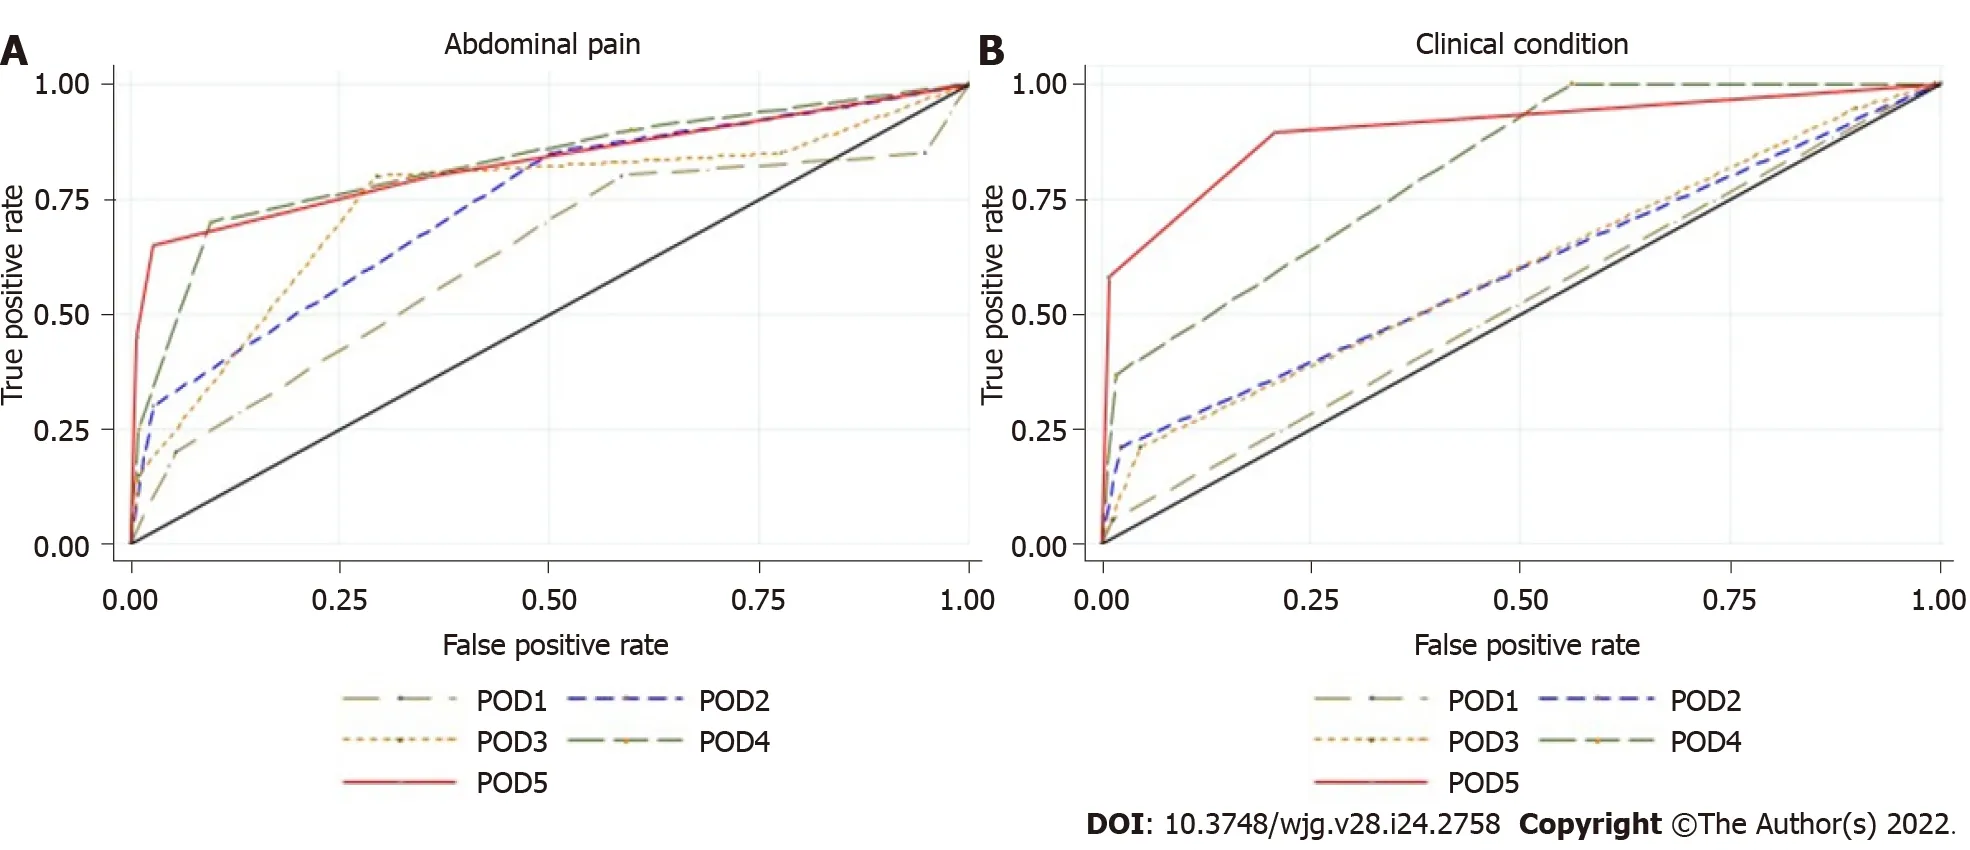
Figure 3 Area under the receiver operating characteristic curve of colorectal anastomotic leakage for clinical criteria. A: Abdominal pain from postoperative day 1 to postoperative day 5; B: Clinical condition from postoperative day 1 to postoperative day 5. POD: Postoperative day.

Figure 4 C-reactive protein (A) and calprotectin (B) levels. Values are the mean ± SE. G1: No complications; G2: Complications not related to colorectal anastomotic leakage; G3: CAL; ▲: P statistically significant (P < 0.05).
In our study, particularly on POD4 and POD5, WΒC and ECC showed a distinct tendency in patients with and without CAL, with a high NPV (from 94%-98%) but low accuracy (AUROC from 0.54 to 0.70).In G3 patients, WΒC plateaued after the acute inflammatory response, a phenomenon that was notably different from patients without CAL. In a large retrospective study, Warschkowet al[16] found that the WΒC level contributed little to the early detection of septic complications, with a lower diagnostic accuracy than plasma CRP. In several other studies, researchers have estimated, from POD5 to POD7,an AUROC and SS ranging from 0.63 to 0.82 and from 58% to 74%, respectively[15,16,20,24,35].
Some researchers have proposed eosinopenia as a biomarker in this scenario. They concluded that it might help to identify several sepsis-related conditions, distinguished from other causes of systemic inflammatory response syndrome. It seems to be an interesting biomarker because of its widespread availability and low cost[36]. Shaabanet al[37] defined an optimum cut-off value of 50 cells/μL, which produced an SS, SP, and NPV of 81%, 65% and 80%, respectively. At hospital admission, ECC < 40 cells/μL is an independent prognostic factor for mortality[38,39]. Our study is original in assessing the usefulness of ECC for the early diagnosis of CAL. The mean ECC level showed a non-significant decline after POD4 in G3 patients, and a modest diagnostic accuracy (AUROC from 0.54 to 0.70) when compared with other biomarkers. Nevertheless, ECC could still be used in CAL diagnosis as a fast,simple, convenient, and inexpensive biomarker. It should be considered in the decision-making process and future research[40].

Figure 5 Area under the receiver operating characteristic curve of colorectal anastomotic leakage. A: For C-reactive protein from postoperative day 1 to postoperative day 5; B: For calprotectin from postoperative day 1 to postoperative day 5; C: For calprotectin from postoperative day 3 to postoperative day 5;D: For C-reactive protein from postoperative day 3 to postoperative day 5. Left: All leaks; Right: Major leaks; POD: Postoperative day.
The usefulness of CRP as a biomarker for early detection of CAL has been investigated by several groups[19,25,39,41,42]. In this study, the plasma CRP level exhibited a propensity to normalize from POD3 onwards in patients without CAL (G1 and G2). However, it remained steadily increased in G3 patients, with a markedly high mean value from POD1 to POD5. Yeunget al[43] performed the most comprehensive meta-analysis available in the literature, including nearly 7000 patients pooled from 23 studies. From POD1 to POD7, patients with CAL had a significantly higher mean CRP level compared with patients without CAL (P< 0.001)[43]. In this study, CRP was the best predictor for CAL on POD4 and POD5, with a maximum AUROC of 0.81 (cut-off value of 96.8 mg/L and an NPV of 98%) on POD5.Similar results have been published by other authors. Ortega-Deballonet al[26] estimated on POD4 an AUROC of 0.72 with a cut-off of 125 mg/L, yielding an SS and NPV of 81.8% and 95.8%, respectively.Garcia-Graneroet al[25] reported that CRP level showed a good predictive ability for major CAL on POD5, with an AUROC of 0.85 (cut-off value of 135 mg/L and an NPV of 98%). In the Italian ColoRectal Anastomotic Leakage (iCral) multicentric prospective observational study, the CRP level was a good positive and excellent negative predictor of CAL, with an AUROC of 0.81 on POD6 (cut-off value of 81.5 mg/L), and an SS and NPV of 80.9% and 97.7%, respectively[41]. In the meta-analysis by Yeunget al[43], AUROC analysis established a threshold CRP level for CAL of 115 mg/L on POD5, with an SS and SP of 100%. All of these authors recommended CRP levels to predict CAL, and our group advocates a similar practice and suggests the use of this biomarker to expedite further investigation and treatment[25,26,41,43].
CLP, a sign of neutrophil activation, could be a promising early marker for excessive inflammatory response in major abdominal catastrophes, such as CAL. To date, only Reisingeret al[18] have studied the predictive value of CLP in CAL diagnosis. In G3 patients, the mean postoperative CLP level peaked on POD3 and was notably higher, persisting thereafter. On POD3, the AUROC (0.78) and SS (71%) were slightly higher than the CRP level, although they were lower than those obtained in the pioneering study by Reisingeret al[18] (0.92 and 86%, respectively). One possible explanation could be our comprehensive definition of CAL and the larger sample size. It remains unclear to what extent CLP level is an early predictor that is better than CRP for detecting CAL. As a neutrophil activation marker, CLP could be increased early after anastomotic failure, compared with CRP, which indicates a delayed systemic inflammatory response. Our study shows that CLP is worth evaluating for early diagnosis of CAL.
We demonstrated in the first 5 POD, the mean PCT values were marginally higher in G3 patients but with lower accuracy, SS, and SP than CRP and CLP levels. However, it had a high NPV (> 95%), making it an adequate and useful marker for early and safe discharge after colorectal surgery, considering the current enhanced recovery after surgery routine. In contrast to our study, Giaccagliaet al[17] estimated that on POD5, PCT had better accuracy than CRP (0.86vs0.81), as well as a high NPV (98.3%). A recent meta-analysis published by Su'aet al[44] determined a diagnostic accuracy of 0.88 on POD5 and an optimum cut-off value on POD3 and POD5 of 0.25 and 680 ng/mL, respectively. The NPV ranged from 95% to 100%. In agreement with these authors, we believe that PCT is a useful negative predictor for CAL; as a single test, however, it is worthless for CAL diagnosis.
We verified that, with the exception of plasma CRP on POD5 (AUROC > 0.80), each biomarker individually was a modest predictor of CAL[45]. The combination of two or more biomarkers has been considered in previous studies[17,18,41]. In this study, the combination of CRP and CLP values on POD3 increased diagnostic accuracy, shortening the mean CAL diagnosis by 5 d. This reduction would likely lead to reduced morbidity and mortality. Reisingeret al[18] confirmed a significant improvement in diagnostic accuracy (AUROC = 0.93) with the combination of CRP and CLP plasma levels on POD3,an SS of 100%, and an SP of 89.0%, decreasing the median time to diagnosis by 3 d. Furthermore,Giaccagliaet al[17] found that by adding PCT to CRP on POD5, the diagnostic accuracy markedly improved (AUROC = 0.90). Similarly, the iCral study demonstrated that the combination of CRP and PCT with a clinical score (DULK score) allowed the exclusion of CAL on POD2 (NPV = 99%)[41]. We believe that a user-friendly diagnostic tool, combining CLP and CRP levels by this mathematic model,would help the surgeon to diagnose CAL early. Consequently, this biomarkers’ combination may be included in a standard postoperative surveillance program, as a warning tool for CAL. In the case of a“positive test”, this protocol recommends abdominal and pelvic CT scan or early reoperation in case of imaging-dubious or -negative, to reduce the time to CAL detection and enable prompt management.
Strengths and limitations of the study
One strength of this study was its prospective design and independent data collection model, which minimized observer bias. Second, it was one of the largest monocentric sample size published to date.Βased on the recent meta-analyses of Waterlandet al[46] van Helsdingenet al[47], only two monocentric prospective studies have enrolled more than 400 patients. Furthermore, we analyzed five biomarkers,including plasma CLP, which was first studied by Reisingeret al[18]. Third, we chose a comprehensive definition of CAL, recently defined by van Helsdingenet al[29] to include all patients with CAL,minimizing selection bias. We did not exclude minor CAL from the cohort, which also affected the predictive effect of the analyzed biomarkers. In addition, to keep the biomarkers optimum cut-off values in AUROC analysis both standardized and reproducible, we adopted Liu’s method. This method defines the optimum cut-off point as the point maximizing the product of SS and SP[48]. These reasons may explain some differences in biomarkers’ diagnostic accuracy in this study. Fourth, we tried to adapt the study protocol to daily practice, making its enforcement easier in the future. Hence, we included all patients undergoing colorectal resection, even those with a diverting ostomy. In addition, clinicians were not blinded to the daily biomarkers’ results and might use those data according to the study protocol. Finally, we proposed a predictive tool based on the combination of two biomarkers that improved CAL diagnostic accuracy. Adoption of this tool in daily practice might shorten the time to CAL diagnosis and management. Moreover, the data from this study provide information for the development of more complex mathematical predictive models, including machine learning methods.
This study had several limitations. First, the monocentric design may limit the external validity of the results. Second, our sample had some grade of heterogeneity, because the study population included benign and malignant disorders, elective and urgent procedures, and anastomosis within different levels of the colon and rectum. Third, we designed a phase I diagnostic study and estimated cut-off values for early CAL detection. However, we should change the direction of interpretation, running from the diagnostic test result toward the CAL diagnosis. To address this issue, we are performing a new multicentric prospective phase II diagnostic study, using the predictive tool and defined biomarkers cut-off values[49]. Fourth, plasma CLP measurement is expensive and these kits are not easily accessible in daily clinical practice. Finally, our study did not address the cost-effectiveness of biomarkers’ measurement. It is crucial to estimate the economic burden of CAL, including the cost related to a delayed diagnosis, the high rate of false positives, and unjustified reoperations or frequent readmissions.
CONCLUSION
In conclusion, we found that clinical criteria have added value as a warning sign of CAL. On the other hand, CRP and CLP levels are the best early predictors of CAL. Particularly relevant is the combination of CLP and CRP early during POD3, and its potential to markedly reduce the time to diagnosis of CAL.Βy reducing the time to CAL diagnosis, reduced morbidity and mortality are expected. Additional studies are needed to confirm the predictive ability of this model on early CAL detection and its utility in routine clinical care.
ARTICLE HIGHLIGHTS

FOOTNOTES
Author contributions:Rama NJM, Guarino MPS, and Lourenço Ó designed the study; Lages MCC, Castro R, Βento A,and Parente D coordinated the data collection process; Lourenço Ó and Silva CSG performed the data analyses;Rama NJM, Motta Lima PC and Guarino MPS prepared the manuscript; Rama NJM, Rocha A, Castro-Poças F, and Pimentel J revised the paper critically; All authors read and approved the final manuscript.
Supported bythe Ministry of Health – Incentive Program for the Integration of Care and Valuation of Patients’Pathways in the National Health Service of Portugal.
Institutional review board statement:This study was conducted in accordance with the Declaration of Helsinki and was approved by the Local Ethical Committee of the Colorectal Referral Centre, after authorization obtained from the Portuguese Data Protection Authority. This study is registered with the number 9930/2016 and can be consulted at https://drive.google.com/file/d/1ΒiLxWlvcrqpX4KQrjW4F2codsOOywVF/view?usp=sharing.
Informed consent statement:Informed consent was obtained from all participants included in the study.
Conflict-of-interest statement:The authors have no conflicts of interest to declare.
Data sharing statement:For additional data, Dr. Nuno Rama can be contacted by e-mail at ramanuno@gmail.com.
STROBE statement:The authors have read the STROΒE Statement – checklist of items, and the manuscript was prepared and revised according to the STROΒE Statement – checklist of items.
Open-Access:This article is an open-access article that was selected by an in-house editor and fully peer-reviewed by external reviewers. It is distributed in accordance with the Creative Commons Attribution NonCommercial (CC ΒYNC 4.0) license, which permits others to distribute, remix, adapt, build upon this work non-commercially, and license their derivative works on different terms, provided the original work is properly cited and the use is noncommercial. See: https://creativecommons.org/Licenses/by-nc/4.0/
Country/Territory of origin:Portugal
ORCID number:Nuno J G Rama 0000-0002-1572-2239; Marlene C C Lages 0000-0002-7389-6368; Maria Pedro S Guarino 0000-0001-6079-1105; Óscar Lourenço 0000-0002-3642-4919; Patrícia C Motta Lima 0000-0002-6427-8955; Diana Parente 0000-0003-0271-371X; Cândida S G Silva 0000-0002-7092-1169; Ricardo Castro 0000-0002-5110-0883; Ana Bento 0000-0002-3489-8774; Anabela Rocha 0000-0001-5000-5369; Fernando Castro-Pocas 0000-0002-2268-9107; João Pimentel 0000-0003-1908-8607.
S-Editor:Ma YJ
L-Editor:A
P-Editor:Ma YJ
 World Journal of Gastroenterology2022年24期
- World Journal of Gastroenterology的其它文章
- Patient-derived organoids for therapy personalization in inflammatory bowel diseases
- Drug-induced autoimmune hepatitis: A minireview
- Rebuilding trust in proton pump inhibitor therapy
- Pancreatic involvement in celiac disease
- Downregulation of TNFR2 decreases survival gene expression, promotes apoptosis and affects the cell cycle of gastric cancer cells
- Novel multiplex stool-based assay for the detection of early-stage colon cancer in a Chinese population