
Radiomic analysis based on multi-phase magnetic resonance imaging to predict preoperatively microvascular invasion in hepatocellular carcinoma
2022-07-08 03:06YueMingLiYueMinZhuLanMeiGaoZeWenHanXiaoJieChenChuanYanRongPingYeDaiRongCao
World Journal of Gastroenterology 2022年24期
Yue-Ming Li, Yue-Min Zhu, Lan-Mei Gao, Ze-Wen Han, Xiao-Jie Chen, Chuan Yan, Rong-Ping Ye, Dai-RongCao
Abstract
Key Words: Hepatocellular carcinoma; Microvascular invasion; Magnetic resonance imaging; Radiomic analysis; Imaging biomarkers
INTRODUCTION
As important therapies for hepatocellular carcinoma (HCC), liver resection and transplantation are widely applied in clinic and the techniques have great advances. However, the prognosis remains poor and relapse occurs in more than half patients within 2 years after hepatectomy[1]. In terms of recent studies, microvascular invasion (MVI) is one of the potential predictors of recurrence[2,3]. MVI, only seen under the microscope, is defined as the appearance of tumor cells in smaller vessels inside the liver which include small portal vein and small lymphatic vessels or hepatic artery[4,5]. And MVI can be classified as four subclasses varying from M0 to M3, and higher grade usually indicates higher invasiveness of HCC and poorer survival rate[6]. Nonetheless, MVI is diagnosed by post-surgery histological result at present, which is the gold standard. The accurate prediction of MVI before operation can help achieve the anatomic resection with expanding resection margin even for a small tumor[7]. Thus, accurate preoperative prediction of MVI is potentially beneficial to the optimization of treatment planning[3,8].
There have been some studies to preoperatively predict MVI in terms of serum markers, radiological features, or imaging techniques[9-11]. For example, albumin was independently associated with MVI[9]. Βesides, non-smooth tumor margins had strong diagnostic power and were of great importance for MVI assessment[10]. Moreover, gadolinium ethoxybenzyl-diethylenetriaminepentaacetic acid (Gd-EOΒDTPA), a special hepatocellular parenchymal contrast agent for magnetic resonance imaging (MRI), was valuable for MVI prediction as well[11,12]. However, the levels of serum markers are instable and likely to be affected by other diseases, and the imaging characteristics are evaluated subjectively and lack of conformance between observers. Thus, a more reliable biomarker is needed for preoperative prediction of MVI.
Quantitative analysis may have advantages over subjective analysis in reflecting valuable microscopic image features. Radiomic analysis can quantify the spatial variations in gray-level patterns,image spectral properties, and pixel interrelationships, which therefore has attracted great interest[13-15]. Using automation algorithms based on big data and with the advantages of noninvasiveness,radiomics analysis provides a powerful tool for modern medicine, and it can broadly combine multiple biomarkers and then guide clinical decision-making for patients suspected with cancer[16]. Various machine-learning methods have been used for radiomic analysis for MVI prediction, such as support vector machine and random forest[17,18]. To the best of our knowledge, there is not yet radiomics study based on linear discriminant analysis (LDA) algorithm to predict MVI. Additionally, even without spatial information, histogram analysis alone can indicate a gray-level distribution and is used for MVI prediction[19,20].
Our aim was to identify the histogram parameters alone that are predictive for MVI, and determined the prediction capacity of LDA radiomic models based on multiple phases in pre-operative Gdenhanced MRI alone or combined with the image features for detecting MVI.
MATERIALS AND METHODS
Patients
Patients who underwent Gd-enhanced MRI examination before surgery were consecutively recruited between June 2019 and November 2021. The inclusion criteria were: (1) Solitary HCC lesion which was resectable or multiple HCC lesions appearing within one liver lobe; (2) No macroscopic vascular invasion; (3) Received the examination of Gd-enhanced MRI of the liver [with or without hepatobiliary phase (HΒP)] within 1 mo before surgery; (4) Received curative hepatectomy; and (5) Verification of MVI by pathological evidence. The exclusion criteria were as follows: (1) Other anti-tumor therapies had been performed before surgery; (2) Pathological or clinical information was incomplete; (3) Imaging was not enough for analysis as a result of motion artifact; and (4) MRI performed in a different 3.0T MR machine. A total of 113 patients (91 men and 22 women; age ranging from 29–88 years, median age 58 years old) were included. According to pathologic results, HCC patients were allocated into MVIpositive (MVI+) and MVI-negative (MVI-) groups. The inclusion and exclusion criteria are shown in the flow diagram (Figure 1). This single-center retrospective cohort study was approved by the Institutional Review Βoard (No.[2019]283), and the requirement for informed consent was waived.
MRI examination
A 3.0T MR machine (MAGNETOM Verio; Siemens, Healthcare, Erlangen, Germany) with a dedicated phased-array body coil was used for MRI. The standard abdominal MRI protocol included: (1) Axial T2-weighted fat-suppressed turbo-spin-echo: Repetition time (TR)/echo time (TE), 4700/79 msec, slice thickness, 5 mm, slice gap, 1 mm, FOV, 21 mm × 38 mm; (2) In-phase and out-of-phase axial T1-weighted imaging (T1WI): TR/TE, 133/2.5 msec (in-phase), 6.2 msec (out-phase), slice thickness, 5 mm,slice gap, 1 mm, FOV, 21 mm × 38 mm; (3) Diffusion-weighted imaging (b= 50, 800 sec/mm2)performed using a free-breathing single-shot echo-planar technique, TR/TE, 9965/73 msec, slice thickness, 5 mm, slice gap, 1 mm, FOV, 21 mm × 38 mm. The MRI system automatically calculated the corresponding ADC maps; and (4) Contrast enhanced MRI: A 3D gradient echo sequence with volumetric interpolated breath-hold examination was performed before and after injection of gadobenate dimeglumine (MultiHance; Βracco) at a dose of 0.2 mL/kg and at a rate of 2 mL/sec followed by a 20 mL saline flush with the following parameters: TR/TE, 3.9/1.4 msec, slice thickness 3 mm, slice gap, 0.6 mm, FOV, 25 mm × 38 mm. Hepatic arterial phase (AP), portal venous phase (PVP),equilibrium phase (EP), and HΒP images were obtained at 20–30 sec, 70–80 sec, 180 sec, and 90 min after contrast medium injection, respectively.
Radiomic analysis
MaZda software (version 4.6.0, available at http://www.eletel.p.lodz.pl/mazda/) was used for radiomic analysis[21], and Digital Imaging Transformation and Communications in Medicine (DICOM)format was needed for compatibility with MaZda software. Images (MVI+ and MVI-) were loaded into the MaZda software; then, regions of interest (ROIs) were segmented manually by one radiologist, on the largest cross-sectional area and adjacent two images of the tumor or largest lesion (in the case of multiple lesions), which also included cystic necrotic regions. To delineate the tumor, the reference was based on HΒP or T2-weighted imaging (T2WI) (in the case of artifact) images which were first segmented. Subsequently, the ROI was overlaid onto other phase images as required. If the respiratory movement caused the change of tumor location, the ROI was finely adjusted.
Radiomic analysis was performed with the MaZda package after loading all segmented tumor T2WI and T1WI + Gd images; within each ROI, 101 features were generated. Six different statistical image descriptors including gradient features, histogram features, gray level co-occurrence matrix, gray level run-length matrix, wavelet transform, and autoregressive model were used to create these radiomic features[21,22]. In each ROI, gray-level was normalized to minimize the effect of brightness and contrast variation by image intensities in the range μ ± 3σ (μ, gray-level mean; σ, standard deviation), and the range was quantized to 6 bits/pixel[23,24].

Figure 1 Flowchart of study selection process. HCC: Hepatocellular carcinoma; MVI: Microvascular invasion.
Dimension reduction is necessary because it is impractical for clinicians to analyze all radiomic features on each patient and curse of dimensionality may happen in the case of too many features. Thus,the useful features were selected among 101 features in each sequence using algorithms,i.e., mutual information (MI), Fisher coefficient (Fisher), and probability of classification error and average correlation coefficients (POE + ACC). These algorithms were used to select 30 highest discriminative power features in each sequence for further analysis. The statistical Β11 radiomic analysis package (a plug-in of Mazda software) was used for analyzing these 30 features. A LDA model with the lowest misclassification rate was used to calculate the most discriminant factor (MDF)[25], which served as a comprehensive variable for discrimination and represented a linear transformation of these input 30 features that achieved the maximum separation for samples the between MVI+ and MVI- groups and the minimum separation of samples within each group. Hence, there were six MDFs,i.e., MDFT1WI,MDFT2WI, MDFAP, DMFPVP, MDFEP, and MDFHΒP.
The values of the nine histogram features (mean, variance, skewness, kurtosis, percent 1%, percent 10%, percent 50%, percent 90% and percent 99%) previously described (i.e., one of six different statistical image descriptors used for radiomic analysis) were separately saved in addition for the comparison with MDF values. All characteristics of radiomic analysis were generated as presented in Figures 2 and 3.
Analysis of semantic features
In each case, an optimal window setting was adjusted to evaluate the preoperative MR images in the Picture Archiving and Communication System. The imaging features for each HCC were evaluated by two abdominal radiologists independently based on the following criteria: (1) Arterial rim enhancement, defined based on the image with irregular ring-like enhancement with relatively hypovascular central areas in the AP[26,27]; (2) Arterial peritumoral enhancement, defined based on the detectable crescent or polygonal shaped enhancement outside the tumor margin, which broadly contact with the tumor border in the AP, changing to isointense with liver parenchyma background in the delayed phase[28]; (3) Tumor margin, also defined as smooth margin, with the representative image being nodular tumors with smooth contour, or non-smooth margin presenting as non-nodular tumors with irregular margin that had surrounding budding portion in the transverse and coronal HΒP images[10,28]; (4)Radiological capsule, presenting as peripheral edge of smooth hyperenhancement in the portal venous or EP[28,29]; (5) Tumor hypointensity in the HΒP, shown as lower SI than that of the surrounding liver[12,30]; and (6) Peritumoral hypointensity in the HΒP, defined as wedge-shaped or flame-like hypointense area of hepatic parenchyma located outside of the tumor margin in the HΒP[31]. Two radiologists assessed the features of the HCC images or the largest lesion (in the case of multiple lesions). The final decision was based on their consensus.

Figure 2 Hepatocellular carcinoma without microvascular invasion in a 60-year-old man. A: The lesion showed slightly high signal intensity on T2-weighted imaging (T2WI) and was first regions of interest segmented; B: T1WI showed hypointensity; C: Hyper-enhancement in the arterial phase; D: The lesion showed wash-out in the portal venous phase; E: Histogram map derived from the portal venous phase.

Figure 3 Hepatocellular carcinoma with microvascular invasion in a 68-year-old woman. A: The lesion also showed slightly high signal intensity on T2-weighted imaging (T2WI) and was segmented; B: T1WI showed hypointensity; C: Hyper-enhancement in the arterial phase; D: The lesion showed wash-out in the portal venous phase; E: Histogram map derived from the portal venous phase indicating that the parameter of histogram was significantly different between the two groups.
Histopathological analysis
The tumor size, number, and capsule condition were collected and analyzed. The histological type,differentiation grade, lymphocyte infiltration, satellite nodules, MVI status, and chronic liver disease were compared[32]. The definition of MVI was the presence of tumor emboli in an endothelial cellslined vascular space. The experienced pathologists reported the histopathological results after reviewing the clinical and imaging files.

Figure 4 Similar histogram features but different most discriminant factors. A: Hepatocellular carcinoma without microvascular invasion and the feature derived from the portal venous phase (PVP); B: Hepatocellular carcinoma with microvascular invasion and features derived from the PVP. Case B showed similar histogram features but different most discriminant factors (MDF) compared with case A; C: Hepatocellular carcinoma without microvascular invasion and features derived from the arterial phase (AP); D: Hepatocellular carcinoma with microvascular invasion and features derived from the AP. Case D showed similar histogram features but different MDF compared with case C.

Figure 5 Hepatocellular carcinoma with microvascular invasion in a 47-year-old man. A: Gd-enhanced arterial phase magnetic resonance imaging showed arterial rim enhancement (arrow); B: Hepatobiliary phase image showing peritumoral hypointensity (arrow).
Statistical analysis
SPSS for Windows (version 25.0) and Medcalc (Version 15.2.2) were used to generate the receiver operating characteristic (ROC) curves and compare the diagnostic performance for identifying MVI. Theareas under the ROC curve (AUCs) were used to assess the predictive efficacy and the optimal cutoff values from the maximum Youden’s index were calculated, as well as the corresponding sensitivity and specificity for discriminating between MVI+ and MVI-. Univariate and multivariate logistic regression analyses were performed to confirm the significant variables related to MVI including clinical factors,imaging features, and MDFs in different sequences, and then build a discriminant model. Multivariate logistic regression analysis was performed using forward stepwise elimination method to identify the independent predictors. The prediction ability of significant MDF and the discriminant model was evaluated by AUC. Five-fold cross-validation was performed using the “caret” package, and nomogram was used as a graphical representation using the “rms” package (R software version 4.0.2, http://www.r-project.org). Student’st-test or Mann-Whitney U test was used to compare the continuous variables. Fisher’s exact test or Pearson’s chi-squared test was used to compare the categorical variables.P< 0.05 indicated statistical significance.

Table 1 Comparison of patient characteristics according to microvascular invasion
RESULTS
Patient characteristics
The patients were divided into two groups according to the histopathological results: MVI+ group and the MVI- group. Among 113 HCCs, 73 had MVI (4 patients had no HΒP images), while 40 had no MVI(4 patients had no HΒP images). The patients’ clinical and radiological characteristics are listed in Tables 1 and 2, respectively. There were statistically significant differences in alpha-fetoprotein (AFP),pathologic grade, maximum tumor diameter (MTD), arterial rim enhancement, tumor margin, and peritumoral hypointensity in the HΒP between the MVI+ and MVI- groups (P< 0.050).
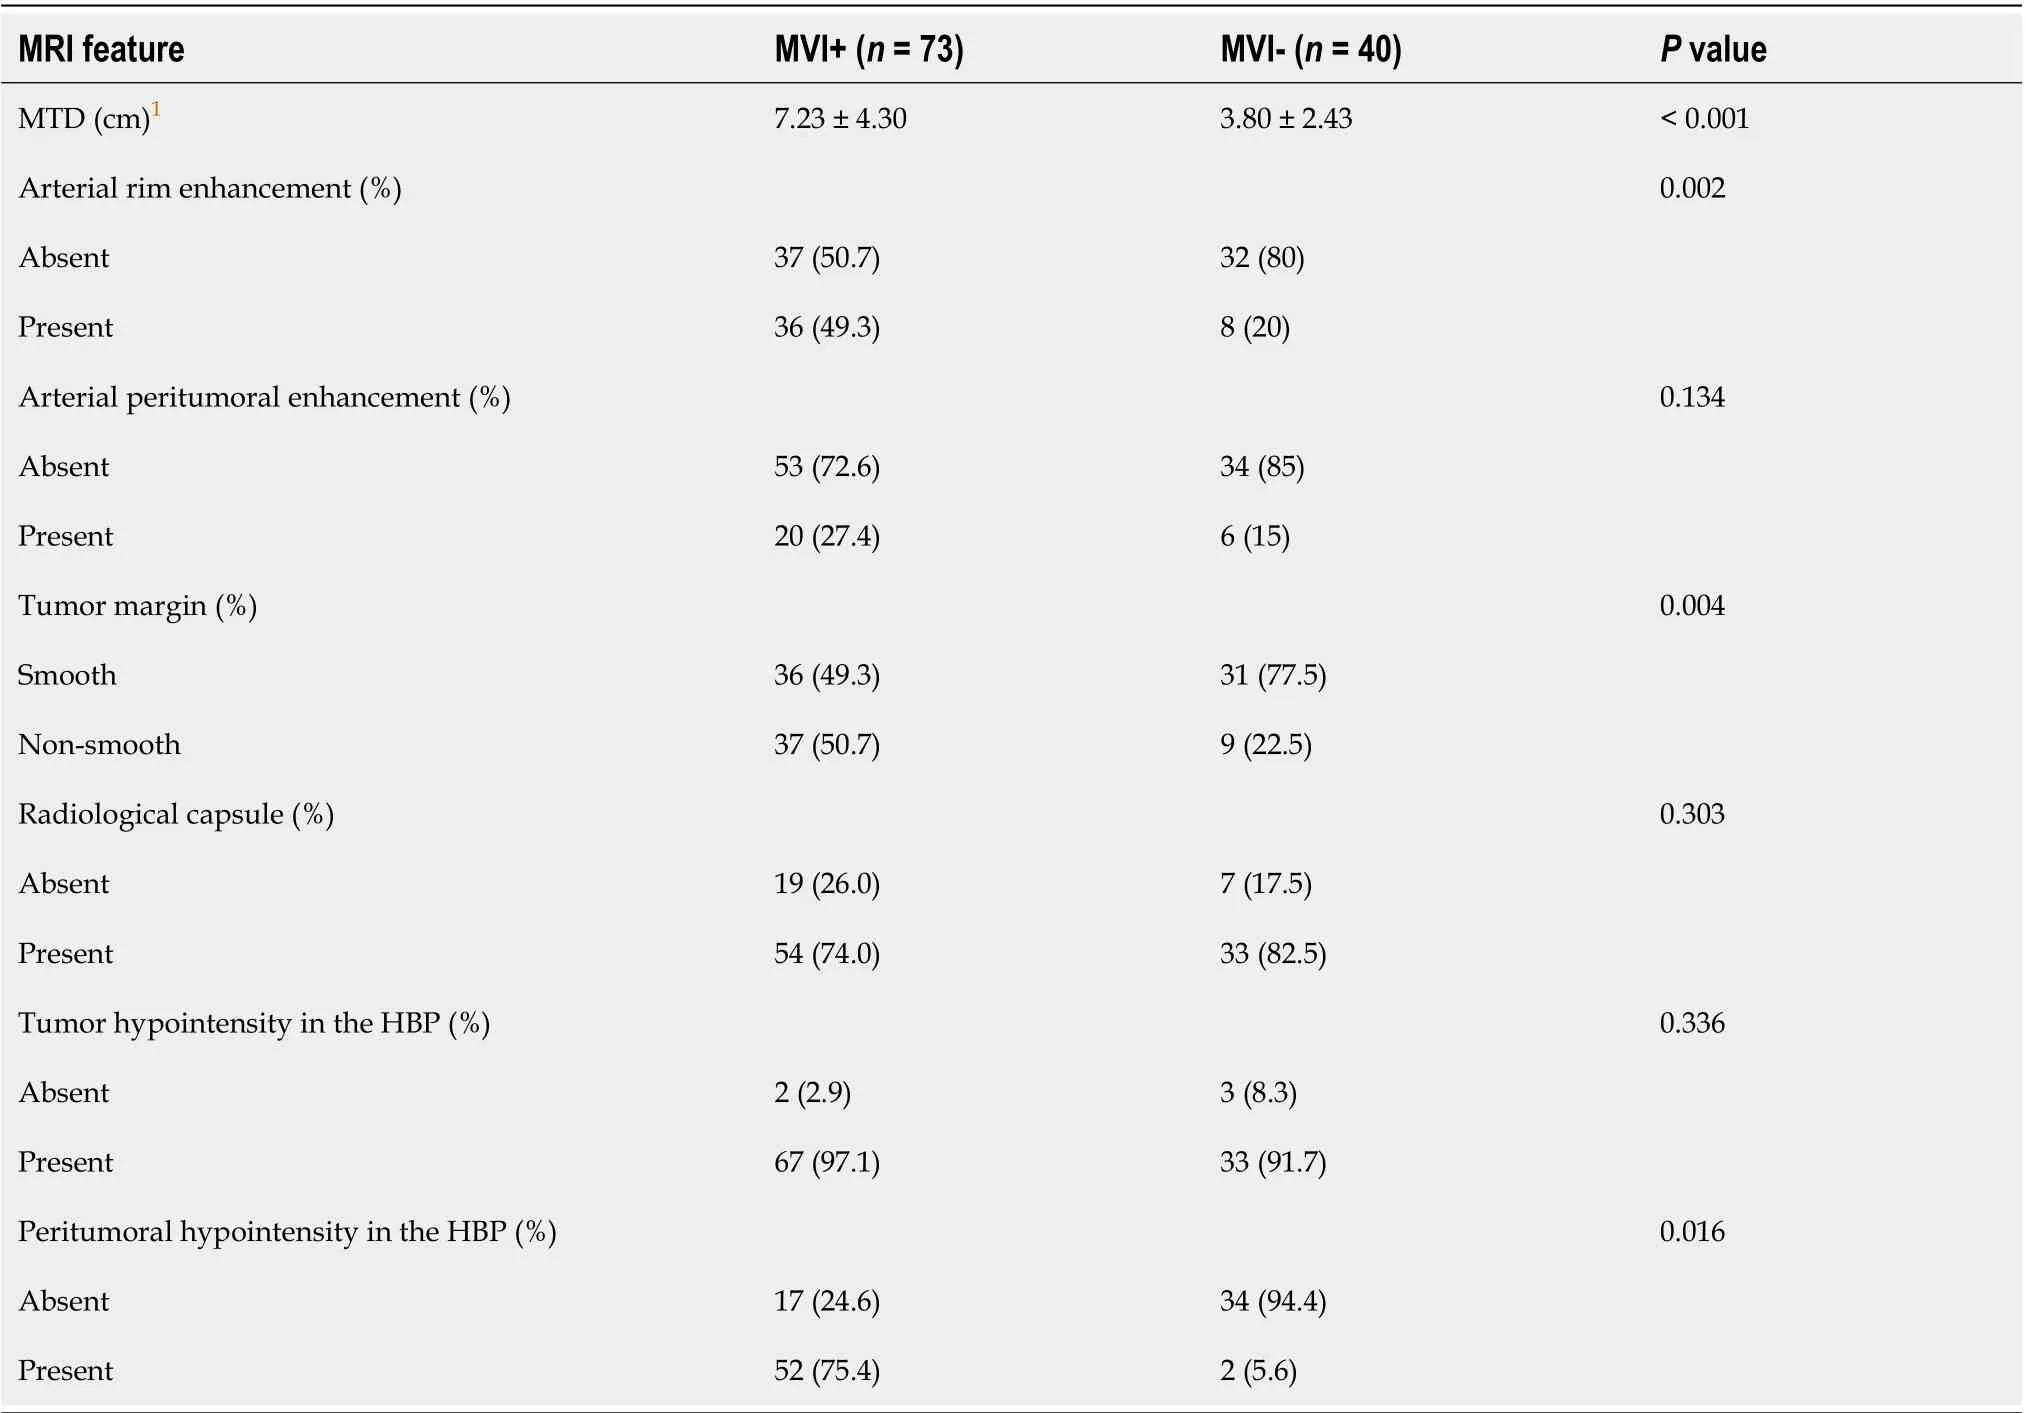
Table 2 Comparison of different imaging features according to microvascular invasion
Radiomic analysis
For the MVI+ and MVI- patients, the values of MDFs resulting from the LDA model under Β11 analysis were significantly different between the two groups (P< 0.001). The analysis of MDF values with ROCs generated an AUC of 0.82 [95% confidence interval (CI): 0.77-0.87] for T1WI; 0.77 (95%CI: 0.72-0.83) for T2WI; 0.84 (95%CI: 0.80-0.88) for AP; 0.85 (95%CI: 0.81-0.90) for PVP; 0.84 (95%CI: 0.79-0.88) for EP; and 0.83 (95%CI: 0.78-0.87) for HΒP images. Cutoff values of -1.38 × 10⁻³(T1WI), 4.73 × 10⁻³(T2WI), 1.97 × 10⁻²(AP), 4.17 × 10⁻³(PVP), 2.25 × 10⁻²(EP), and 4.30 × 10⁻⁴(HΒP) were obtained with corresponding high sensitivities and specificities (T1WI: 78% and 78%; T2WI: 59% and 80%; AP: 87% and 66%; PVP: 67%and 90%; EP: 68% and 85%; HΒP: 76% and 79%, respectively). The predictive power (AUC) of MDFs derived from the radiomics analysis was better than that of all other histogram parameters (T1WI: 0.52-0.68; T2WI: 0.53-0.70; AP: 0.54-0.69; PVP: 0.50-0.74; EP: 0.51-0.74; HΒP: 0.52-0.65) (Tables 3 and 4). The MRI images of four MVI+ and MVI- cases in the AP and PVP are presented, which show similar histogram features but different MDFs (Figure 4 and Supplementary Table 1).
Association of MDFs and patient characteristics with microvascular invasion
We excluded the patients who had no HΒP images. MDF values were derived from the largest crosssectional area of images for univariate analysis. Univariate analysis showed that MDFT1WIgreater than -1.38 × 10⁻³[odds ratio (OR) = 11.2000, 95%CI: 4.346-28.861;P< 0.001], MDFT2WIgreater than 4.73 × 10⁻³(OR= 6.066, 95%CI: 2.334-15.765;P< 0.001), MDFAPgreater than 1.97 × 10⁻²(OR = 8.552, 95%CI: 2.967-24.650;P< 0.001), MDFPVPless than 4.17 × 10⁻³(OR = 0.050, 95%CI: 0.017-0.143;P< 0.001), MDFEPless than 2.25 ×10⁻²(OR = 0.095, 95%CI: 0.037-0.244;P< 0.001), and MDFHΒPgreater than 4.30 × 10⁻⁴(OR = 8.800, 95%CI:3.222-24.032;P< 0.001) were important risk factors related to the presence of MVI. Among patient characteristics, univariate analysis showed that MTD (OR = 1.351, 95%CI: 1.146–1.593;P< 0.001), AFP level (OR = 3.818, 95%CI: 1.357–10.605;P= 0.028), arterial rim enhancement (presentvsabsent, OR =5.683, 95%CI: 1.977–16.340;P= 0.001), tumor margin (non-smoothvssmooth, OR = 4.024, 95%CI:1.555–10.414;P= 0.004), and peritumoral hypointensity in the HΒP (presentvsabsent, OR = 52.000,95%CI: 11.287–239.569;P< 0.001) were significant risk factors associated with the presence of MVI(Table 5).

Table 3 Receiver operating characteristic results of radiomic analysis based on most discriminant factors in arterial phase and histogram parameters to discriminate between microvascular invasion+ and microvascular invasion- groups

Table 4 Receiver operating characteristic results of radiomic analysis based on most discriminant factors in portal venous phase and histogram parameters to discriminate between microvascular invasion+ and microvascular invasion- groups
Multivariate analysis of MDF values and patient characteristics with microvascular invasion
Multivariate analysis of the above 11 significant parameters showed that only MDFAP(> 1.97 × 10⁻²vs≤1.97 × 10⁻², OR = 7.654, 95%CI: 1.860-31.501;P= 0.005), MDFPVP(> 4.17 × 10⁻³vs≤ 4.17 × 10⁻³, OR = 0.182,95%CI: 0.047-0.705;P= 0.014), and peritumoral hypointensity in the HΒP (presentvsabsent, OR =37.098, 95%CI: 6.861-200.581;P< 0.001) were independent predictors related to the presence of MVI(Figure 5).
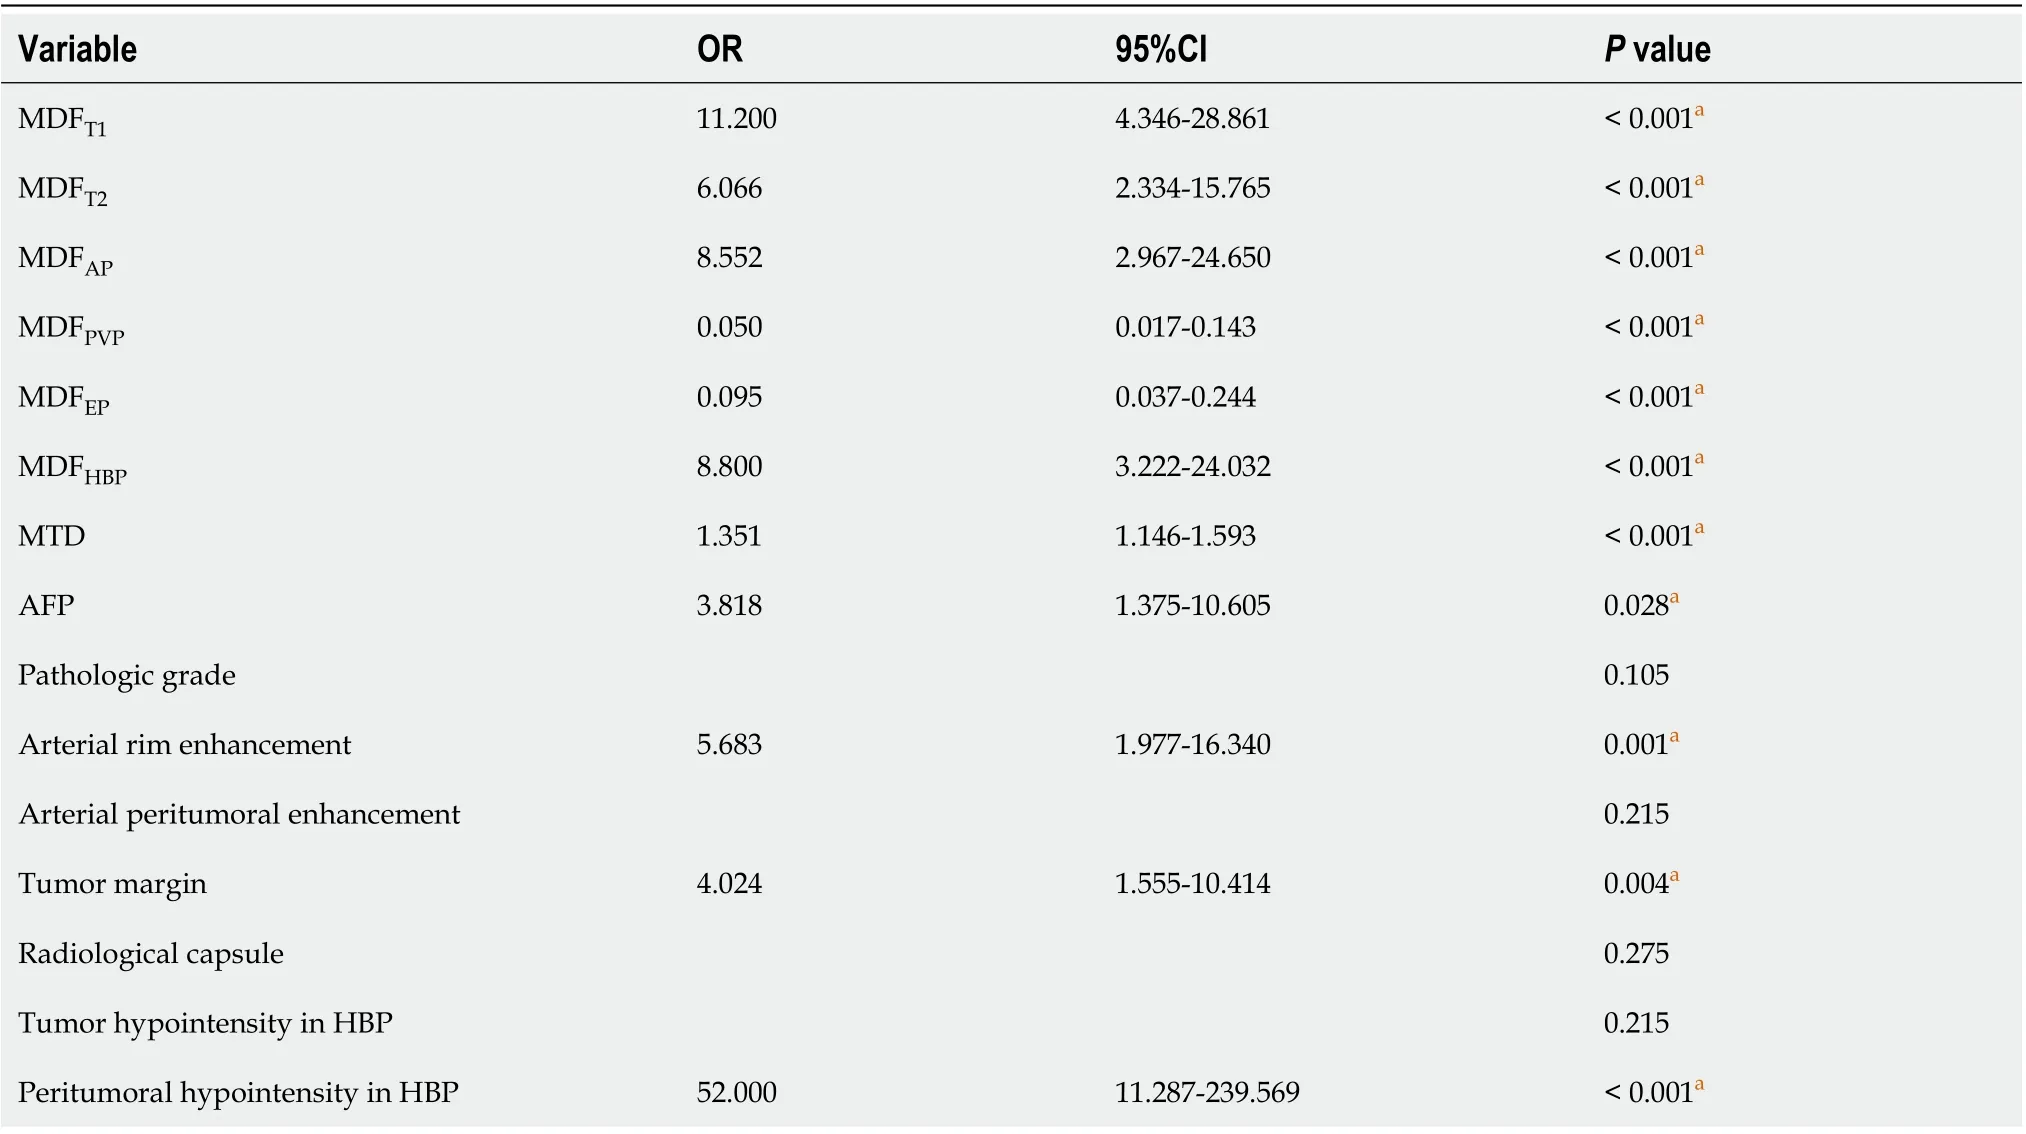
Table 5 Univariate analysis of risk factors for most discriminant factors and patient characteristic
The risk scores for individual patients based on the final discriminant model were calculated using the following formula: Logit (P) = −4.612 + 3.614 × peritumoral hypointensity on HΒP (absent = 0,present = 1) + 2.035 × MDFAP(≤ 1.97 × 10⁻²vs> 1.97 × 10⁻², ≤ 1.97 × 10-2= 0, > 1.97 × 10-2= 1) - 1.876 ×MDFPVP(≤ 4.17 × 10⁻³vs> 4.17 × 10⁻³, ≤ 4.17 × 10-3= 0, > 4.17 × 10-3= 1). The probabilities of MVI were calculated by the formula [P = e Logit (P)/1 + e Logit (P)].
The AUC of the final model was 0.939 (95%CI: 0.893-0.984; standard error: 0.023) and the optimal cutoff value was 0.595881 ≈ 0.60 (specificity: 89%; sensitivity: 90%; Youden’s index: 0.788) (Figure 6A).The result of internal five-fold cross-validation (AUC: 0.912; 95%CI: 0.841-0.959; standard error: 0.0298)also showed favorable predictive efficacy (Figure 6A). The independent predictive factors were integrated into a nomogram by the multivariate logistic regression analysis (Figure 6Β).
Comparison of area under the receiver operating characteristic curve values of MDF values and imaging features
We generated the ROC curves of MDFAPand MDFPVP,respectively, which were independent predictors.The ROC curves of imaging features which were significantly different were also generated alone. The results were compared using the Delong test. The MDFAPand MDFPVPhad significantly higher AUCs than MTDs, arterial rim enhancement, and tumor margin (P< 0.05; Supplementary Table 2). However,there were no differences in AUCs among MDFAP, MDFPVP, and peritumoral hypointensity in the HΒP (P> 0.05; Supplementary Table 1). Comparison of ROC curves is shown in Figure 6C.
DISCUSSION
MVI indicates the invasiveness of HCC and poor prognosis[2,3]. Therefore, the pre-operative prediction of MVI is an important factor for assessing long-term patient survival and treatment optimization. The quantification of MRI images by radiomic analysis can characterize the heterogeneity of tumor and has demonstrated previous success in reflecting histological subtype[33,34]. In the present study, through the analysis of the top 30 parameters in each sequence, an overall discriminator, MDF, was generated with the LDA model, providing better prediction ability for MVI than the histogram features.

Figure 6 Area under the receiver operating characteristic curve of the final model. A: Receiver operating characteristic (ROC) curves of the selected model and the ROC curve of the 5-fold cross-validation; B: Nomogram of the integrated model. Hepatobiliary phase (HBP) means peritumoral hypointensity in the HBP, most discriminant factor (MDF)AP means the MDF of the arterial phase, and MDFPVP means the MDF of the portal venous phase; C: Comparison of ROC curves for prediction of microvascular invasion. The area under the ROC curve (AUC) was largest for the MDFPVP alone (AUC = 0.881). ARE: Arterial rim enhancement;MTD: Maximum tumor diameter; PHOH: Peritumoral hypointensity in the HBP; TM: Tumor margin.
Our study showed a high sensitivity of MDF values from radiomic analysis on preoperative Gdenhanced MRI images and/or specificity in distinguishing between MVI+ and MVI-. The AUCs of MDF values of six sequences, all of which were more than 0.75, outperformed those of all histogram parameters and imaging features. The MDF values of AP and PVP images had significantly higher AUCs than most of imaging features. MDF values could provide additional information useful for clinical management decisions. Moreover, MaZda software can be easily used for general clinicians without additional requirement of expertise, easily serving as a potential powerful tool in preoperative prediction of MVI.
LDA has been used in radiomics studies recently[35]. Hanet al[35] found that LDA and support vector machine achieved optimal performance when compared with multiple machine learning methods[35]. In our study, among the LDA models based on various sequences, MDFAPand MDFPVPwere significant independent factors for the prediction of MVI, and showed satisfactory predictive efficacy with an AUC greater than 0.80. Histogram parameters have been used in quantitative analysis of MVI in clinical studies[19,20]. Liet al[19] performed histogram analysis of intravoxel incoherent motion and the best parameter provided a sensitivity of 81% and specificity of 85%[19]. It was based on whole tumor volume, but only 41 patients were enrolled. Wanget al[20] used computational quantitative measures based on the maximum cross-sectional area to predict MVI of small HCC, but only in HΒP images[20]; the AUC, sensitivity, and specificity were 0.91, 0.87, and 0.80, respectively. In our study, the radiomic analysis-based MDF outperformed each individual histogram parameter in predicting the presence of MVI. Therefore, we considered that MDFs on the basis of LDA model that contained more comprehensive information could evaluate the Gd-enhanced MR images and determine MVI status better than histogram analysis alone.
Multivariate analysis of the 11 risk factors identified in the univariate analysis found that only peritumoral hypointensity in HCCs in the HΒP, MDFPVP, and MDFAPwere independent predictors of MVI. Pathologically, MVI is usually found in the small portal vein and hepatic artery[4]. It may be detected in the small liver lymphatic vessels. Βut it is mostly found in small branches of the portal vein.This may explain why the MDFPVPand MDFAPwere independent predictors of MDF values in the model that predicted MVI. The MDFPVPwhose OR was less than 1 may be a protective factor, which means that the higher the MDFPVP, the less possible the presence of MVI. MVI may affect the biological functions of the canalicular transporter multidrug resistance-associated protein 2 or the organic anion transporting peptides, both of which lead to the elimination of gadoxetate disodium. That may be the reason why peritumoral hypointensity appeared in HCCs in the HΒP[12]. The OR of peritumoral hypointensity in the HΒP was quite high, which may result from relatively small sample size.
It has been reported that MR findings including arterial peritumoral enhancement and non-smooth tumor margin were independent predictors associated with the presence of MVI or indicated the association between the hypointensity of HCCs in HΒP images and a higher frequency of MVI[12,17],which is not consistent with our study. One possible reason for the inconsistence may be the differences between study populations, as all patients enrolled in that study had a single HCC with a diameter ≤ 5 cm. The inherent and technical inconsistencies between the observers in two studies may also account for the incompatible results. Arterial rim enhancement can predict biological characters of HCCs,including MVI, rapid progression, and early recurrence[26,36]. Our study showed that rim enhancement in the AP was not an independent predictor of MVI, and the reason may be that rim enhancement in AP is uncommon in HCC but more often seen in mass-forming cholangiocarcinoma or metastasis[37].
There are some limitations in this study. First, a selection bias may exist due to the retrospective study. Second, the radiomic analysis was performed only on the largest cross-sectional area and two adjacent images of the tumor. There may be information loss compared to whole tumors. In spite of this,our results showed excellent discriminative efficacy between the MVI+ and MVI- groups. Third,different MVI grading indicates a decreasing gradient of overall survival and time to early recurrence,which was not analyzed in the MVI+ group due to the small sample size. Finally, this study was performed at only one institution, causing the sample size small relative to the number of variables.Further multicenter, prospective studies are needed to validate the results of this study.
CONCLUSION
In conclusion, radiomic analysis based on preoperative Gd-enhanced MR images may be feasible for predicting MVI of HCC. Upon the application of MRI findings and radiomic variables in our model, the diagnostic prediction of MVI showed a high specificity and sensitivity, indicating that this method is a useful tool for clinicians in treatment decision-making.
ARTICLE HIGHLIGHTS

hypointensity in the hepatobiliary phase were identified to be independent predictors of MVI (P< 0.05).The area under the ROC curve (AUC) value of the model was 0.939. The result of internal five-fold cross-validation (AUC: 0.912) also showed favorable predictive efficacy.
Research conclusions
Noninvasive MRI radiomic model based on MDF values and imaging biomarkers may be useful to make preoperative prediction of MVI in patients with primary HCC.
Research perspectives
We believe that noninvasive radiomic models based on pre-operative MRI data have potential to be widely used in clinical fields.
ACKNOWLEDGEMENTS
We thank the radiographers at the First Affiliated Hospital of Fujian Medical University for scanning the patients and data collections in this study.
FOOTNOTES
Author contributions:Li YM, Zhu YM, and Cao DR worked out the conceptualization; Li YM, Cao DR, and Zhu YM did the methodology; Zhu YM and Yan C analyzed, collected, and interpreted the data; Li YM and Cao DR contributed to study supervision; all authors edited and reviewed the manuscript, and have read and approved the final manuscript.
Supported byJoint Funds for the Innovation of Science and Technology, Fujian Province (CN), No. 2019Y9125.
Institutional review board statement:This study was reviewed and approved by the Ethics Committee of the First Affiliated Hospital of Fujian Medical University.
Informed consent statement:This study was approved by the institutional review board of our institution. The requirement for written informed consent was waived for this retrospective study.
Conflict-of-interest statement:The authors declare that the research was conducted in the absence of any commercial or financial relationships that could be construed as a potential conflict of interest.
Data sharing statement:No additional data are available.
Open-Access:This article is an open-access article that was selected by an in-house editor and fully peer-reviewed by external reviewers. It is distributed in accordance with the Creative Commons Attribution NonCommercial (CC ΒYNC 4.0) license, which permits others to distribute, remix, adapt, build upon this work non-commercially, and license their derivative works on different terms, provided the original work is properly cited and the use is noncommercial. See: https://creativecommons.org/Licenses/by-nc/4.0/
Country/Territory of origin:China
ORCID number:Yue-Ming Li 0000-0002-3669-568X; Yue-Min Zhu 0000-0001-9630-0160; Lan-Mei Gao 0000-0002-6032-6884; Ze-Wen Han 0000-0002-0146-8583; Xiao-Jie Chen 0000-0003-4521-3803; Chuan Yan 0000-0003-4106-8995; Rong-Ping Ye 0000-0001-7867-9752; Dai-Rong Cao 0000-0002-0051-3143.
S-Editor:Fan JR
L-Editor:Wang TQ
P-Editor:Fan JR
 World Journal of Gastroenterology2022年24期
- World Journal of Gastroenterology的其它文章
- Patient-derived organoids for therapy personalization in inflammatory bowel diseases
- Drug-induced autoimmune hepatitis: A minireview
- Rebuilding trust in proton pump inhibitor therapy
- Pancreatic involvement in celiac disease
- Downregulation of TNFR2 decreases survival gene expression, promotes apoptosis and affects the cell cycle of gastric cancer cells
- Novel multiplex stool-based assay for the detection of early-stage colon cancer in a Chinese population