The Alzheimer’s disease-associated gene TREML2 modulates inflammation by regulating microglia polarization and NLRP3 inflammasome activation
Si-Yu Wang , Xin-Xin Fu , Rui Duan Bin Wei Hai-Ming Cao Yan E Shuai-Yu Chen Ying-Dong Zhang , Teng Jiang
Abstract Triggering receptor expressed on myeloid cells-like 2 (TREML2) is a newly identified susceptibility gene for Alzheimer’s disease (AD). It encodes a microglial inflammation-associated receptor. To date, the potential role of microglial TREML2 in neuroinflammation in the context of AD remains unclear. In this study, APP/PS1 mice were used to investigate the dynamic changes of TREML2 levels in brain during AD progression. In addition, lipopolysaccharide (LPS) stimulation of primary microglia as well as a lentivirus-mediated TREML2 overexpression and knockdown were employed to explore the role of TREML2 in neuroinflammation in the context of AD. Our results show that TREML2 levels gradually increased in the brains of APP/PS1 mice during disease progression. LPS stimulation of primary microglia led to the release of inflammatory cytokines including interleukin-1β, interleukin-6, and tumor necrosis factor-α in the culture medium. The LPS-induced microglial release of inflammatory cytokines was enhanced by TREML2 overexpression and was attenuated by TREML2 knockdown. LPS increased the levels of microglial M1-type polarization marker inducible nitric oxide synthase. This effect was enhanced by TREML2 overexpression and ameliorated by TREML2 knockdown. Furthermore, the levels of microglial M2-type polarization markers CD206 and ARG1 in the primary microglia were reduced by TREML2 overexpression and elevated by TREML2 knockdown. LPS stimulation increased the levels of NLRP3 in primary microglia. The LPS-induced increase in NLRP3 was further elevated by TREML2 overexpression and alleviated by TREML2 knockdown. In summary, this study provides the first evidence that TREML2 modulates inflammation by regulating microglial polarization and NLRP3 inflammasome activation. These findings reveal the mechanisms by which TREML2 regulates microglial inflammation and suggest that TREML2 inhibition may represent a novel therapeutic strategy for AD.
Key Words: Alzheimer’s disease; APP/PS1 mice; inflammatory cytokine; lipopolysaccharide; microglia; neuroinflammation; NLRP3 inflammasome; polarization; susceptibility gene; TREML2
Introduction 434 Methods 434 Results 435 Discussion 437
Graphical Abstract
TREML2 regulates inflammatory cytokine release via regulation of microglia polarization and NLRP3 inflammasome activation

Introduction
Alzheimer’s disease (AD) is the most common cause of dementia in elderly individuals (Jiang et al., 2013). It is a complex neurodegenerative disease characterized by progressive disruption of cognitive function (Lane et al., 2018). To date, the etiology and pathogenesis of this disease remain unclear. Several lines of evidence suggest that neuroinflammation participates in the pathogenesis of AD (Hensley, 2010). This notion is supported by genetic evidence that functional variants in numerous inflammation-associated genes significantly confer susceptibility to AD (Yu et al., 2011, 2012; Gonzalez Murcia et al., 2013).
The novel inflammation-associated gene triggering receptor expressed on myeloid cells like 2 (TREML2
) is closely associated with the risk of AD (Wang et al., 2020a). Previously, Benitez et al. (2014) revealed that rs3747742-C, a coding missense variant located in exon 3 ofTREML2
, significantly reduces the risk for AD in Caucasians. This protection against AD risk was further confirmed by our group in a Han Chinese cohort including 992 AD patients and 1358 healthy controls (Jiang et al., 2017). HumanTREML2
encodes a 321-aa transmembrane inflammation-associated receptor (Cheng et al., 2016; Wang et al., 2020a). In the brain, TREML2 is mainly expressed by microglia, the resident immune cells of the central nervous system, and gradually increases during the progression of AD (Sierksma et al., 2020). Furthermore, the expression of TREML2 was also elevated in primary microglia after lipopolysaccharide (LPS) stimulation (Zheng et al., 2016), suggesting that it was implicated in microglia-mediated inflammation. However, the underlying regulatory mechanisms remain unclear. Given that microglia-mediated inflammation contributed to the etiology of AD (Leng and Edison, 2021), in this study we performed LPS stimulation of primary microglia as well as lentivirus-mediated overexpression and knockdown, to investigate the potential role of microglial TREML2 in neuroinflammation in the context of AD.Methods
Animals
To avoid the impact of estrogen on microglia-mediated neuroinflammation in AD (Villa et al., 2016), only male mice were used in this study. Four-, seven-, and ten-month old male APP/PS1 transgenic mice (24–30 g) on a C57BL/6J background (a transgenic animal model of AD) and age-matched wild-type (WT) mice (n
= 5 for each age and genetic background) were obtained from Beijing Huafukang Bioscience Company (license No. SCXK (Jing) 2021-0010). The APP/PS1 mice (B6.Cg-Tg(APPswe,PSEN1dE9)85Dbo/Mmjax, MGI ID: 3611279, RRID: MMRRC_034832-JAX) were housed one per cage. Mice were raised in a regulated, SPF environment (23 ± 1°C, 60 ± 5% humidity) with a 12-hour light-dark cycle, as described previously (Duan et al., 2021). This study was approved by the Animal Care and Use Committee of Nanjing Medical University (approval No. IACUC-2004046) on April 29, 2020. All animal experiments are reported in accordance with ARRIVE guidelines (Percie du Sert et al., 2020).Primary microglia isolation, lentivirus-mediated manipulation, and LPS stimulation
Microglia were isolated on postnatal day 1 from the brains of WT mice purchased from Changzhou Cavens Lab Animal Co. Ltd. (license No. SCXK (Su) 2021-0013), as described previously (Jiang et al., 2018). The purity of the isolated microglia was determined by immunostaining with the primary antibody rabbit monoclonal antibody against the microglia-specific marker IBA-1 (1:100, Abcam, Boston, MA, USA, Cat# ab178847, RRID: AB_2832244) at 4°C for 12 hours and the secondary antibody goat anti-rabbit IgG H&L (Alexa Fluor® 488) antibody (1:200, Abcam, Cat# ab150077, RRID: AB_2630356) at room temperature for 2 hours. MouseTREML2
lentiviral overexpression particles (Santa Cruz Biotechnology, Santa Cruz, CA, USA, Cat# sc-435918-LAC), mouseTREML2
shRNA lentiviral knockdown particles (Santa Cruz Biotechnology, Cat# sc-154630-V), and control lentiviral particles (control for lentiviral overexpression particles: Santa Cruz Biotechnology, Cat# sc-437282; control for lentiviral knockdown particles Biotechnology Santa Cruz, Biotechnology, Cat# sc-108080) were obtained from Santa Cruz, and lentiviral transduction was performed as described previously (Jiang et al., 2018). Finally, DAPI staining of the cell nuclei was carried out at room temperature for 5 minutes (SouthernBiotech, Birmingham, AL, USA, Cat# 0100-20). Fluorescence images were obtained using a BK-FL fluorescent microscope (Chongqing Optec Instrument Company, Chongqing, China). LPS stimulation is widely used to model neuroinflammation in the context of AD context (Zakaria et al., 2017; Batista et al., 2019). Therefore, the microglia were stimulated with LPS (10 ng/mL, 100 ng/mL, and 1000 ng/mL) diluted in DMEM/F12 medium (Thermo Fisher Scientific, Waltham, MA, USA, Cat# A4192001) at 37°C for 24 hours. The alterations in microglial TREML2 protein levels were evaluated by western blot analysis.Cell viability assays
Cell viability was analyzed by cell counting kit (CCK)-8 assay (Dojindo, Kumamoto, Japan, Cat# CK04). Briefly, primary microglia were seeded in a 96-well plate at a density of 1 × 10cells per well. After the microglia were treated with LPS or PBS for 24 hours, 10 µL of CCK-8 dye was added to each well, and the plates were incubated for another 2 hours at 37°C. Cell viability was evaluated according to the manufacturer’s instructions.
Western blot analysis
APP/PS1 transgenic mice (4-, 7-, and 10-month-old) and their age-matched WT controls were sacrificed by cervical dislocation after inhalation anesthesia with an overdose of isoflurane (5% in oxygen, MilliporeSigma, Burlington, MA, USA, Cat# 26675-46-7). Total protein was obtained from whole brains or cultured primary microglia. Equal amounts of protein were separated on sodium dodecyl sulfate polyacrylamide gels and transferred to polyvinylidene fluoride membranes, which were blocked with 5% non-fat milk, as described previously (Jiang et al., 2018). Membranes were incubated at 4°C overnight with a mouse monoclonal antibody against TREML2 (a transmembrane inflammation-associated receptor expressed by microglia; 1:500, Santa Cruz Biotechnology, Cat# sc-390343, RRID: AB_2895714), a rabbit monoclonal antibody against NLRP3 (a main component of the NLRP3 inflammasome; 1:1000, Cell Signaling Technology, Cat# 15101, RRID: AB_2722591), a rabbit monoclonal antibody against iNOS (a microglial M1-type polarization marker; 1:1000, Abcam, Cat# ab178945, RRID: AB_2861417), a rabbit monoclonal antibody against CD206 (a microglial M2-type polarization marker; 1:1000, Abcam, Cat# ab125028, RRID: AB_10973022), a rabbit polyclonal antibody against ARG1 (a microglial M2-type polarization marker; 1:1000, Abcam, Cat# ab91279, RRID: AB_10674215), or a rabbit monoclonal antibody against β-actin (1:1000, Cell Signaling Technology, Boston, MA, USA, Cat# 4970, RRID: AB_2223172), then washed and incubated with a polyclonal anti-rabbit (1:5000, Cell Signaling Technology, Cat# 7074, RRID: AB_2099233) or antimouse (1:5000, Cell Signaling Technology, Cat# 7076, RRID: AB_330924) horseradish peroxidase-coupled secondary antibody at room temperature for 2 hours. The protein bands were detected by chemiluminescence (BioRad, Hercules, CA, USA), and their optical density was analyzed using Quantity One software (BioRad). Relative protein expression was normalized to β-actin.
Enzyme linked immunosorbent assay
To investigate the potential regulatory effect of TREML2 on microglial release of inflammatory cytokines, primary microglia culture medium was collected and then centrifuged at 1000 ×g
and 4°C for 15 minutes to remove cellular debris. The levels of the inflammatory cytokines IL-1β (Abcam, Cat# ab197742), IL-6 (Abcam, Cat# ab222503), and TNF-α (Abcam, Cat# ab208348) were detected by specific enzyme-linked immunosorbent assay (ELISA) kits according to the manufacturer’s protocol.Statistical analysis
The statistical analyses were carried out using GraphPad Prism 7.00 (GraphPad Software, Inc., CA, USA). Student’st
-test was employed for comparisons between two groups. One-way analysis of variance followed by Tukey’spost hoc
test was employed to analyze differences among three or more groups. Data are expressed as the mean ± SD.P
< 0.05 was considered statistically significant.Results
TREML2 is upregulated in the brain during AD progression
To identify dynamic alterations in brain TREML2 levels during AD progression, we detected TREML2 levels in the brains of 4-, 7-, and 10-month-old APP/PS1 mice as well as age-matched WT control mice, by western blot assay. As shown inFigure 1A
andB
, brain TREML2 levels increased with age in APP/PS1 mice but not in WT mice. TREML2 levels were significantly higher in the brains of APP/PS1 mice than in those of the WT controls at 7 months (P
< 0.05) and 10 months (P
< 0.05).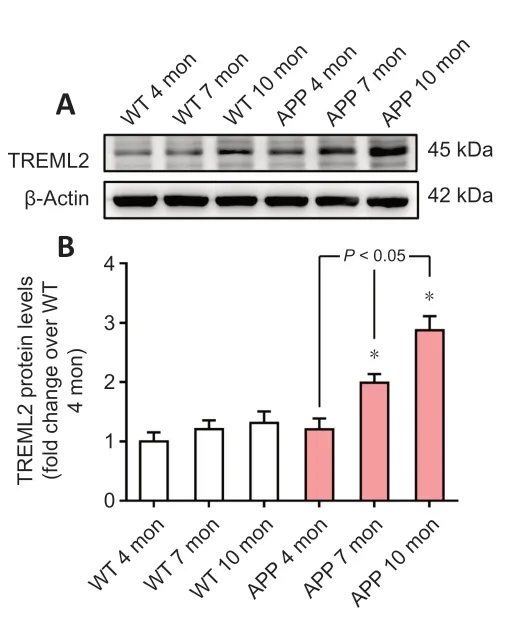
Figure 1|TREML2 is upregulated in the brain during AD progression. (A) TREML2 levels in the brain of 4-, 7-, and 10-month (mon)-old APP/PS1 mice and age-matched WT mice, as determined by western blot. (B) Quantitative analysis of TREML2 levels. Data were normalized to β-actin, and were analyzed by one-way analysis of variance followed by Tukey’s post hoc test. Columns represent mean ± SD. n = 5 per group. All experiments were performed in duplicate. *P < 0.05, vs. age-matched WT mice. AD: Alzheimer’s disease; APP: APP/PS1 transgenic mice; TREML2: triggering receptor expressed on myeloid cells like 2 gene; WT: wild-type.
Microglial TREML2 levels are increased under inflammatory conditions
Microglia-mediated inflammation contributes to the pathogenesis of AD (Leng and Edison, 2021). Previous studies have shown that TREML2 is mainly expressed by microglia (Benitez et al., 2014; Zheng et al., 2016). Therefore, we investigated the role of TREML2 in neuroinflammation using primary microglia. As shown inFigure 2A
, the population of primary microglia isolated from neonatal WT mice was over 95% pure, as indicated by double immunofluorescence staining. To mimic the neuroinflammation that occurs in the context of AD, primary microglia were stimulated with PBS or LPS (10 ng/mL, 100 ng/mL, or 1000 ng/mL) for 24 hours. As shown inFigure 2B
, TREML2 levels increased in response to stimulation with 100 ng/mL or 1000 ng/mL LPS (allP
< 0.05). As stimulation with 1000 ng/mL LPS markedly decreased microglia proliferation (Figure 2C
;P
< 0.05), an LPS dose of 100 ng/mL was used in subsequent experiments.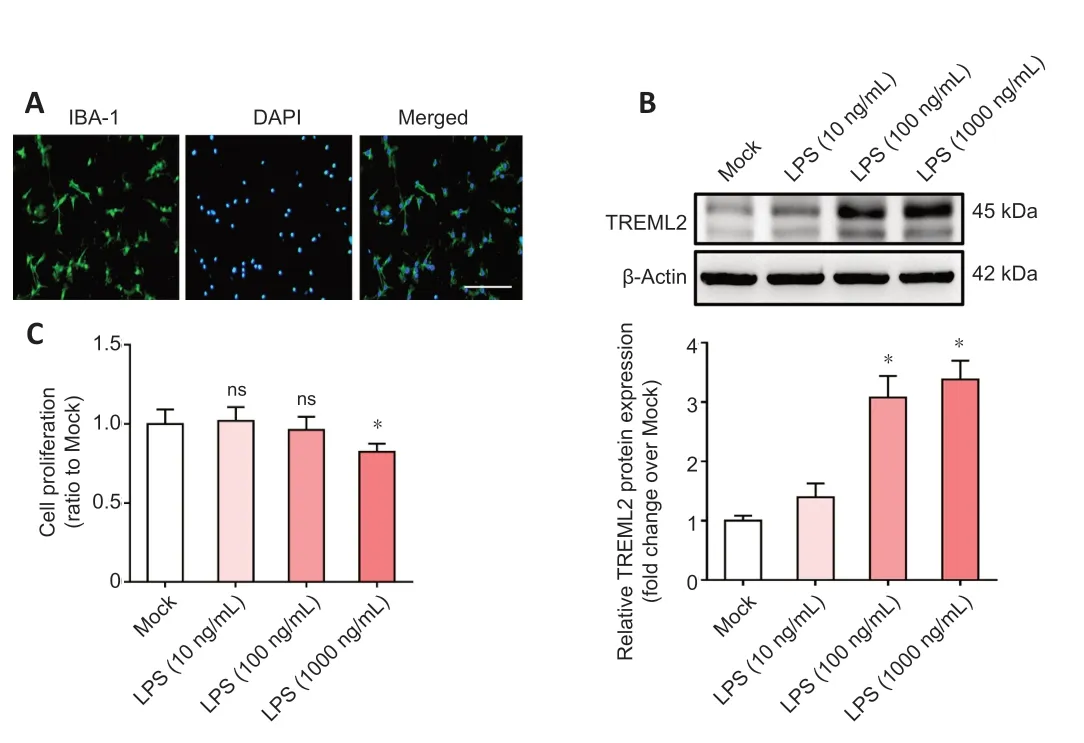
Figure 2|Microglial TREML2 levels increase under inflammatory condition. (A) Double immunofluorescence staining (DAPI [blue] and IBA-1 [green]) indicating that the primary microglia cells isolated from neonatal WT mice were over 95% pure. Scale bar: 50 µm. (B) TREML2 levels in primary microglia after stimulation with 10 ng/mL, 100 ng/mL, or 1000 ng/mL LPS for 24 hours, as detected by western blot assay. Data were normalized to β-actin. (C) Cell viability after stimulation with 10 ng/mL, 100 ng/mL, or 1000 ng/mL LPS for 24 hours, as evaluated by cell counting kit-8 assay. Panels B and C show representative data for four independent experiments performed in duplicate. Data were analyzed by one-way analysis of variance followed by Tukey’s post hoc test. Columns represent mean ± SD. *P < 0.05, vs. mock group. DAPI: 4′,6-Diamidino-2-phenylindole; IBA-1: ionized calcium-binding adaptor protein-1; LPS: lipopolysaccharide; ns: not significant; TREML2: triggering receptor expressed on myeloid cells-like 2.
TREML2 facilitates microglia-mediated inflammation
To investigate the potential regulatory effect of TREML2 on microglial inflammatory cytokine release, we used a lentivirus-mediated strategy to overexpress or knock downTREML2
in 100 ng/mL LPS–stimulated primary microglia (Figure 3A–D
) and assessed IL-1β, IL-6, and TNF-α levels in the culture medium by ELISA. As shown inFigure 4A–C
, LPS (100 ng/mL) stimulation led to release of IL-1β, IL-6, and TNF-α into the microglial culture medium.TREML2
overexpression facilitated the LPS-induced microglial release of IL-1β, IL-6, and TNF-α (Figure 4A–C
; allP
< 0.05). In contrast,TREML2
knockdown markedly attenuated the microglial release of IL-1β, IL-6, and TNF-α induced by LPS (Figure 4D–F
; allP
< 0.05).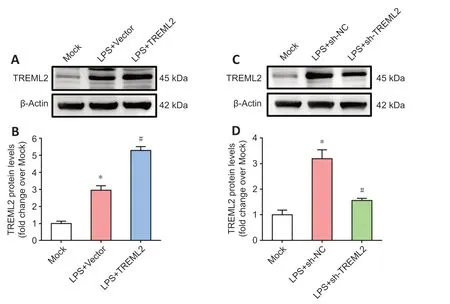
Figure 3|Lentivirus-mediated overexpression and knockdown of microglial TREML2. (A) Lentivirus-mediated TREML2 overexpression was confirmed by western blot. (B) Quantitative analysis of the TREML2 levels shown in panel A. Data were normalized to β-actin. (C) Lentivirus-mediated TREML2 knockdown was confirmed by western blot. (D) Quantitative analysis of the TREML2 levels shown in panel C. Data were normalized to β-actin. All figures show data representative of four independent experiments performed in duplicate. Data were analyzed by one-way analysis of variance followed by Tukey’s post hoc test. Columns represent mean ± SD. *P < 0.05, vs. mock group; #P < 0.05, vs. LPS + vector group (panel B) or LPS + sh-NC group (panel D). LPS: Lipopolysaccharide (100 ng/mL); sh-NC: control for lentiviral knockdown particles; sh-TREML2: TREML2 shRNA lentiviral knockdown particles; TREML2: triggering receptor expressed on myeloid cells-like 2.
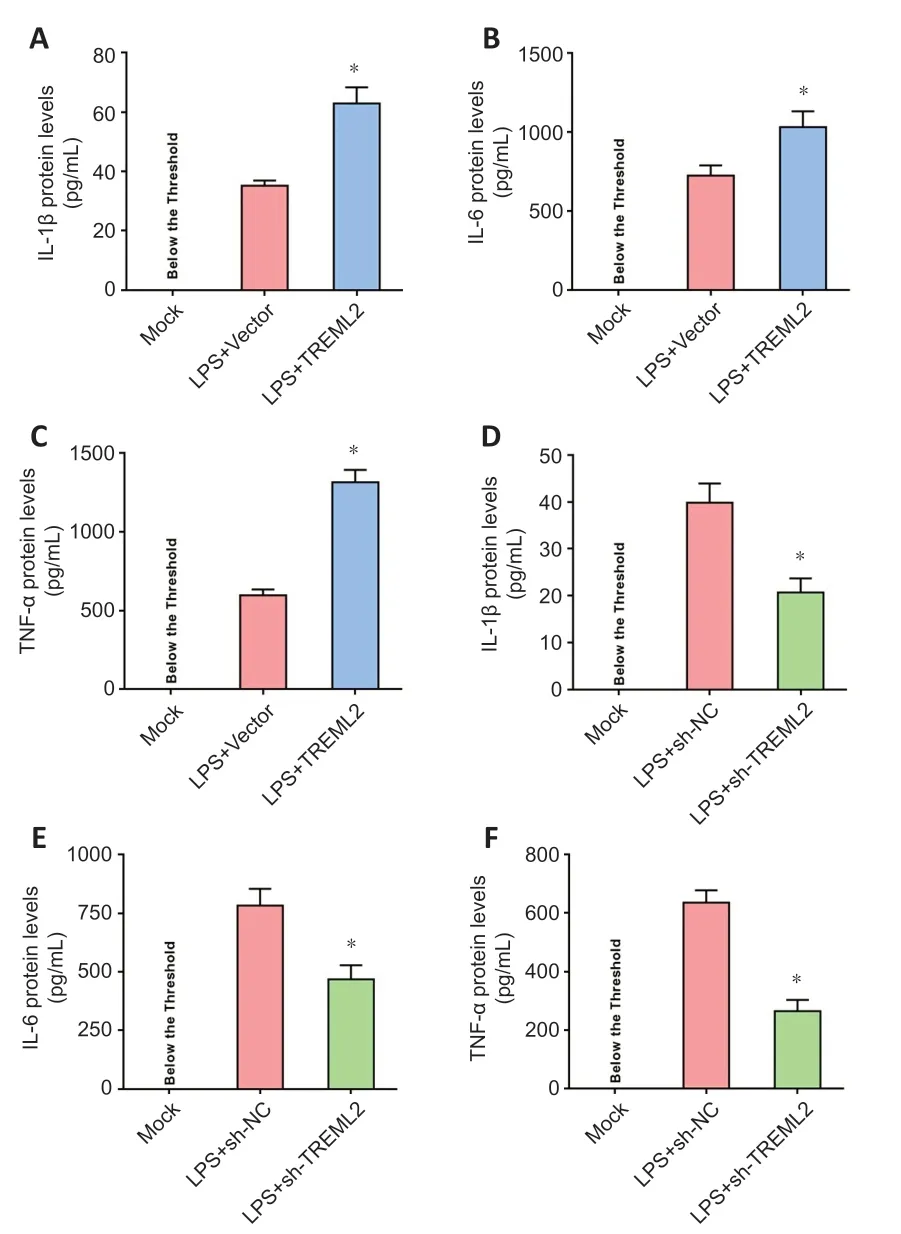
Figure 4|TREML2 facilitates microglia-mediated inflammation. (A–C) Levels of the inflammatory cytokines IL-1β, IL-6, and TNF-α in primary microglia after TREML2 overexpression, as detected by ELISA. (D–F) Levels of the inflammatory cytokines IL-1β, IL-6, and TNF-α in primary microglia after TREML2 knockdown, as detected by ELISA. All figures show data representative of four independent experiments performed in duplicate. Data were analyzed by Student’s t-test. Columns represent mean ± SD. *P < 0.05, vs. LPS + vector group (panel A–C) or LPS + sh-NC group (panel D–F). ELISA: Enzyme-linked immunosorbent assay; IL: interleukin; LPS: lipopolysaccharide (100 ng/mL); LPS+sh-NC: LPS+control for lentiviral knockdown particles; LPS+sh-TREML2: LPS+TREML2 shRNA lentiviral knockdown particles; TNF-α: tumor necrosis factor α; TREML2: triggering receptor expressed on myeloid cells-like 2.
TREML2 promotes M1-type microglial polarization
In the brain, activated microglia exhibit either M1-type polarization (proinflammatory status) or M2-type polarization (anti-inflammatory status) (Wang et al., 2021b). As shown inFigure 5A
andB
, LPS (100 ng/mL) stimulation of purified primary microglia significantly increased the levels of iNOS, an M1-type polarization marker (P
< 0.05) (Collmann et al., 2019).TREML2
overexpression further elevated the LPS-induced increase in iNOS levels (Figure 5A
andB
,P
< 0.05). In contrast, the LPS-induced increase in iNOS levels was attenuated byTREML2
knockdown (Figure 6A
andB
;P
< 0.05). As shown inFigure 5A
,C
, andD
, LPS (100 ng/mL) stimulation slightly increased the levels of CD206 and ARG1, two M2-type polarization markers (Han et al., 2018; Kobashi et al., 2020), in primary microglia. However, these increases did not reach statistical significance (allP
> 0.05). Overexpression ofTREML2
significantly reduced the levels of CD206 and ARG1 in primary microglia (Figure 5C
andD
; allP
< 0.05), while the levels of CD206 and ARG1 in primary microglia were elevated by TREML2 knockdown (Figure 6A
,C
andD
; allP
< 0.05).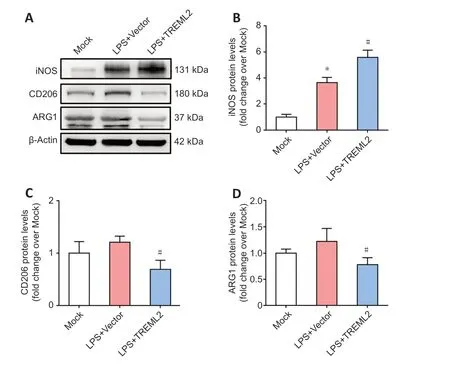
Figure 5|Effect of TREML2 overexpression on microglial polarization markers. (A) Levels of the microglial M1-type polarization marker iNOS as well as the microglial M2-type polarization markers CD206 and ARG1 in primary microglia after TREML2 overexpression, as detected by western blot. (B–D) Quantitative analysis of iNOS, CD206, and ARG1 protein levels. Data were normalized to β-actin. All figures show data representative of four independent experiments performed in duplicate. Data were analyzed by one-way analysis of variance followed by Tukey’s post hoc test. Columns represent mean ± SD. *P < 0.05, vs. mock group; #P < 0.05, vs. LPS + vector group. ARG1: Arginase 1; iNOS: inducible nitric oxide synthase; LPS: lipopolysaccharide (100 ng/mL); LPS+vector: LPS+control for lentiviral overexpression particles; LPS+TREML2: LPS+TREML2 lentiviral overexpression particles.
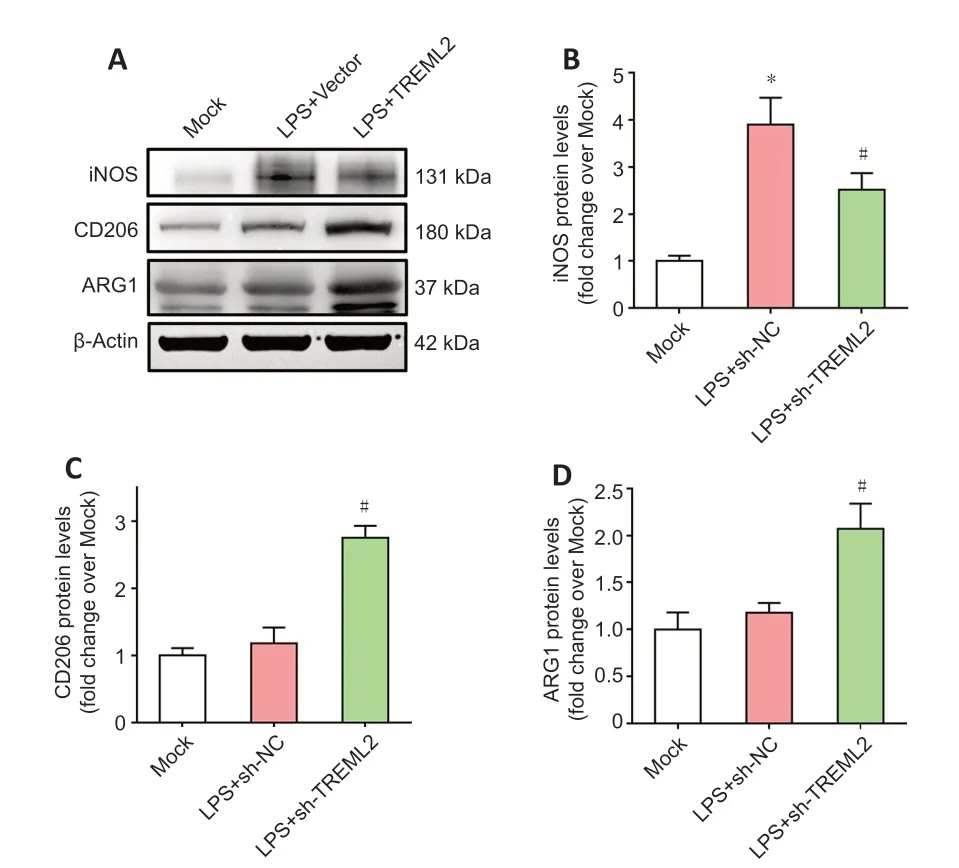
Figure 6|Effect of TREML2 knockdown on microglial polarization markers.(A) Levels of the microglial M1-type polarization marker iNOS as well as the microglial M2-type polarization markers CD206 and ARG1 in primary microglia after TREML2 knockdown, as detected by western blot assay. (B) Quantitative analysis of iNOS protein levels. Data were normalized to β-actin. (C) Quantitative analysis of CD206 protein levels. Data were normalized to β-actin. (D) Quantitative analysis of ARG1 protein levels. Data were normalized to β-actin. All figures show data representative of four independent experiments performed in duplicate. Data were analyzed by one-way analysis of variance followed by Tukey’s post hoc test. Columns represent mean ± SD. *P < 0.05, vs. mock group; #P < 0.05, vs. LPS + sh-NC group. ARG1: Arginase 1; iNOS: inducible nitric oxide synthase; LPS: lipopolysaccharide (100 ng/mL); LPS+sh-NC: LPS+control for lentiviral knockdown particles; LPS+sh-TREML2: LPS+TREML2 shRNA lentiviral knockdown particles.
TREML2 induces microglial NLRP3 inflammasome activation
NLRP3 inflammasome activation is crucial for modulating microglial polarization (Wang et al., 2021a). As shown inFigure 7A
andB
, LPS (100 ng/mL) stimulation significantly increased NLRP3 levels in primary microglia (P
< 0.05), andTREML2
overexpression further elevated this increase (P
< 0.05;Figure 7A
andB
). In contrast, the LPS-induced increase in NLRP3 levels in primary microglia was attenuated byTREML2
knockdown (P
< 0.05;Figure 7C
andD
).
Figure 7|TREML2 induces microglial NLRP3 inflammasome activation. (A) NLRP3 levels in primary microglia after TREML2 overexpression, as detected by western blot. (B) Quantitative analysis of the NLRP3 levels shown in panel A. Data were normalized to β-actin. (C) NLRP3 levels in primary microglia after TREML2 knockdown, as detected by western blot. (D) Quantitative analysis of the NLRP3 levels shown in panel C. Data were normalized to β-actin. All figures show data representative of four independent experiments performed in duplicate. Data were analyzed by one-way analysis of variance followed by Tukey’s post hoc test. Columns represent mean ± SD. *P < 0.05, vs. mock group; #P < 0.05, vs. LPS + vector group (panel B) or LPS + sh-NC group (panel D). LPS: Lipopolysaccharide (100 ng/mL); LPS+sh-NC: LPS+control for lentiviral knockdown particles; LPS+sh-TREML2: LPS+TREML2 shRNA lentiviral knockdown particles; NLRP3: NLR family pyrin domain-containing 3; TREML2: triggering receptor expressed on myeloid cells-like 2.
Discussion
In this study, we showed that brain TREML2 levels gradually increase during AD progression. This supports a previous study by Sierksma et al. (2020), which showed that TREML2 is elevated in the brains of APP/PS1 mice during AD progression, suggesting that TREML2 is involved in the pathogenesis of AD.
Microglia are the resident immune cells of the brain (Hickman et al., 2018; Xu et al., 2021; Zhang et al., 2021). During AD progression, activated microglia exert both beneficial and detrimental effects on the brain (Sarlus and Heneka, 2017; Hansen et al., 2018; Leng and Edison, 2021). Microglia participate in Aβ clearance through their phagocytic activity (Sarlus and Heneka, 2017). Chronic microglial activation leads to overproduction of inflammatory cytokines, which causes neuronal and synaptic damage (Jiang et al., 2018). Several lines of evidence indicate that TREML2 is expressed by microglia in the brain (Benitez et al., 2014; Zheng et al., 2016; Song et al., 2019; Wang et al., 2020b). Based on this evidence, we speculated that TREML2 contributes to AD pathogenesis via modulation of microglia-mediated inflammation.
To mimic the inflammatory conditions that occur in the context of AD context, primary microglia were stimulated with LPS. We found that TREML2 levels in primary microglia increased in response to LPS stimulation. This is in accordance with a previous study by Zheng et al. (2016) indicating that microglial TREML2 expression is upregulated by stimulation with LPS. To further investigate the modulatory role of TREML2 in microglia-mediated inflammation, we employed a lentivirus-mediated overexpression and knockdown strategy to manipulateTREML2
expression on microglia. We showed thatTREML2
overexpression enhanced the LPS-induced microglial release of inflammatory cytokines, including IL-1β, IL-6, and TNF-α. In contrast, the LPS-induced microglial release of inflammatory cytokines was inhibited byTREML2
knockdown. These findings are consistent with a study by Zheng et al. (2016) that revealed thatTREML2
knockdown suppressed inflammatory cytokine production by microglia. Taken together, these observations imply that TREML2 facilitates microglia-mediated inflammation.In the brain, activated microglia exhibit either M1-type polarization or M2-type polarization (Yao and Zu, 2020; Wang et al., 2021b). M1-type polarization is characterized by pro-inflammatory status, while M2-type polarization is characterized by enhanced anti-inflammatory activity. In this study, LPS stimulation induced M1-type polarization of microglia, as indicated by the increase in the levels of iNOS, a classic marker of M1-type polarization, following LPS stimulation.TREML2
overexpression further elevated the LPS-induced increase in iNOS expression. In contrast,TREML2
knockdown attenuated the LPS-induced upregulation of iNOS. Interestingly, we noted that the levels of two M2-type polarization markers, CD206 and ARG1, were reduced byTREML2
overexpression, whileTREML2
knockdown upregulated the expression of these two proteins. This finding implies that TREML2 facilitates microglia-mediated inflammation by promoting M1-type microglial polarization.Accumulating evidence suggests that NLRP3 inflammasome activation is crucial for modulating microglial polarization (Song et al., 2021; Wang et al., 2021a). As a molecular platform for inflammatory responses, the NLRP3 inflammasome is composed of NLRP3, ASC, and procaspase-1 (Tan et al., 2013; Duan et al., 2021). Activation of the NLRP3 inflammasome has been observed in AD (Heneka et al., 2013). In our study, we found that LPS stimulation activated the NLRP3 inflammasome. Interestingly,TREML2
overexpression further enhanced the LPS-induced activation of microglial NLRP3 inflammasomes. In contrast, LPS-induced activation of microglial NLRP3 inflammasomes was attenuated byTREML2
knockdown. This observation implies that TREML2 may function as an activator of the microglial NLRP3 inflammasome. To our knowledge, this is the first study demonstrating a regulatory effect of TREML2 on microglial NLRP3 inflammasome activation. In view of this evidence, we speculate that TREML2 may affect microglial polarization by regulating NLRP3 inflammasome activation status.This study had some limitations. First, only the dynamic alterations in brain TREML2 levels during AD progression were investigated in this study. The spatial distribution patterns of TREML2 in the brain as well as the expression patterns of other TREML family members such as TREML1 and TREML4 during disease progression, deserve further investigation. Second, the use of primary microglia from neonatal WT mice may have prevented us from observing the regulatory effects of TREML2 on neuroinflammation during AD progression. In the future, we will analyze microglia isolated from adult APP/PS1 transgenic mice at different ages to validate our findings. Furthermore, thesein vitro
results should be confirmed using AD animal models. Third, in the current study, we only investigated the role of TREML2 in microgliamediated inflammation. Future experiments should address whether TREML2 is expressed by other types of brain cells, such as neurons and astrocytes.In conclusion, this study provides the first evidence that TREML2 modulates inflammation by regulating microglial polarization and NLRP3 inflammasome activation. These findings reveal the mechanisms by which TREML2 regulates microglial inflammation and suggest that TREML2 inhibition may represent a novel strategy for treating AD.
Author contributions:
TJ and YDZ designed the study and wrote the manuscript. SYW, XXF, RD and BW performed experimental operations. YE, HMC and SYC collected data. All authors approved the final submitted manuscript.
Conflicts of interest:
The authors declare that they have no conflicts of interest.
Open access statement:
This is an open access journal, and articles are distributed under the terms of the Creative Commons AttributionNonCommercial-ShareAlike 4.0 License, which allows others to remix, tweak, and build upon the work non-commercially, as long as appropriate credit is given and the new creations are licensed under the identical terms.
- 中国神经再生研究(英文版)的其它文章
- c-Abl kinase at the crossroads of healthy synaptic remodeling and synaptic dysfunction in neurodegenerative diseases
- The mechanism and relevant mediators associated with neuronal apoptosis and potential therapeutic targets in subarachnoid hemorrhage
- Microglia depletion as a therapeutic strategy: friend or foe in multiple sclerosis models?
- Brain and spinal cord trauma: what we know about the therapeutic potential of insulin growth factor 1 gene therapy
- Functions and mechanisms of cytosolic phospholipase A2 in central nervous system trauma
- Cre-recombinase systems for induction of neuronspecific knockout models: a guide for biomedical researchers

