Simultaneous quantification of 18 bioactive constituents in Ziziphus jujuba fruits by HPLC coupled with a chemometric method
Tinyi Wng, Sen Guo, Ximeng Ren, Junfeng Du, Lu Bi,Xueqin Cui, Chi-Tng Ho*, Nisheng Bi,*
a College of Food Science and Technology, Northwest University, Xi’an 710069, China
b College of Chemical Engineering, Northwest University, 229 Taibai North Road, Xi’an 710069, China
c Shaanxi Family Forestry Bureau, Shaanxi Jiaxian Development and Reform and Science and Technology Bureau, Yulin 719200, China
d Department of Food Science, Rutgers University, New Brunswick 08901, USA
Keywords:
Ziziphus jujuba
HPLC-DAD-MS
Quantitative analysis
Hierarchical cluster analysis
HepG2 cells
A B S T R A C T
The fruit of Ziziphus jujuba Mill., known as Hongzao (or Hong-Zao) in Chinese and cultivated in China for more than 4 000 years, has shown to have hepatoprotective property. In previous study, we have isolated and identified 27 known compounds from Z. jujuba fruits, which demonstrated anti-tumor activity. In this study,a high-performance liquid chromatography-diode-array detection-mass spectrometry (HPLC-DAD-MS)method was successfully applied to the simultaneous characterization and quantitation of 18 constituents in 28 Z. jujuba samples, comprised of 12 cultivars from different regions in China, by comparing their HPLC retention times, MS spectra, UV spectra, and NMR data with those of reference compounds. The quantitative method was validated with excellent linearity (R2 > 0.999 1), preferable intra- and inter-day precisions (RSD <2.78%), and good recoveries (94.96%–102.65%). The content variation of 18 compounds was analyzed by a chemometric method (hierarchical cluster analysis). In addition, these constituents showed protection against carbon tetrachloride (CCl4) intoxicated HepG2 cell lines by decreasing lactic dehydrogenase (LDH) levels.Results in this study illustrated that the content of all 18 compounds examined has significant difference and variation among cultivars and extracts. The proposed method can serve as a prerequisite for quality control of bioactive compounds in Z. jujuba products.
1. Introduction
Ziziphus jujubaMill., belonging to the family Rhamnaceae, has been utilized as food as well as traditional medicine in China for thousands of years. China is the biggest producing area, generating more than 90% of the world total output. Jujube is widely distributed in Northern China, especially in Shaanxi, Hebei, Shanxi, Shandong,Henan, and Xinjiang provinces. Chinese jujube germplasm resources are abundant with about 800 varieties with new varieties continue to be produced [1-3]
In recent years, many studies on the chemistry and biological activity ofZ. jujubahave been carried out. Phytochemical studies revealed thatZ. jujubacontains various chemical constituents, including triterpenic acids [4-6], flavonoids [7,8], saponins [9], alkaloids [10],amino acids [11,12], phenolic acids [13-16], and polysaccharides [17].There are multiple biological activities such as hepatoprotective [18,19],antioxidant [20-23], anti-inflammatory [24], anti-tumor [25-27],gastrointestinal protection [28], and potential sedative effects [29].In addition, it has been found thatZ. jujubacontains nucleosides and nucleobases, such as adenosine 3’,5’-cyclic monophosphate(cAMP) and guanosine 3’,5’-cyclic monophosphate (cGMP) [30].Jujube fruit is also recognized as a rich source of cAMP [31].Thus, it is desirable to investigate the content of cAMP in different batches ofZ. jujuba.
High-performance liquid chromatography (HPLC) is used in the characterization and quantitation ofZ. jujubeand considered as a strategy to identify and evaluate the quality of herbal medicines with complex properties [32]. To our knowledge, few chromatographic methods for qualitative and quantitative analyses ofZ. jujubaextract have been performed, such as HPLC and reversed phase (RP)-HPLC [33-35].For quantitation, the HPLC and liquid chromatography mass spectrometry (LC-MS) analyses have been proved effective analytical techniques for the bioactive compounds inZ. jujubafruit [35,36].
SinceZ. jujubahas abundant functional properties [3], many scientists have paid close attention to study the bioactive compounds inZ. jujuba. However, only several studies have reported the method for the quantitative analysis of different compounds amongZ. jujubafruits. Nevertheless, there is no study involved in the determination of samples from different regions in China and lack of methods to distinguish the numerous samples from different regions.
The aim of this study was to develop an efficient method for the qualitative and quantitative analysis of bioactive compounds inZ. jujubafruits. With the developed method, we further investigated the differences of compound contents amongZ. jujubafruit from different regions in China. We also studied the profiles of 18 main components in 28 jujube extracts from 12 cultivars from different provinces in China by using hierarchical cluster analysis (HCA).The obtained quantitative data can be used for quality control of bioactive compounds inZ. jujubaand can be of significance for the comprehensive development and utilization ofZ. jujubaresources.
2. Materials and methods
2.1 Chemicals and reagents
Methanol (MeOH) and acetic acid (HPLC grade) were purchased from Merck (Darmstadt, Germany). Ethanol (EtOH) and water(analytical grade) were purchased from Hengxing Chemical Reagent Co. Ltd. (Tianjin, China). Standard substances were previously isolated and identified fromZ. jujubafruits in our laboratory. They are 3-O-trans-p-coumaroyl alphitolic acid (1), 3-O-cis-p-coumaroyl alphitolic acid (2), 3-β-O-trans-p-coumaroyl maslinic acid (3),traumatic acid (4), (E)-11-oxo-hexadec-9-enoic acid (5), 7(E)-9-ketohexadec-7-enoic acid (6), 9(E)-11-oxo-octadecenoic acid (9CI) (7),quercetin-3-O-rutinoside (8), apigenin (9), cAMP (10), benzoic acid (11),1,2,4-benzenetriol (12), 4-hydroxybenzoic acid (13), salicylic acid (14),3,4-dihydroxybenzoic acid (15),p-hydroxybenzaldehyde (16),cis-phydroxycinnamic acid (17) andtrans-p-hydroxycinnamic acid (18).Their spectral data (1H Nuclear Magnetic Resonance (NMR) and13C NMR) are listed in the Supplementary Material. The purity of each compound was > 98% as determined by HPLC analysis. The chemical structures of these reference compounds are shown in Fig. 1.

Fig. 1 Chemical structures of the 18 identified components.
2.2 Extraction and isolation
DriedZ. jujubafruits (10 kg) were grinded to powder after core removal. The yielded powder was extracted with EtOAc three times(each for 24 h) and the ratio of the material to solvent was 1 : 2.5.The solution was filtered, combined and concentrated under vacuum at 42 °C to yield crude extract (159 g). Then the crude extract was suspended in water and extracted with EtOAc for three times. The organic layers were separated, combined and concentrated in vacuo to obtain the EtOAc extract (96 g). Similarly, the water solution was combined and concentrated under vacuum to yield water extract (51 g).
The EtOAc extract was subjected to a silica gel column (400 g of silica gel, 200–300 mesh) and a gradient elution with petroleum ether-acetone to obtain 5 major fractions (A-E). The fractions were monitored using Agilent 1260 LC and thin-layer chromatography(TLC) with the solvent petroleum ether-EtOAc. Fraction C (21 g)was purified by an ODS C18silica gel column, with a gradient of acetonitrile (ACN)-H2O to have 4 subfractions (C-1, C-2, C-3 and C-4). Fraction C-2 was passed through a Sephadex LH-20 column to obtain 1 (46 mg), 7 (23 mg), and 8 (7 mg). Fraction C-3 was separated by a MCI GEL CHP-20P column to get 5 (13 mg), 6 (75 mg),and 18 (17 mg). Fraction C-4 was purified by a Sephadex LH-20 column to obtain 2 (90 mg), and 3 (62 mg). Fraction D (13.1 g) was divided into 5 subfractions (D-1, D-2, D-3, D-4 and C-5) by a silica gel column using a gradient of petroleum ether-acetone. Fraction D-3 was purified by using a Sephadex LH-20 column and eluted with ACN-H2O to obtain 3 subfractions (D-3-1, D-3-2, and D-3-3). D-3-2 was purified using a MCI GEL CHP-20P column to get 4 (13 mg).D-3-3 was separated by a Sephadex LH-20 column to get 17 (18 mg),and 12 (95 mg). Fraction D-4 was passed through a Sephadex LH-20 column to obtain subfractions D-4-1, D-4-2, and D-4-3. Subfractions D-4-1 was purified by a Sephadex LH-20 column to get 11 (4 mg),and 14 (21 mg). Subfractions D-4-2 was further separated by MCI GEL CHP-20P column to obtain 15, and 16.
The water extract (51 g) was passed through a macroporous resin D101 column (600 g of D101), eluted with a gradient of EtOH-H2O,to obtain four subfractions W-1, W-2, W-3, and W-4. Subfraction W-2,was then purified by a Sephadex LH-20 column to yield 9 (32 mg), 10(18 mg), and 13 (50 mg).
2.3 Chromatographic conditions and instrumentation
HPLC analysis was performed on an Agilent 1260 series, which was equipped with a DAD detector (Agilent G1315D), a vacuum degasser, a binary pump delivery system (Agilent G1312A), and a Luna C18column with an I.D. of 250 mm × 4.6 mm, particle size of 5 μm, pore size 100 Å (Phenomenex, Inc., Torrance, CA, USA).The flow rate of the mobile phase was 1.0 mL/min. The column temperature was maintained at 30 °C. The cylinder membrane filter(0.22 μm) was from Jinteng Laboratory Equipment Co., Ltd. (Tianjin,China).
The mobile phase was composed of water with 1.0% of acetic acid (A) and MeOH (B) with a gradient elution: 0 min, 5% B; 0–8 min, 5%–25% B; 8–18 min, 25%–50% B; 18–28 min, 50%–75% B;28–40 min, 75%–85% B; and 40–52 min, 85%–95% B. Total gradient time was 52 min. Detection wavelength was set at 320 nm for compounds 1, 2, 3, 12, 18, and at 254 nm for 4, 5, 6, 7, 8, 9, 10, 11,13, 14, 15, 16 and 17, respectively.
HPLC-MS conditions: the column and the conditions of HPLC were the same as the HPLC-DAD system mentioned above. The mass spectra of compounds inZ. jujubafruits were recorded using electrospray ionization (ESI) with nitrogen for the carrier gas and a triple quadrupole system. The mass spectrometer was operated in a positive ionization mode. The MS parameters were as below: capillary voltage 3 500 V, fragmenter ramped from 60 V to 120 V; drying gas temperature 400 °C, gas flow (N2) 15 mL/min. The scan range wasm/z50–1 000 in mode using a cycle time of 1.5 s with a step size of 0.1 u and a pause between each scan of 2 ms.
2.4 Plants materials
Fourteen batches of jujube fruits (samples A-N), consisting of 12 cultivars from different regions were collected in April 2018.The samples were harvest in Autumn 2017. Samples A, H, I, and K are Hetianyuzao, Meizao, Hetianhongzao and Ruoqianghongzao,collected in Hetian, Akesu, Hetian and Ruoqiang in Xinjiang,respectively. Samples B, L, M and N are Muzao, collected in Jiaxian,Shaanxi. Samples C and J are Dongzao and Jinsizao, collected from Zhanhua and Leling in Shandong. Sampless D and G are Jixinzao and Tanzao, collected from Yuncheng and Liulin in Shanxi. Sample E is Yeshengzao and F is Goutouzao collected in Yanan, and Shaanxi.The information of all jujube samples used for analysis was listed in Table 1. Samples were immediately transferred to the laboratory,air dried outdoors at ambient temperature, and stored at –4 ℃ in a refrigerator until used. Their botanical origins were identified by Professor Naisheng Bai, and voucher specimens were deposited in the herbarium of Northwest University, Shaanxi, China.
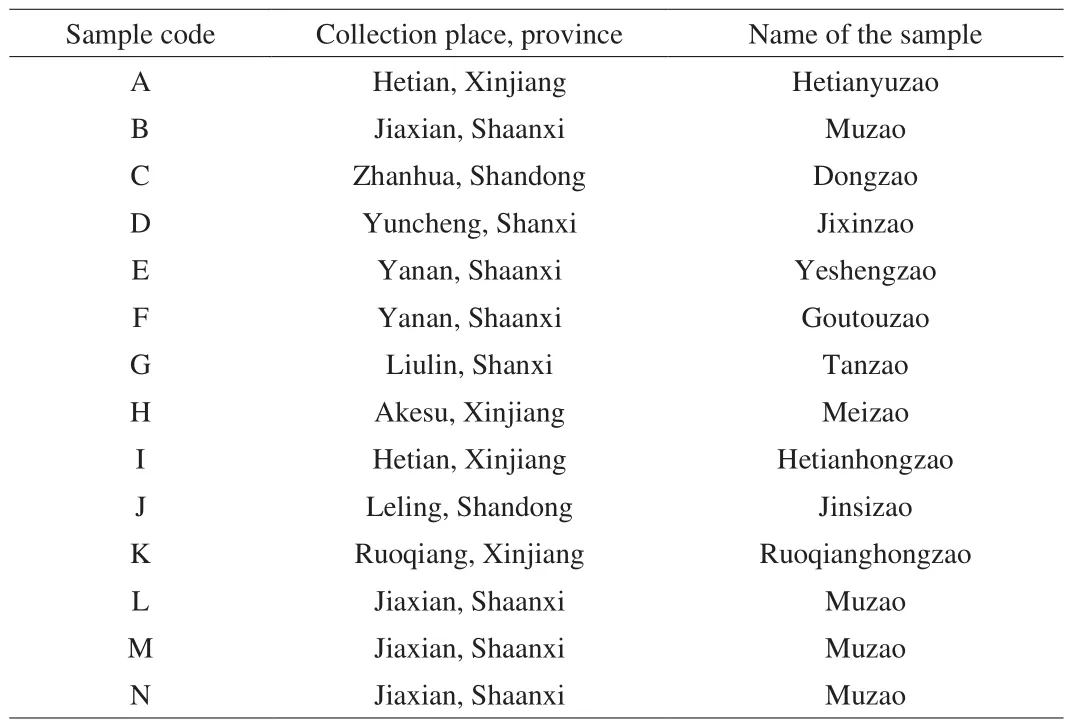
Table 1List of jujube samples used for analysis, including sample code, the collection place and province.
2.5 Preparation of sample solutions
First, the cores of air-dried jujube fruits were removed, then the flesh pulverized to homogeneous powders (60 mesh), and the jujube powder was further dried in an oven at 45 ℃ for 24 h. Then,the powders of each sample (A through K) were weighed accurately in duplicates (10 g, each), and placed in two 100 mL conical flasks with an addition of 40 mL water and 40 mL ethanol to each sample. Next, after accurate weighing, ultrasonication (40 kHz) was performed at room temperature for 2 h, and the same solvent was added to compensate for the weight lost during extraction. Finally,after centrifugation (13 000 r/min, 10 min), the supernatant was concentrated to 10 mL in vacuo and stored at 4 ℃. In the end, we obtained 28 extracts from 14 batches of jujube. For example, sample A represents the EtOH-extract while A1represents the H2O-extract of Hetianyuzao. All were done in the same manner. 1 mL of extracting solution of each sample was removed and filtered through a 0.22 μm membrane filter before injection into the HPLC system for analysis.
2.6 Preparation of standard solutions
A standard stock solution (1.0 mg/mL) was prepared by dissolving the reference compound in methanol/water (6:1,V/V)for each analyte, and the standard stock solution was stored at 4 ℃ in the dark for further analysis. Working standard solutions for calibration curves were prepared by diluting the standard stock solution with 10% methanol to 5 concentrations. The calibration curve for the compounds was constructed by plotting peak areas versus compound concentration. A mixed standard stock solution containing the reference compounds 1–18 was prepared. Fig. 2 shows the HPLC-DAD chromatogram of 18 standard compounds. Table 2 lists the linearity ranges for these 18 analytes. The standard solutions were filtered through a 0.22 μm membrane prior to injection. All solutions were stored in a refrigerator at 4 ℃ before analysis.

Fig. 2 HPLC-DAD chromatograms of solutions of standards (A) and samples (B). Peak numbers refer to the compounds shown in Fig. 1.
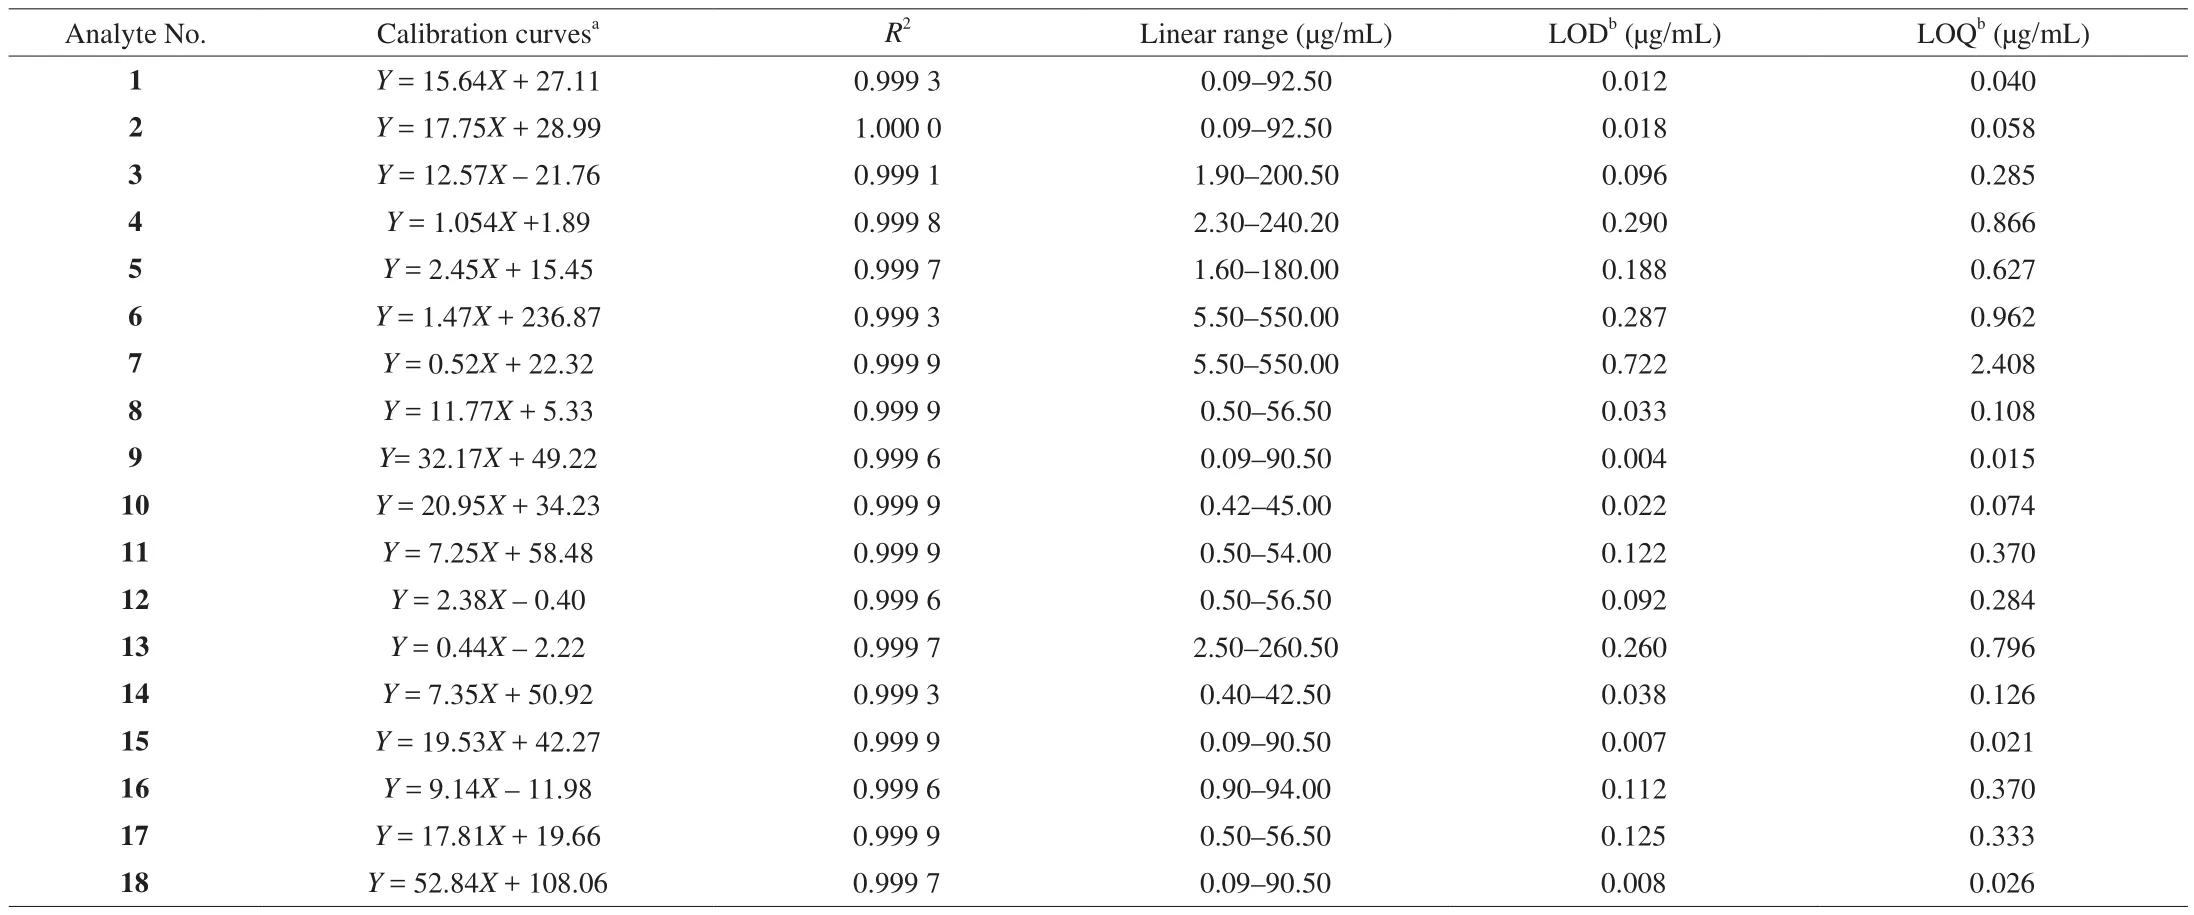
Table 2Calibration curves and LOD and LOQ data of 18 compounds investigated by HPLC.
2.7 HPLC method validation
Standard curve was obtained by plotting the peak areas versus the corresponding concentrations of each analyte. The lowest concentration of each working solution was diluted with water or ethanol to a series of appropriate concentrations for calibration.Diluted samples were analyzed until the signal-to-noise ratio (S/N)for each compound about 3 for the limit of detection (LOD) and 10 for the limit of quantification (LOQ). Precision of this method was evaluated by analyzing solutions containing all standard compounds.Table 2 also lists the calibration curves (R2), LOD and LOQ for all 18 analytes. The experiment was repeated six times on the same day and one each on 3 consecutive days to determine intra- and inter-day precision. The intra- and inter-day precisions of retention time were also investigated. Then, the relative standard deviation(RSD) of concentration for each of the marker compounds and their retention time were calculated. To con firm repeatability, 6 different sample solutions were prepared from the same sample (sample 1)and the retention time of each analyte was analyzed. Variations were expressed in RSD. To evaluate the stability of the solution and the retention time of the analytes, one sample solution and one standard solution mentioned above was stored at 25 ℃ and analyzed at 0, 2,4, 8, 12, and 24 h. A recovery test was used to evaluate the accuracy of this method. The test was performed by adding known quantities of one standard into a certain amount ofZ. jujubafruit (sample B)separately. The spiked samples were then extracted, processed, and quantified in accordance with the methods mentioned above. Three replicates were performed for the test. The detected amounts (actual)were calculated by subtracting the total amount of each compound before spiking from the total amount after spiking. The ratio of detected amount to spiked amount was used to calculate recovery percentage.
2.8 Identification, quantification and data analysis
Identification of the 18 components was carried out by comparing the HPLC retention time, MS spectra and UV spectra of target peaks with those of standards, the1H and13C NMR data with those reported in the literature. In addition, the standard compounds were spiked with the extract of jujube as a direct comparison. Quantification was performed on the basis of linear calibration plots of the peak areas versus the concentration.
Chemometric method (HCA) was performed to classify the 14 samples of jujube collected from different provinces in China according to their contents of 18 compounds. Chemometric analysis was performed using SPSS version 17.0 software for Windows (SPSS Inc. Chicago, IL).
2.9 Lactate dehydrogenase (LDH) release assay
LDH release assay was performed according to manufacturer recommendations (Beyotime Company, Hangzhou, China). Briefly,experiment was performed in 4 groups: blank control, negative control, sample maximum enzyme activity control, and experiment group. HepG2 cells (6 × 10³/well) were seeded into a 96-well plate.After adherence, cells were pretreated with 1% CCl4in culture medium for 6 hours, then supernatants were discarded, and cells were treated again with final concentration of 50 μg/mL compounds 1–18 for 24 h. For sample maximum enzyme activity control, LDH release reagents were added. Cell plates were centrifuged by 400 ×gfor 5 min and 120 μL of supernatant of each well was aspirated and transferred to a new plate. LDH detection solution (60 μL) was added into each well and incubated away from light for 30 min at room temperature, plates were read at absorbance OD490nmwith Biotek Epoch spectrophotometer (Winooski, VT, USA).
3. Results and discussion
3.1 HPLC method validation
The proposed HPLC method was validated by determining linearity, LOD, LOQ, precision, repeatability, stability, and accuracy of the investigated analytes, as well as the inter- and intra-day precisions, repeatability and stability of retention time. The results demonstrated that all calibration curves exhibited excellent linear regressions, with determination coefficients (r2) ranging from 0.999 1 to 1.000 0. The calibration ranges adequately covered variations in the amount of the compounds investigated in the samples. The overall LODs and LOQs were < 0.750 and 2.500 μg/mL, respectively (Table 2).
Among the samples tested, the ethanol extract from Muzao(sample B) contained almost all 18 compounds of interest, hence this sample was selected as the model for determination of repeatability,stability, and recovery. The intra- and inter-day variations,repeatability, and stability RSD for the 18 compounds were all< 2.78% and are shown in Table 3. The overall recoveries lay between 94.96% and 102.65% for the 18 reference compounds, with RSDs of < 2.91%, indicating that the established method was accurate for determination of the 18 compounds in jujube.

Table 3Precision, repeatability, stability, and recovery of the 18 analytes.
3.2 Identification of the 18 compounds
By comparing their HPLC retention time, MS spectra, UV spectra and the1H and13C NMR data with those of reference compounds (Supporting Information), 18 constituents in jujube were unequivocally identified as 3-O-trans-p-coumaroyl alphitolic acid (1),3-O-cis-p-coumaroyl alphitolic acid (2), 3-β-O-trans-p-coumaroyl maslinic acid (3), traumatic acid (4), (E)-11-oxohexadec-9-enoic acid (5),7(E)-9-keto-hexadec-7-enoic acid (6), 9(E)-11-oxo-octadecenoic acid(9CI) (7), quercetin-3-O-rutinoside (8), apigenin (9), cAMP (10),benzoic acid (11), 1,2,4-benzenetriol (12), 4-hydroxybenzoic acid (13), salicylic acid (14), 3,4-dihydroxybenzoic acid (15),p-hydroxybenzaldehyde (16),cis-p-hydroxycinnamic acid (17),andtrans-p-hydroxycinnamic acid (18). The retention times of the compounds are listed in Fig. 2.
3.3 Quantification and HCA
3.3.1 Quantification of the 18 compounds
The established HPLC method was subsequently applied to a simultaneous determination of the 18 markers in 28 jujube extracts which collected from different provinces in China. The results (Table 4)show that the total content of these investigated compounds reached as high as 888.41 μg/g in the EtOH-extract of Muzao cultivated in Jiaxian, Shaanxi. However, there was only 471.92 μg/g in the EtOH-extract of Hetianyuzao, cultivated in Hetian in Xinjiang. The data showed that the content of all compounds varied significantly among the different provinces, ranged from 471.92 μg/g to 888.41 μg/g(Shaanxi). Remarkable differences were also observed in the individual compounds determined in the experiments. For example, compounds 3-O-trans-p-coumaroyl alphitolic acid (analytes 1) and 3-O-cis-pcoumaroyl alphitolic acid (analytes 2) could not be detected in many samples. Even though they were found to be contained in some samples, analytes 1 content is very little (the highest is 2.86 μg/g).For 4-hydroxybenzoic acid (analyte 13), the content was 263.81 μg/g in the H2O-extract of Dongzao (Zhanhua, Shandong), while only 32.85 μg/g in the EtOH-extract of Hetianyuzao (Hetian, Xinjiang). For cAMP (analyte 10), the highest content was 366.54 μg/g in the EtOH-extract of Muzao (Jiaxian, Shannxi), whereas the lowest content was 56.04 μg/g in the H2O-extract of Hetianyuzao (Hetian, Xinjiang).3-O-trans-p-coumaroyl alphitolic acid (analyte 1), 3-β-O-trans-pcoumaroyl maslinic acid (analyte 3) and 7(E)-9-keto-hexadec-7-enoic acid (analyte 6) were found in the EtOH-extract samples of different jujube fruit but could not be detected in the H2O-extract samples.
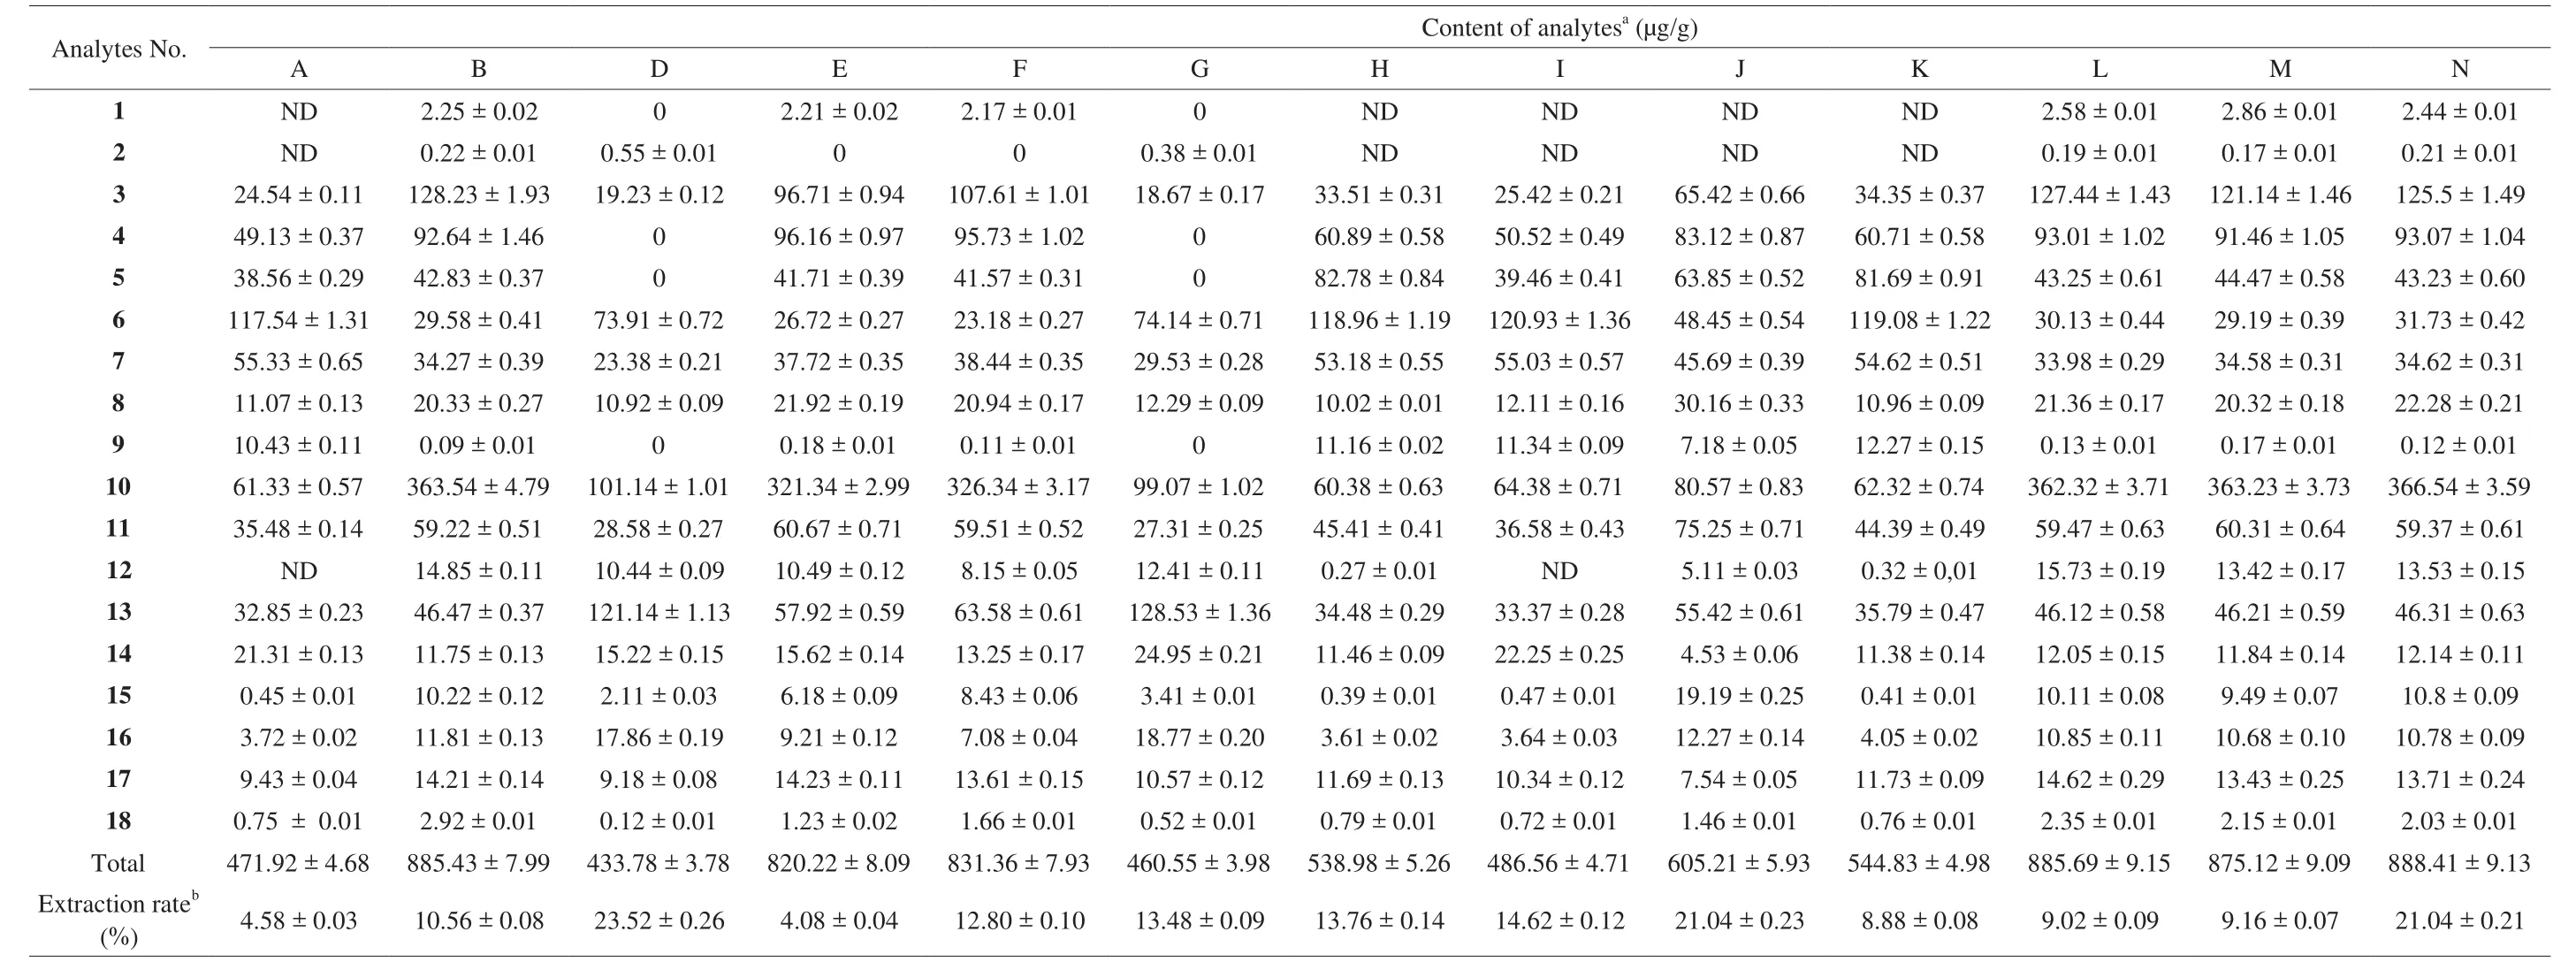
Table 4Contents of 18 compounds in Z. jujuba fruits from EtOH-extracts (n =3).
As shown in Table 5,Z. jujubawas rich in acids including phenolic acids (analytes 13–15, 17, 18) and aliphatic acids (analytes 4–5, 7). 9(E)-11-oxo-9-octadecenoic acid (analyte 7) was the richest among 4 aliphatic acids and its average content was 163.09 μg/g(H2O-extracts) and 46.84 μg/g (EtOH-extracts). The highest content of 9(E)-11-oxo-9-octadecenoic acid (analyte 7) was 204.79 μg/g in the H2O-extract of Goutouzao (Yanan, Shaanxi), whereas the lowest content was 23.38 μg/g in the EtOH-extract of Jixinzao(Yuncheng, Shanxi). For 5 phenolic acids (analytes 13–15, 17, 18),4-hydroxybenzoic acid (analyte 13) was the highest and its average content was 128.77 μg/g (H2O-extracts) and 57.54 μg/g (EtOH-extracts). The content oftrans-p-hydroxycinnamic acid (analyte 18)was the poorest among 5 phenolic acids and its average amount were only 2.22 μg/g (H2O-extracts) and 1.35 μg/g (EtOH-extracts), respectively.Compared with acids, the content of flavonoids (analytes 8, 9)and diterpenoids (analytes 1–3) was not abundant. The results showed that the content of the total flavonoids in all samples were 313.37 μg/g in the EtOH-extracts while 17.38 μg/g in the H2O-extracts. For the 3 diterpenoids, 3-O-trans-p-coumaroyl alphitolic acid (analytes 1) and 3-O-cis-p-coumaroyl alphitolic acid (analytes 2)were the lowest constitutes, with mean contents of 1.04 μg/g and 0.12 μg/g in the EtOH-extracts, respectively.

Table 5Contents of 18 compounds in Z. jujuba fruits from H2O-extracts (n =3).
3.3.2 HCA
HCA was performed based on the contents of the 18 components,and a correct classification result was obtained. The dendrogram of the HCA is shown in Fig. 3. From the top to the bottom of the dendrogram,all of theZ. jujubasamples were distinctly clustered into 4 main groups. The first cluster consists of B1, E1, F1, L1–N1(H2O-extracts in Shannxi) and D1, G1(H2O-extracts in Shanxi), the second group consists of A, H, I, K (EtOH-extracts in Xinjiang), the third cluster consists of C, C1, J, J1(Shandong), D, G (EtOH-extracts in Shanxi) and A1, H1, I1, K1(H2O-extracts in Xinjiang), and the last groups consist of B, E, F, L-N (EtOH-extracts in Shaanxi). From the results, we can conclude that the HCA based on the contents of the 18 components could serve as useful methods for the identification and classification ofZ. jujubasamples from different regions in China.
Additionally, the content variation of these compounds in each group can be clearly illustrated by the HCA heatmap. It was observed that EtOH-extracts and H2O-extracts showed an entirely different color row in the heatmap, indicating extremely larger differences,which could be a method for the classification of the differentZ. jujubaextracts samples. There is a remarkable color variation of the ‘compound 7’ column and the ‘compound 13’ column.This may imply that the content of these two compounds changed mostly among the different regions ofZ. jujuba, which could be the potential chemical markers for the classification and quality control ofZ. jujubasamples.
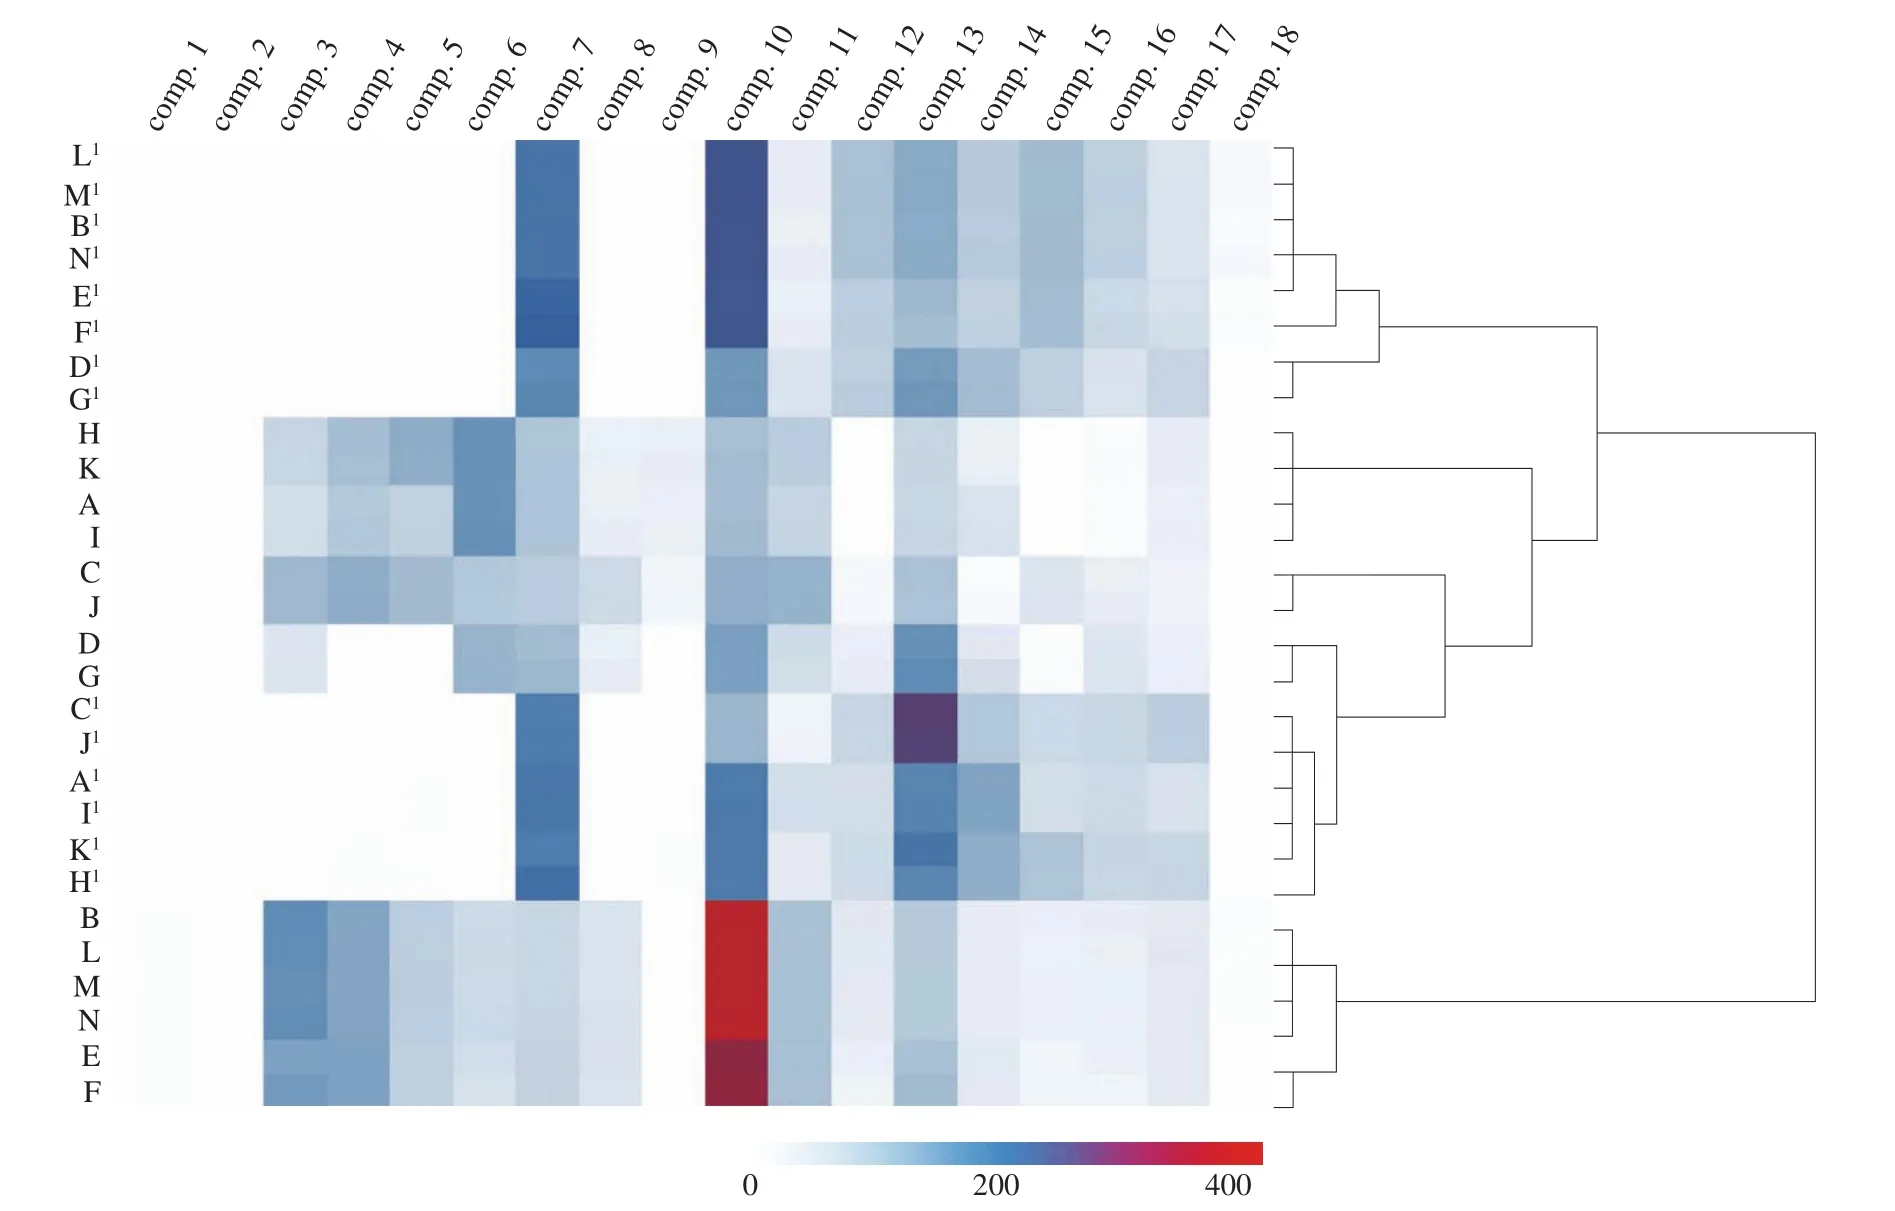
Fig. 3 Dendrogram and heatmap of HCA of 28 Z. jujuba samples. The red color corresponds to a higher concentration, while the blue color corresponds to a lower concentration, and the white color represents trace concentrations.
3.4 Hepatic cytoprotective effect of compounds 1–18 from jujube
Hepatic cytoprotective effect was evaluated by LDH release assay. CCl4, a potent hepatotoxic compound, was used to induce human liver carcinoma HepG2 cells injured model. As shown in Fig. 4,1% CCl4induced significant cytotoxicity in HepG2 cells, LDH release was reach to about 60 mU/mL, compounds 1–12 and 16–18 from jujube moderately reduced the release of LDH, while compounds 6 and 7 could significantly reduce compared with others. Thus, most compounds from jujube attenuated CCl4-induced cytotoxicity, which suggested these constituents had hepatic cytoprotective effect. Among them, compound 7 possessed significant ability in reducing LDH release, whereas compound 13 did not show any inhibitory activity on LDH release. Combined with the results of HCA, we could infer that compounds 7 and 13 were not only bioactive markers but also phytochemical markers for the classification ofZ. jujubafruits.
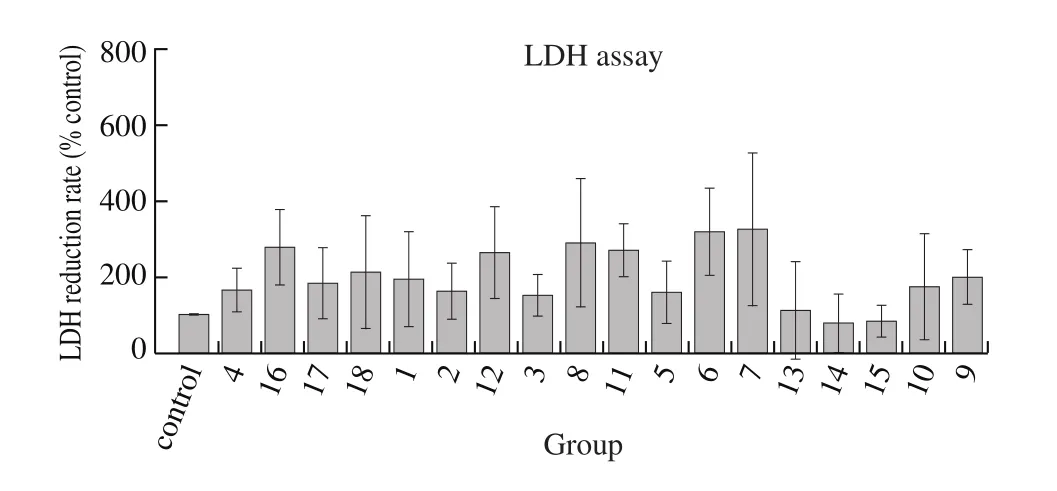
Fig. 4 Hepatic cytoprotective effect of compounds from Z. jujuba. HepG2cells were pretreated with 1% CCl4 and treated again with 50 μg/mL of different compounds for 24 h. Samples were read at absorbance OD490 nm and calculated LDH release.
4. Conclusion
In summary, an easy and quick method was first established to identify and detect 18 phytochemical constituents in 28Z. jujubasamples, comprised of 12 cultivars from different regions in China. The results show that the proposed method can successfully differentiate theZ. jujubasamples from different regions and the contents of different active substance were varied among cultivars and extraction methods used. Additionally, this validated method can serve as a prerequisite for quality control and standardization of jujube products with regard to benefit for human health.
Conflicts of interests
The authors declare no competing interest.
Acknowledgment
This study was supported by a grant from Desert Control Research Institute of Shaanxi Province (No. 203130012) and National Natural Science Foundation of China (No. 31570348).
Appendix A. Supplementary data
Supplementary data associated with this article can be found, in the online version, at http://doi.org/10.1016/j.fshw.2022.03.003.
- 食品科学与人类健康(英文)的其它文章
- Pomegranate peel polyphenols alleviate insulin resistance through the promotion of insulin signaling pathway in skeletal muscle of metabolic syndrome rats
- Sucrose-free hawthorn leathers formulated with fructooligosaccharides and xylooligosaccharides ameliorate high-fat diet induced inflammation,glucose and lipid metabolism in liver of mice
- Roles of Adinandra nitida (Theaceae) and camellianin A in HCl/ethanol-induced acute gastric ulcer in mice
- Polygonatum sibiricum polysaccharides protect against obesity and non-alcoholic fatty liver disease in rats fed a high-fat diet
- Trehalose ameliorates autophagy dysregulation in aged cortex and acts as an exercise mimetic to delay brain aging in elderly mice
- Deep eutectic solvents and alkaline extraction of protein from seabuckthorn seed meal: a comparison study

