Dietary preferences and potential ecological impact on the zooplankton community of Nemopilema nomurai based on stable isotope and fatty acid analyses*
Junjian WANG , Chaolun LI , Guang YANG , Zhencheng TAO ,Yanqing WANG , Haochen XIAN
1 Key Laboratory of Marine Ecology and Environmental Sciences, Institute of Oceanology, Chinese Academy of Sciences,Qingdao 266071, China
2 Laboratory for Marine Ecology and Environmental Science, Pilot National Laboratory for Marine Science and Technology(Qingdao), Qingdao 266237, China
3 North China Sea Marine Forecasting Center of State Oceanic Administration, Qingdao 266100, China
4 Center for Ocean Mega-Science, Chinese Academy of Sciences, Qingdao 266071, China
5 University of Chinese Academy of Sciences, Beijing 100049, China
6 Department of Engineering and Technology Institute of Oceanology, Chinese Academy of Sciences, Qingdao 266071, China
Abstract Information on the dietary composition and food preferences of the giant jellyfish Nemopilema nomurai is important for understanding the trophic drivers of jellyfish outbreaks and their ecological consequences. We used fatty acid (FA) and stable isotope (SI) biomarkers to analyze the diet of N. nomurai from the Yellow Sea in August 2016. N. nomurai was found at all sampling stations, with abundances ranging from 59 inds./km 2 to 1 651 inds./km 2. There were no significant differences between large (>80 cm in diameter) and small (20-30 cm in diameter) medusae, either in FA compositions or in SI values, which suggests that large and small jellyfish have the same food composition and similar trophic levels. Compared to other zooplanktons, the relatively high levels of C20∶4n-6 in total FAs (~12%) indicates that organic detritus contributes considerably to the food composition of the jellyfish. The mixed model Stable Isotope Analysis in R (SIAR) revealed that N. nomurai tended to prey on smaller organisms (<1 000 μm in diameter)which comprised about 70% ofits diet. This means the N. nomurai blooms will put high feeding pressure on the small plankton. The similar SI values and FA composition indicates that krill may share the same food resources with N. nomurai, which suggests that the jellyfish blooms may affect krill populations as a result of food competition.
Keyword: Nemopilema nomurai; fatty acid; stable isotope; dietary preferences
1 INTRODUCTION
Blooms of the giant jellyfishNemopilemanomuraihave occurred frequently in the Yellow Sea since 2000 (Zhang et al., 2012; Uye, 2014; Yoon et al.,2014; Sun et al., 2015). During late summer, the biomass ofN.nomuraiin the Yellow Sea can reach millions of tons (Sun et al., 2015). Explosive blooms ofN.nomuraican disrupt the fish-dominated trophic structure, transforming it into one dominated by jellyfish (Kawahara et al., 2006; Uye, 2008, 2011,2014). Fisheries may also be threatened (Ding and Cheng, 2005; Wu et al., 2008; Zhang et al., 2012)
The metephyrae ofN.nomuraican be found every spring in the Yellow Sea. Before blooming in late summer,N.nomuraineeds abundant food to support rapid growth. Thus, sufficient food would provide the energy base for blooming. Various micro- and mesozooplankton, such as bacteria, ciliates, copepods, fish eggs, and juvenile fish, may be food sources forN.nomurai(Uye, 2008). However, specific nutrition requirements ofN.nomuraiare not well understood.Additionally, large numbers ofN.nomuraimay exert a severe grazing impact on its prey (Uye, 2014).Understanding the dietary composition ofN.nomuraiunder natural conditions is essential to revealing the nutritional drivers and ecological consequences ofits blooms.
Nemopilemanomuraiis a species of Rhizostomeae jellyfish. Unlike the other common Scyphozoa jellyfish, the central mouth ofN.nomuraicloses when an ephyra becomes medusae. The terminal pore located on its oral arm then becomes its main feeding organ. WhileN.nomuraiis usually unable to consume zooplankton larger than its terminal pore (Lee et al.,2008), Pitt et al. (2009) indicated that large zooplankton might also be a major food source for Rhizostomeae medusae. The typical prey size ofN.nomurairemains to be verified. Moreover, the shapes ofits potential food sources (e.g., cylindric copepods and spherical fish eggs) differ, which may affect the consumption. Therefore, the dietary composition ofN.nomuraiunder natural conditions shall be further investigated.
Compared with the other jellyfish,N.nomuraiis relatively large. The bell diameter may reach 2 m and the wet weight up to 200 kg (Omori and Kitamura,2004). The large size and fragile body ofN.nomuraimake capture and cultivation difficult, thus culture experiments for studying feeding mechanisms are not practical for this species. Gut content analyses is well used in research of diet of jellyfish. For example, gut content analyses revealed thatAureliaauritaconsumed mainly copepods predator (Ishii and Tanaka, 2001; Lo and Chen, 2008);Aureliasolidafed on Calanoid copepods, mollusc larvae, and larvaceans(Gueroun et al., 2020);Pelagianoctilucaate fish eggs and larvae (Tilves et al., 2016). Uye (2008)summarized that among the food spectra ofN.nomurai, most consisted of micro- and mesozooplankton. However, some issues remain. For examples, food intensive effects during sample collection may affect the results, and food quantity cannot be measured.
Biomarker methods based on stable isotopes and fatty acids (FAs) may be beneficial for studies on the diet ofN.nomurai. In predators, heavier stable isotopes may be accumulated more than lighter ones,making stable isotopes such as13C/12C and15N/14N effective tools for understanding the food sources and trophic positions of organisms in the food web (Post,2002). FA biomarkers may also be useful for studying the dietary characteristics of consumers because certain FAs in consumers can stay unchanged or change in specific ways (Pitt et al., 2009). Compared with gut content analyses, they are advantageous for quantifying food composition and imparting information on the long-term diet of the consumer(Kling et al., 1992; Cabana and Rasmussen, 1996;Teuber et al., 2014; Henschke et al., 2015; Yang et al.,2016). These methods have been used to investigate the diets of creatures in the marine food web (El-Sabaawi et al., 2009; Allan et al., 2010; Connelly et al., 2014; Wang et al., 2015). In recent years, stable isotope and FA biomarkers have been used successfully in studies on the dietary features of jellyfish. Using these markers, it was found that the trophic niche ofPelagianoctilucaoverlapped highly with fish larvae (Tilves et al., 2018), and microzooplankton were important prey of this jellyfish (Milisenda et al., 2018). FA biomarkers showed that the availability of living plankton or suspended detritus could affect the diet ofP.noctiluca(Milisenda et al., 2018). Cui et al. (2012) found that zooplankton were important in the diets of large jellyfish in the Yellow Sea. These methods are feasible for diet study ofN.nomurai.
To clarify the information on the long-term diet ofN.nomuraiis helpful to study the relationship betweenN.nomuraiand zooplanktons. Because of the special feeding organ ofN.nomurai, we hypothesized that small creatures or organic matter contributed more to the food ofN.nomuraithan the large ones. To prove this hypothesis, we investigated the FAs and two stable isotopes (13C and15N) ofN.nomuraicollected in August 2016, then analyzed the dietary composition ofN.nomurai. The impact ofN.nomuraion the zooplankton community was also evaluated.
2 MATERIAL AND METHOD
2.1 Sample collection
During a survey conducted in the Yellow Sea(122°E-127°E, 30°N-38°N) from the research vessel(R/V)Beidouin August 2016, samples ofN.nomurai,zooplankton, and particulate organic matter (POM)were taken at 11 stations (Fig.1). To collectN.nomuraisamples, bottom trawl nets (length 83.2 m, open circumference 167.2 m, height 7 m, width 22 m, and mesh size 20 cm) were deployed at each station.Because gelatinous zooplankton are usually broken during towing of the trawl net, we kept the towing speed below 3 kt to avoid sample loss. The towing time was 1 h. Subsequently,N.nomuraimeasuring either >80 cm or 20-30 cm in diameter were selected to test for differences in dietary composition between large and small individuals. LargeN.nomurai(LNN)was used to refer to specimens >80 cm in diameter,whereas smallN.nomurai(SNN) to those 20-30-cm diameter. Parts of the umbrella ofN.nomuraiwere cut and rinsed carefully with distilled water. Samples were then stored in liquid nitrogen for isotope and FA analyses. Zooplankton larger than 505 μm were collected using a maxi-zooplankton net (mesh size 505 μm; diameter 50 cm), while zooplankton with size 160-505 μm were collected with a midizooplankton net (mesh size 160 μm; diameter 31.6 cm) (Sun et al., 2010). At each station, duplicate hauls were taken. The first was preserved in a 5%solution of buffered formalin for later counting in the laboratory. The second was picked alive and sorted to the species level under a stereomicroscope. The samples were then rinsed with filtered seawater and distilled water in turn, concentrated on GF/F Whatman filters (diameter=25 mm), and immediately frozen in liquid nitrogen for further FA and stable isotope analyses. Water samples (50 L) were collected to gather POM. After prescreening through a 200-μm sieve to remove large species, POM samples were also filtered onto GF/F filters.
2.2 Laboratory analyses
The calculation ofN.nomuraiabundance followed that of Zhang et al. (2012). The following equations were used:


whereAisN.nomuraiabundance (inds./km2);nis the number ofN.nomuraiin one catch; andlis the integral distance of a trawl (km), read from a Simrad EK500 echo sounder integral system. The second formula was determined by Tang et al. (2006), wheredis the average water depth (m) at each station.
Zooplankton samples were counted under a stereomicroscope. The dominance index (Y) was used to identify dominant species (Odum, 1959). The formula was as follows:

whereniis the species abundance,Nis the total abundance of all zooplankton species, andfiis the occurring frequency of species at all stations.Y>0.02 indicated that the species was dominant (Odum,1959).
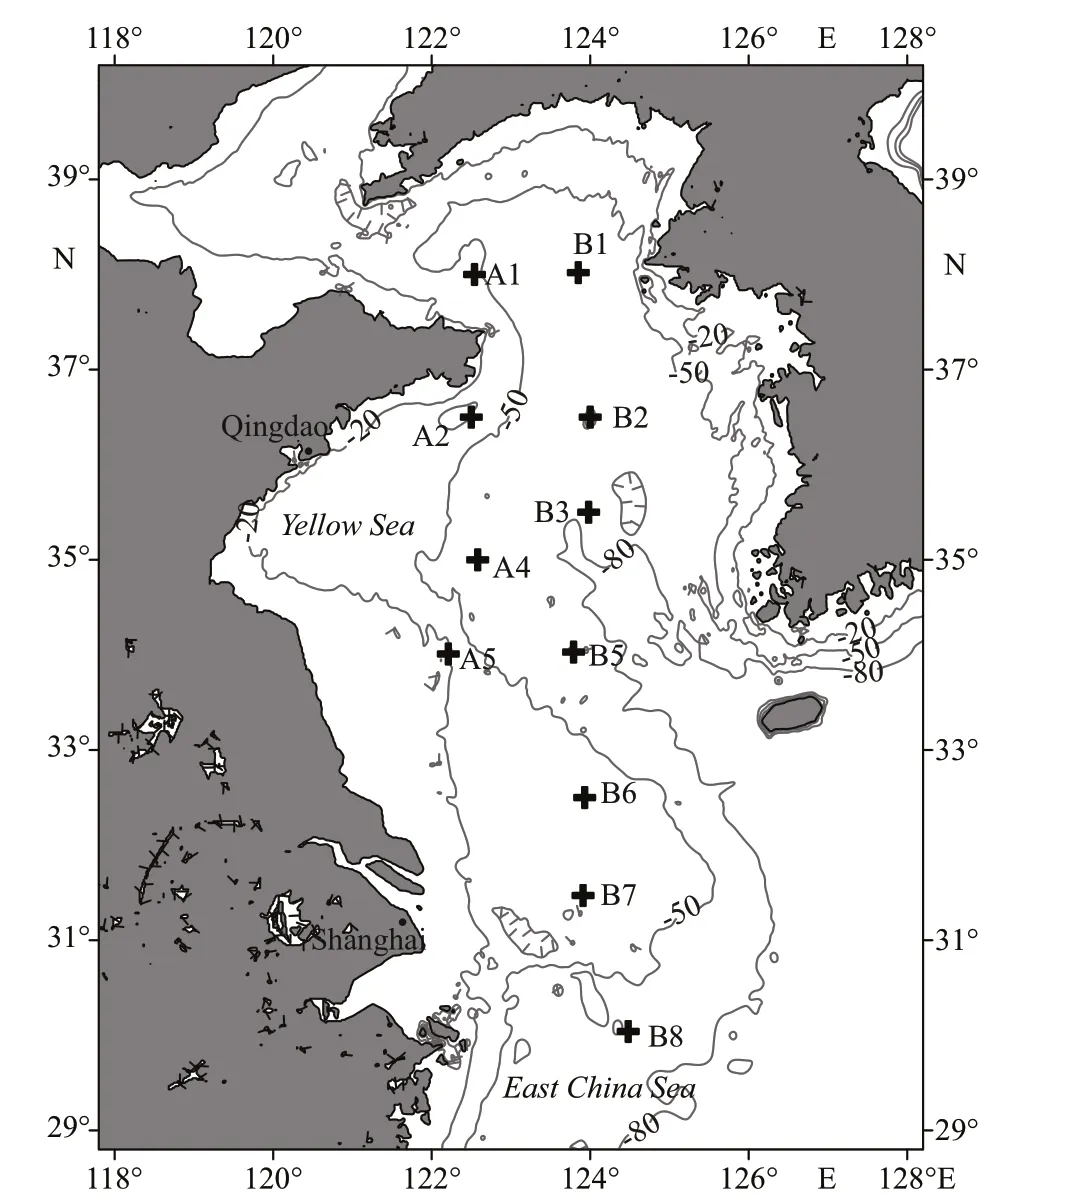
Fig.1 Location of the sampling stations
The biovolume of zooplankton was quantified using the semi-automatic ZooScan system (Hydroptic,France). Zooplankton samples were scanned and digitized at a resolution of 2 400 dpi. The major and minor axes of each object were then automatically identified (Grosjean et al., 2004; Gorsky et al., 2010).Zooplankton volume was equal to the ellipsoidal volume. Zooplankton biovolume (mm3/L) was calculated using the following formula:

whereBis the zooplankton biovolume (mm3/L),Vgis total volume of every organism in each size class (i.e.,200-1 000 μm, 1 000-5 000 μm, and >5 000 μm),aandbare the major and minor axes (mm) of the zooplankton individuals, respectively, andVnis the net volume.
FAs were extracted from the samples following the methods previously described by Folch et al. (1957),Kattner and Frickle (1986), and El-Sabaawi et al.(2009). After freeze-drying all the frozen sample, 1.5-2.0 mg of each sample was preserved for the stable isotope analysis. Twenty mg of jellyfish samples and 5 mg of zooplankton and POM samples were weighed out for FAs analyses. Then, the C19∶0 saturated FAs were added to the samples as an internal standard.Afterwards, the sample was sonicated and centrifuged(2 400 r/min) in a mixture of chloroform, methanol,and water (ratio 8∶4∶3) three times to pool the lipid to the organic layers. The layers were extracted and mixed with 0.2-mL methanol containing 3% sulfuric acid at 80 °C in a water bath for 4 h. The FAs methyl esters (FAMEs) were then prepared. After cooling,hexane was added to extract the FAMEs. An Agilent 7890A gas chromatograph (Agilent Technologies,Inc., Santa Clara, CA, USA) was used to quantify the FAs. FAs were identified by gas chromatography-mass spectrometry (GC/MS). According to the internal standard method, FAs were calculated quantitatively.The FAs were then expressed as the % of total FAs.
To assess the degree of similarity between FA samples, a cluster analysis was conducted using the PRIMER statistical package after converting the data into similarity triangular matrices with a Bray-Curtis resemblance measure (Bray and Curtis, 1957).
Stable isotopes were determined using a Thermo Delta IV isotope ratio mass spectrometer (Thermo Fisher Scientific, Inc., Bremen, Germany). Stable isotopic values were expressed in the conventional δ notation and calculated using the following equations:

The standard reference materials were Pee Dee Belemnite (PDB) and atmospheric N2, respectively.
Lipids were not removed prior to stable isotope analysis (Schukat et al., 2014). Because δ13C values may be affected by lipid content leading to a depleted δ13C result (DeNiro and Epstein, 1978; Post, 2007),the lipid correction model for aquatic invertebrates described in Logan et al. (2008) was used. The model was as follows:
δ13Ccorrected=δ13Craw+3.388-((3.388×3.314)/C∶N).
The mixed model Stable Isotope Analysis in R(SIAR) of Parnell et al. (2010) was used to calculate the contribution of different sources to the diet ofN.nomurai. To reduce the number of sources substituted into the model and avoid deviation caused by some low-abundance foods, four particle-size groups—i.e., <200 μm (small organisms), 200-1 000 μm (small copepods), 1 000-5 000 μm (large copepods), and >5 000 μm (giant crustaceans)—were defined according to Sun et al. (2010) and Li et al.(2013) prior to analyses. POM,Oithonasimilis,Calanussinicus, andEuphausiapacificawere selected as representative sources of the small organism, small copepod, large copepod, and giant crustacean size groups, respectively. The latter three species were chosen because they were the most abundant species in each group. The trophic enrichment factors used were 0.4‰±1.3‰ (for δ13C)and 3.4‰±1.0‰ (for δ15N) (Post, 2002).
Statistical analyses were conducted using Microsoft Excel 2016 and SPSS 15.0. Primer 6.0 was used to execute the cluster analysis. The isotope mixing models in SIAR package were used to evaluate the contribution of sources.
3 RESULT
3.1 Distribution of N. nomurai and zooplankton in the Yellow Sea
Nemopilemanomuraiwas found at all sampling stations, with abundances ranging from 59.23 to 1 651.21 inds./km2(Fig.2). The highest and lowest abundances were found at stations A5 and B8,respectively. The average abundance was 401.01 inds./km2. The biovolume of zooplankton varied from 0.38 to 68.59 mm3/L (Fig.2). A negative correlation was found betweenN.nomuraiand the biovolume of zooplankton (RELATE,R=-0.24,P<0.05).
Twenty-six species of zooplankton adults and ten species of zooplankton larvae were identified.O.similisandC.sinicuswere the dominant species in the study area (Y=0.22 andY=0.02, respectively).O.similiswas the largest contributor to the abundance of small copepods at most stations (Table 1). The average abundance ofO.similiswas 550.70 inds./m3,and its maximum abundance occurred at station A2(1 678.05 inds./m3).C.sinicuswas the main contributor to the abundance of large copepods, with an average abundance of 67.13 inds./m3. Its highest abundance of 131.79 inds./m3was found at station B2(Table 1). The most abundant giant crustacean wasE.pacifica.
3.2 FA composition of N. nomurai and zooplankton
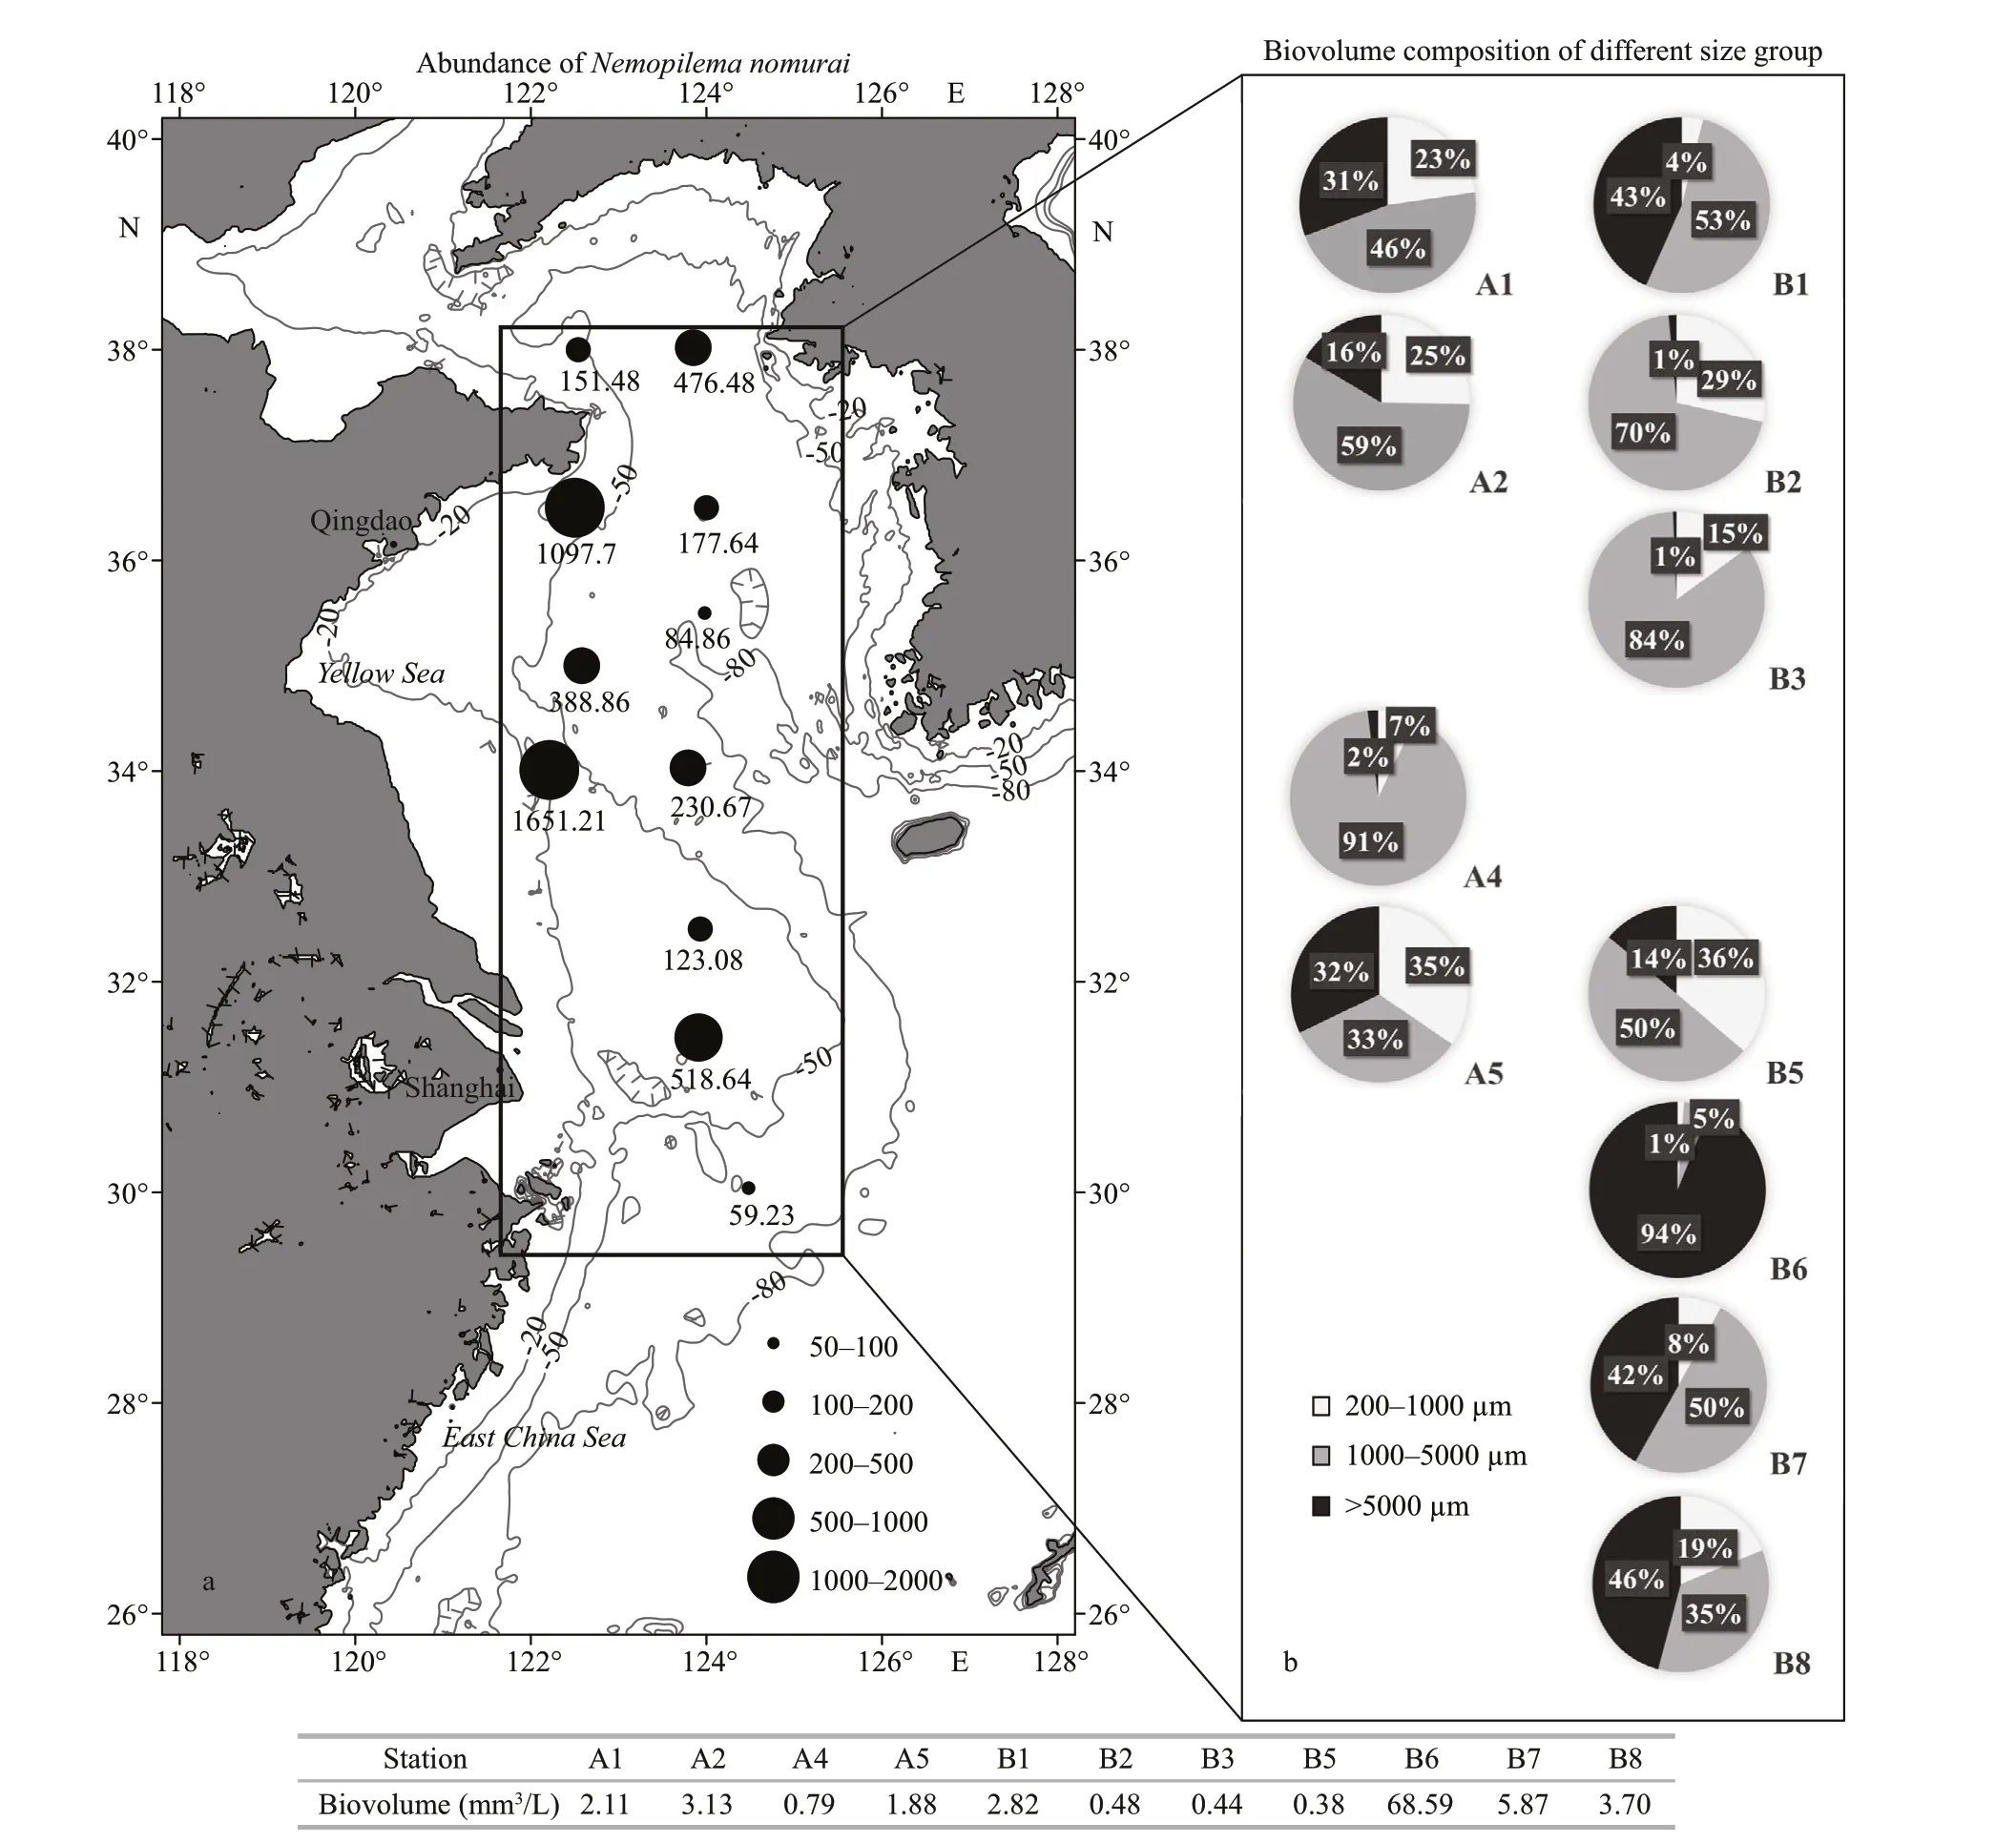
Fig.2 Abundance of N. nomurai (inds./km 2) (a) and biovolume composition of zooplankton in each size (b) in the Yellow Sea during August, 2016
The FAs in theN.nomuraisamples were mainly composed of saturated fatty acids (SFAs) and polyunsaturated fatty acids (PUFAs). These two groups contributed >94% of the total FAs (Table 2).There were no significant differences between SNN and LNN in terms of SFA or PUFA content (ANOVA,P>0.05). Eicosapentaenoic acid (EPA) (C20∶5n-3),arachidonic acid (C20∶4n-6), and docosahexaenoic acid (DHA) (C22∶6n-3) were the dominant PUFAs inN.nomurai. The average proportion of C20∶4n-6 was approximately 12% in both LNN and SNN. C20∶4n-6 could be used to detect detritus-based food sources(Dalsgaard et al., 2003). DHA (C22∶6n-3) was slightly lower than C20∶4n-6 at 11.4% and 10.4% for LNN and SNN, respectively. The FA biomarker DHA/EPA that could distinguish dinoflagellate- and diatombased diets (Budge and Parrish, 1998) was 0.54% and 0.41% in LNN and SNN, respectively (Table 2). The relative concentrations of C18∶2n-6+C18∶3n-3, which represented the contribution of terrestrial nutrition(Dalsgaard et al., 2003) were 2.95% in LNN and 2.96% in SNN. The relative concentrations of the bacterial food biomarker C15∶0+C17∶0 (Kaneda,1991) was 2.56% and 2.51% in LNN and SNN,respectively. No significant differences between LNN and SNN were found for any of the biomarkers mentioned above (ANOVA, allPvalues>0.05).
Nemopilemanomuraiand zooplankton species were separated into three groups according to cluster analysis(Fig.3): Groups A and B represented the majority of large copepods, includingC.sinicusandEuchaetaplana. Group C included LNN, SNN, and several other species. LNN and SNN sampled at the same station shared more than 90% similarity. Group C was subdivided into two smaller groups with 65% similarity:Group CI included all mysids, arrow worms, and somecopepods, and Group CII includedN.nomurai,E.pacifica, andLuciferintermedius. The Group CII could also be divided into two parts with 72% similarity.
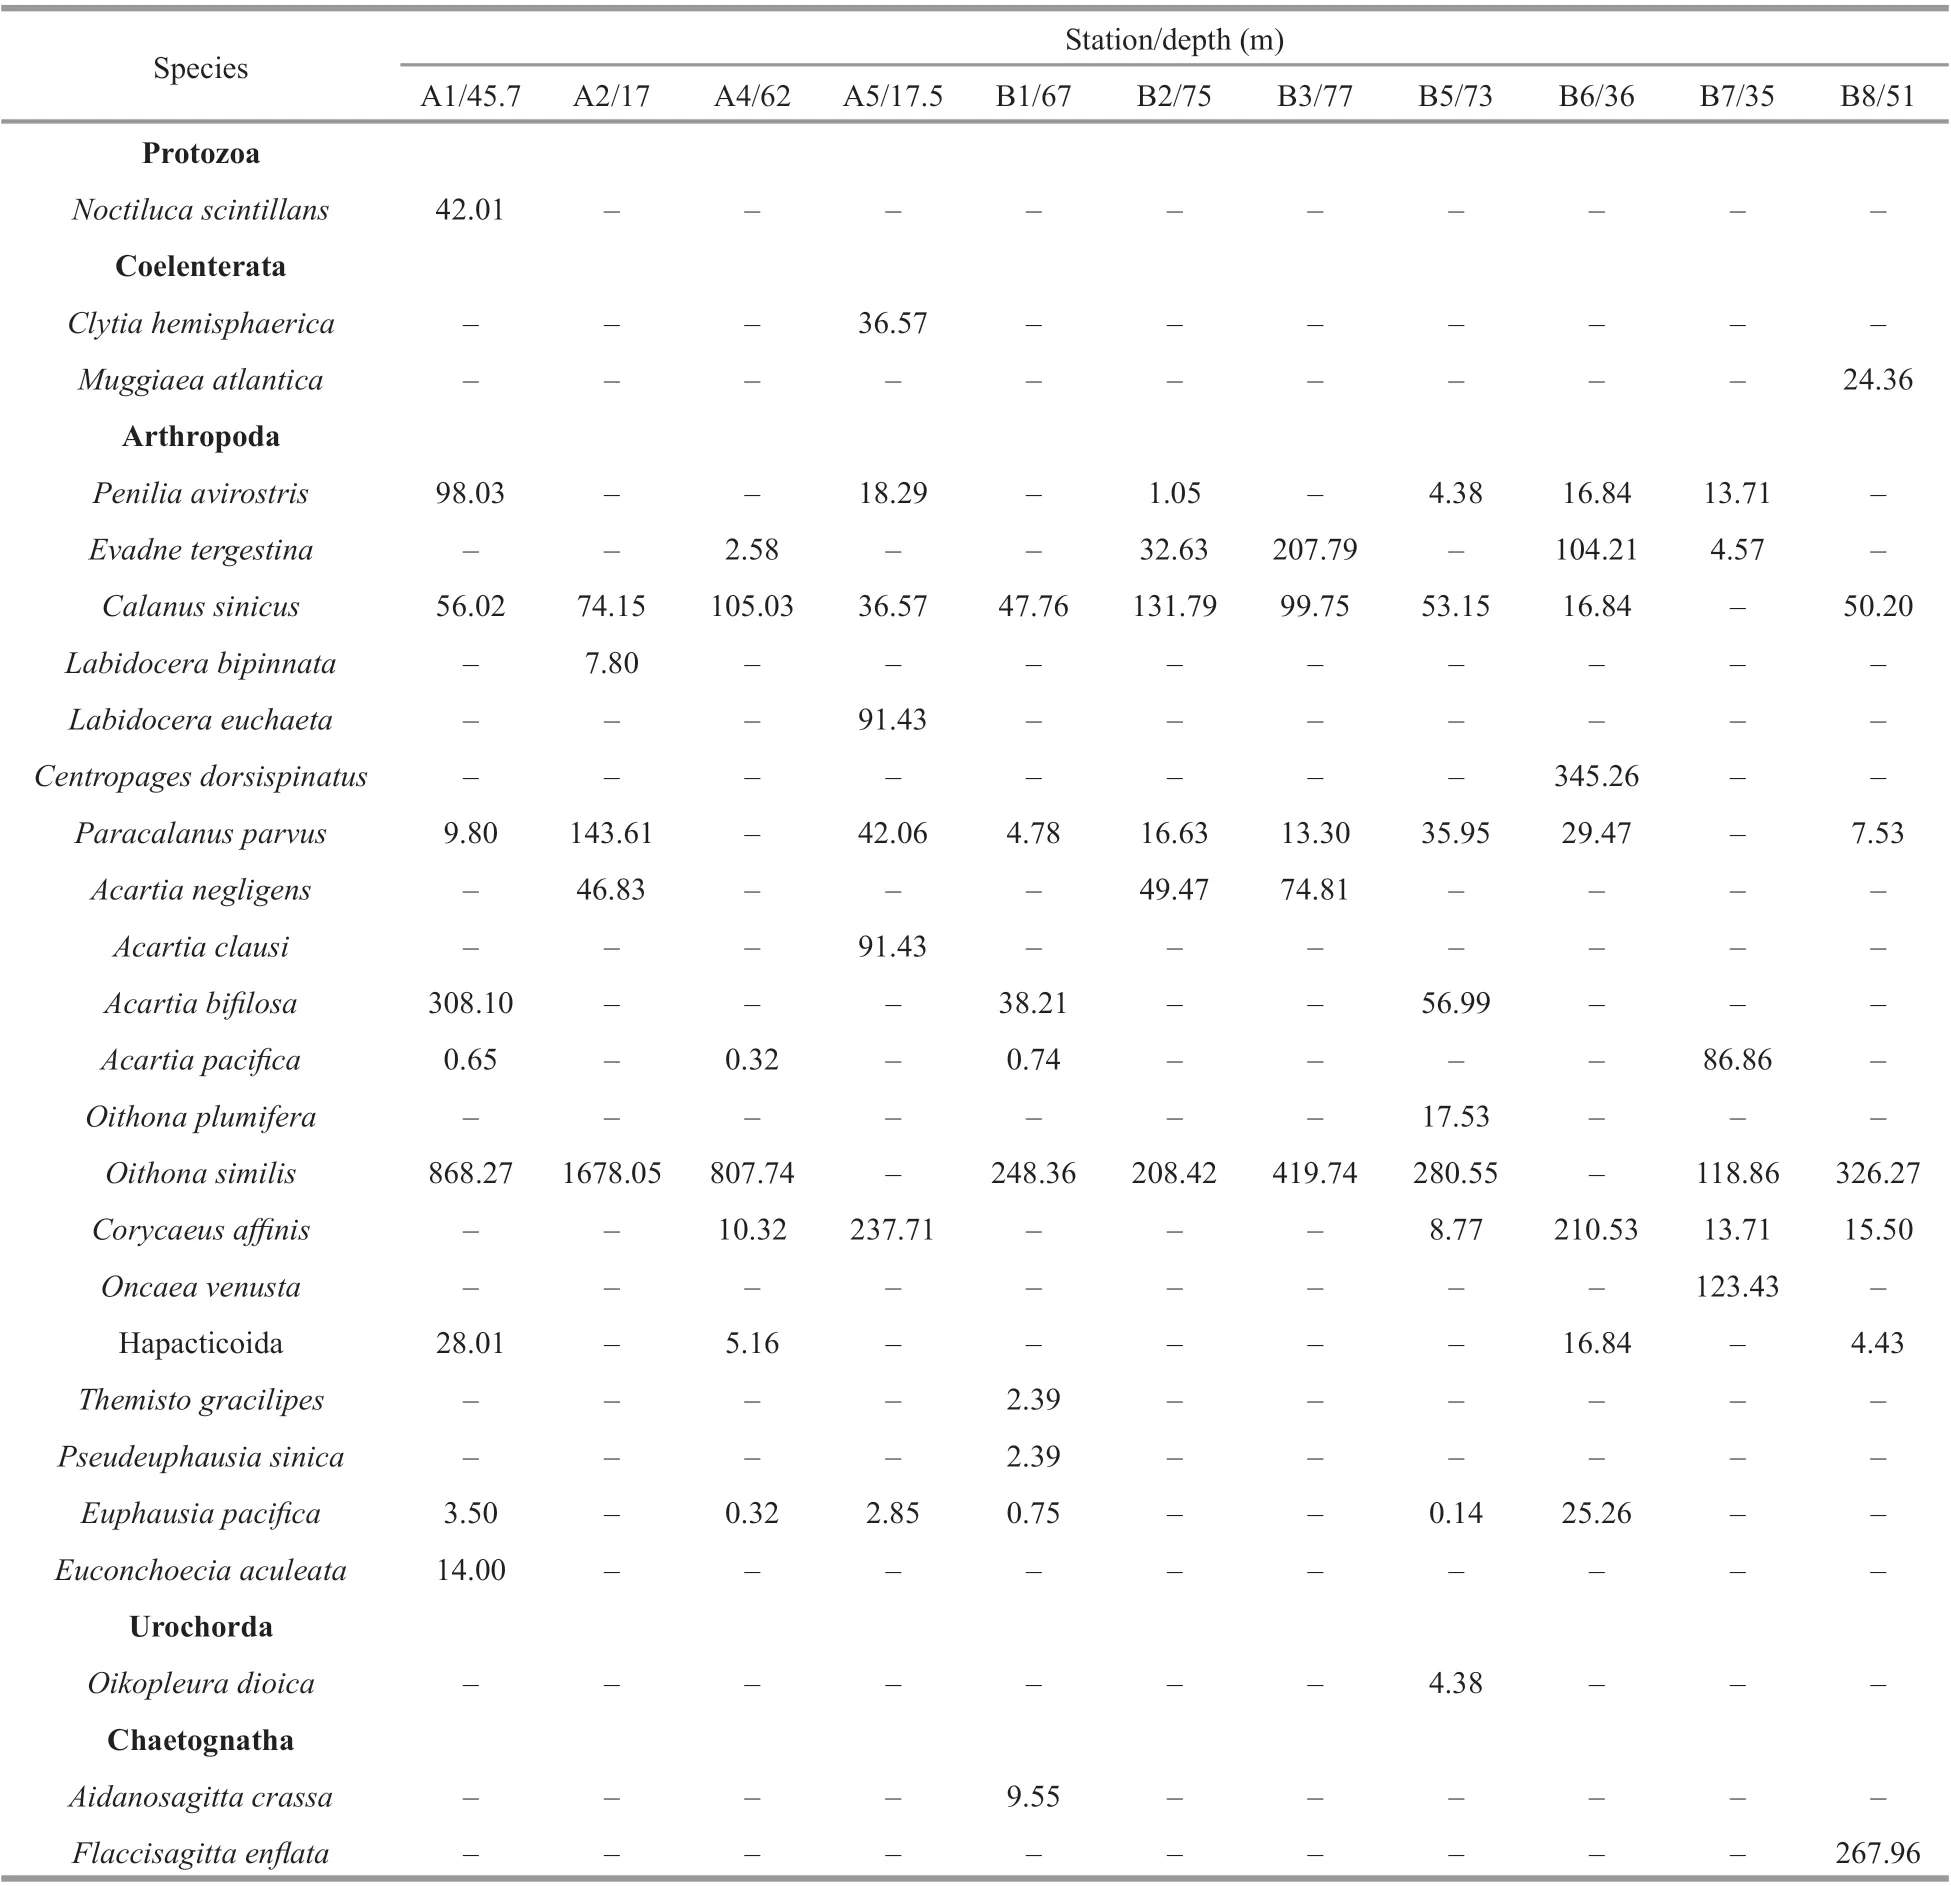
Table 1 Abundance (inds./m 3) of zooplanktons in the Yellow Sea
3.3 Stable isotopes of N. nomurai and zooplankton
The LNN and SNN were not significantly different in terms of δ13C and δ15N (ANOVA,P>0.05) (Fig.4).They shared a similar δ13C value (-19.84‰±1.4‰ for LNN and -19.91‰±1.3‰ for SNN). The trophic levels of both size classes ofN.nomuraiwere also similar, as indicated by similar δ15N values (5.82‰±1.4‰ for LNN and 5.61‰±1.0‰ for SNN).N.nomurai,O.similis, andE.pacificawere characterized by similar values of δ15N (6.74‰±1.0‰ and 6.49‰±1.0‰ forO.similisandE.pacifica, respectively).
The average δ13C of POM was -20.62‰±2.0‰.N.nomurai,O.similis,E.pacifica,C.sinicus,Themistogracilipes, and erichthus larvae had similar δ13C values to that of POM (from -21.89‰±1.3‰ to-19.47‰±0.8‰). The other zooplankton were enriched in δ13C with values ranging from-18.66‰±1.3‰ to 17.35‰±1.0‰.
The δ15N value of POM was 3.51‰±0.93‰, which was lower than that of all the zooplankton. Fish larvae had the highest δ15N value (12.72‰±0.3‰) among all the zooplankton.Zonosagittanagaewas slightly lower than fish larvae with δ15N at 11.56‰±0.6‰.Thermistogracilipes,Aidanosagittacrassa, erichthuslarvae,L.intermedius, andPseudeuphausiasinicaoccupied a similar trophic level as indicated by similar values of δ15N (range: 7.56‰ to 8.32‰) (Fig.4).
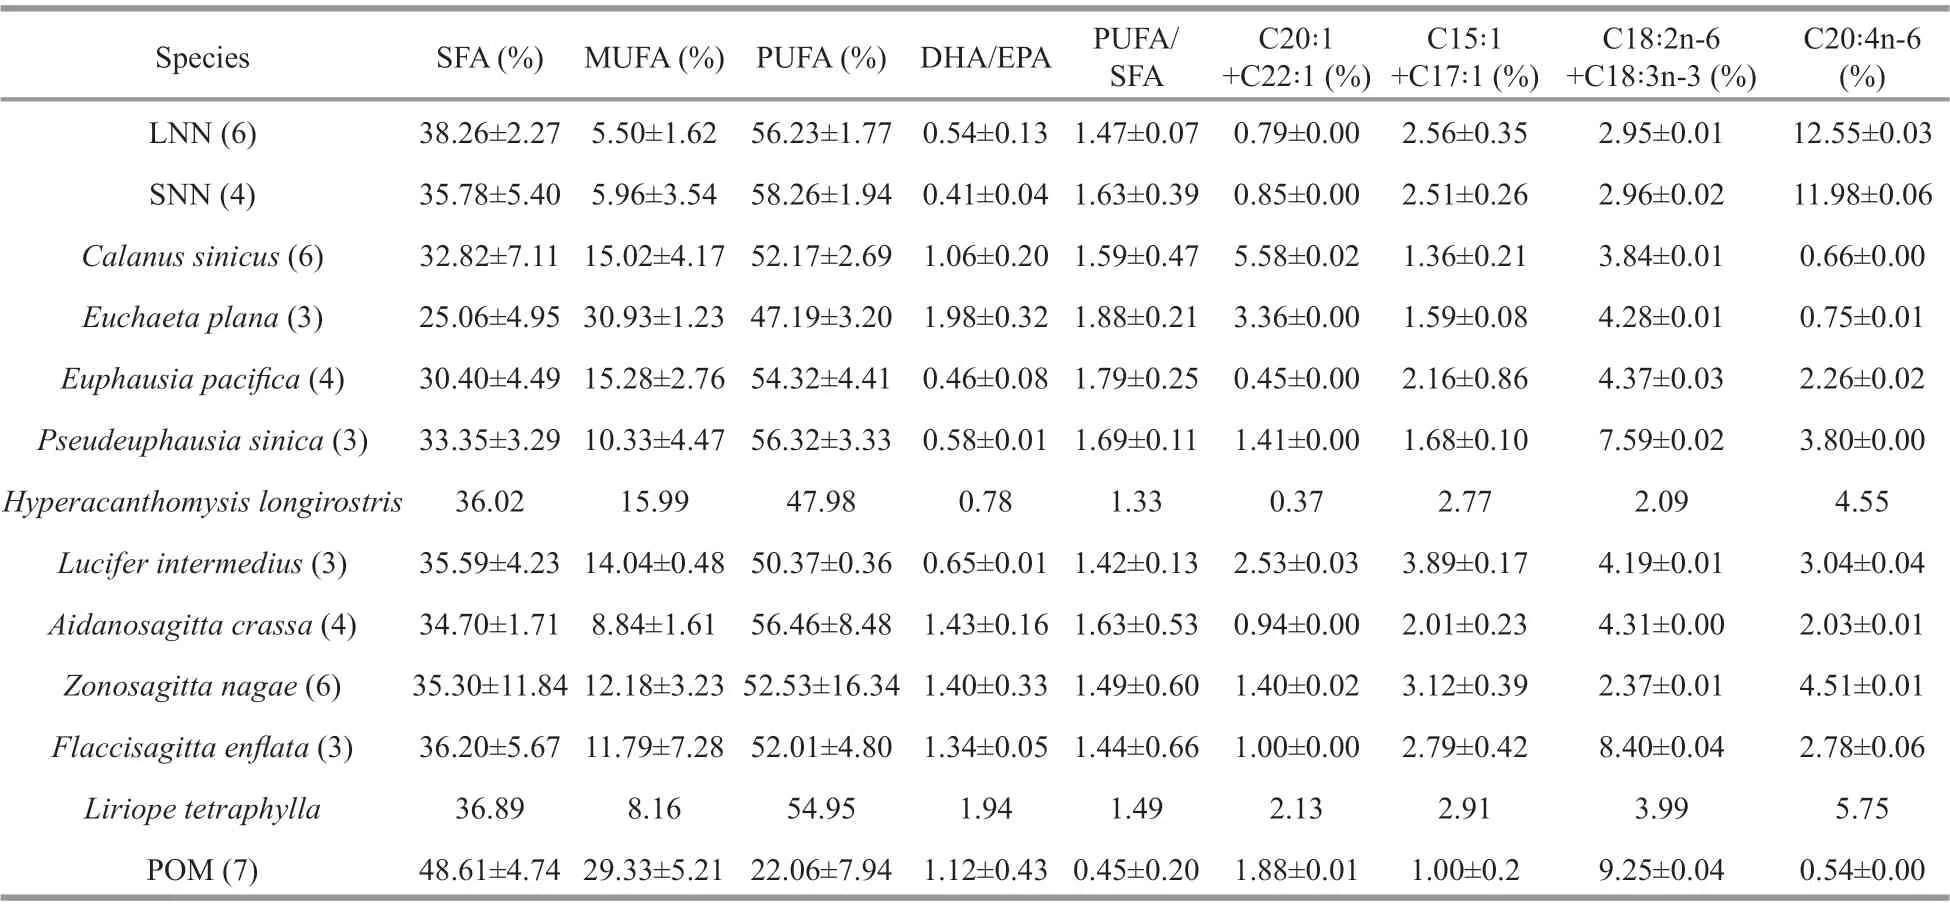
Table 2 Percentage of relative FAs concentrations and FA biomarkers in Nemopilema nomurai and zooplankton collected from the Yellow Sea during August, 2016
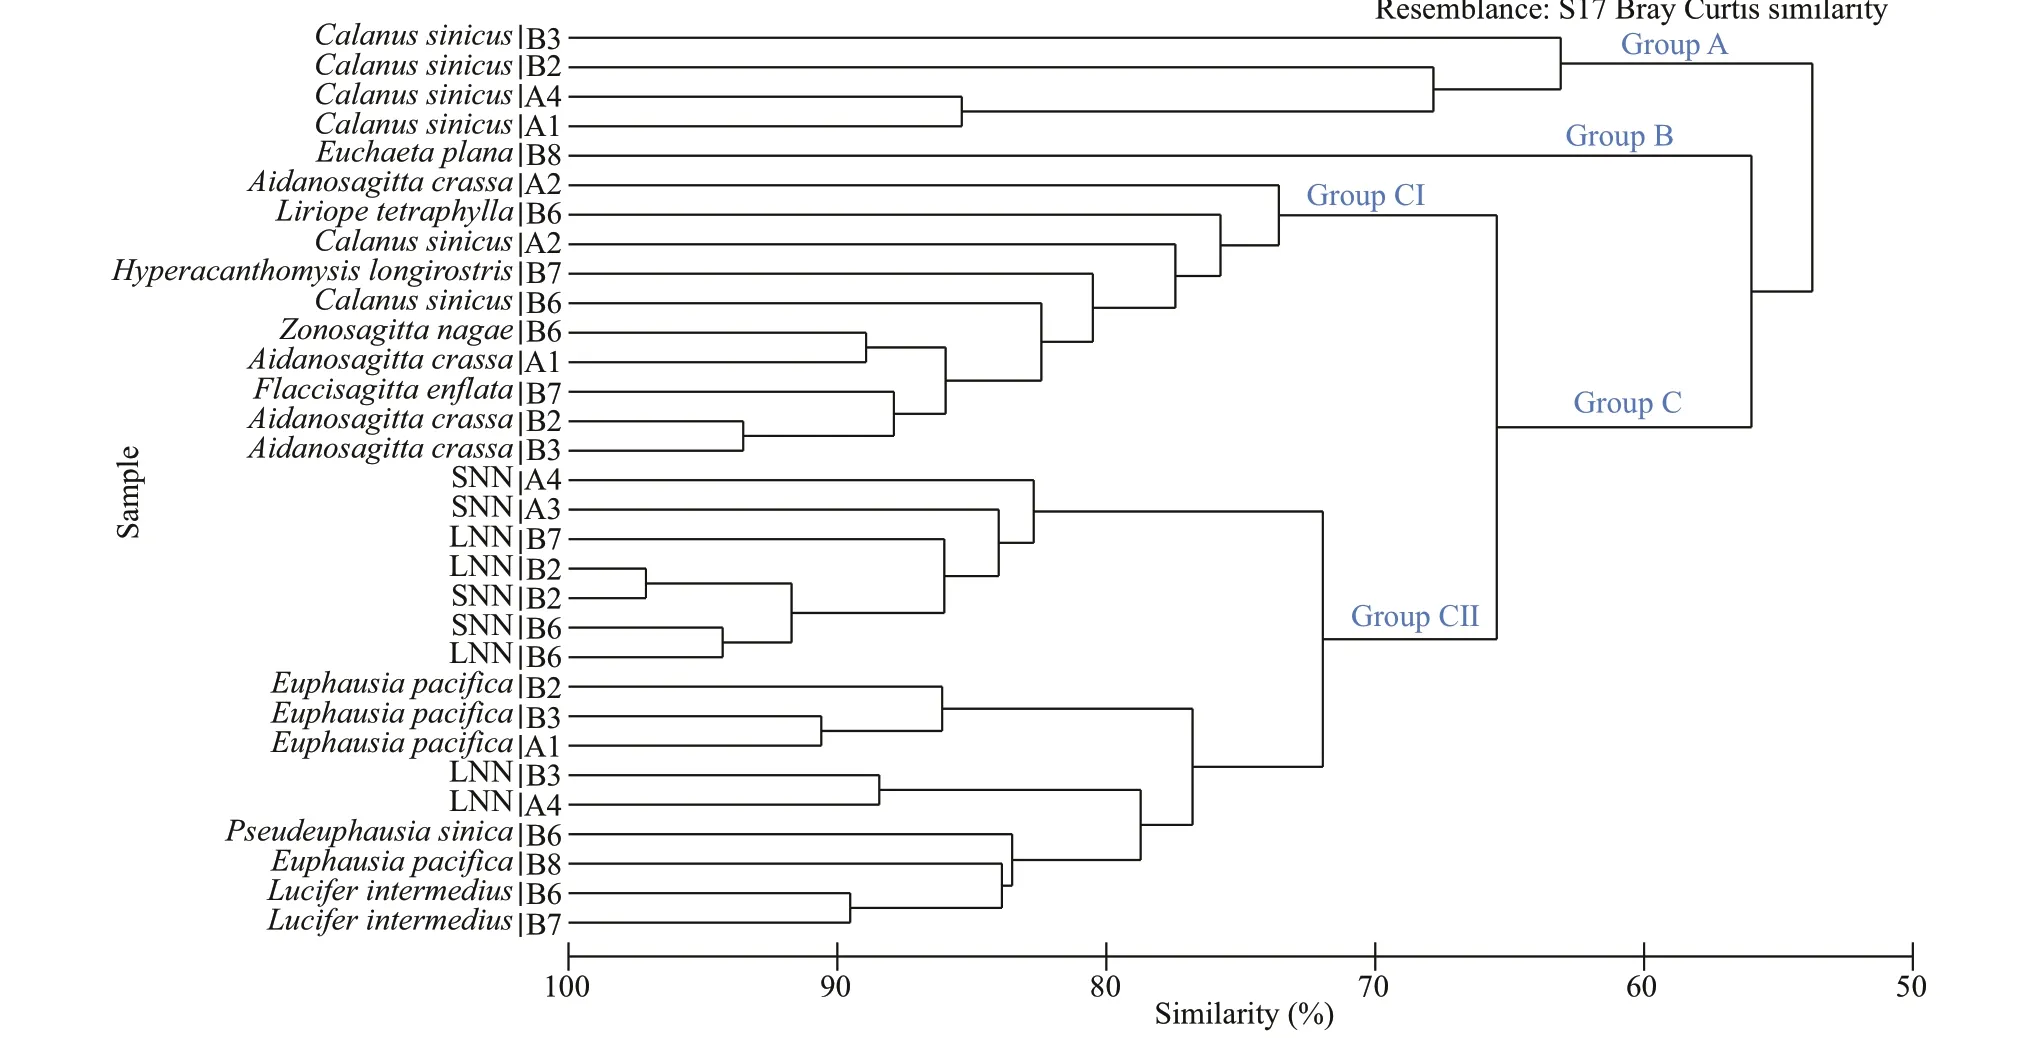
Fig.3 Average-neighbor cluster analysis based on a Bray-Curtis dissimilarity matrix of the raw FAs data of species collected in August, 2016
SIAR analysis revealed that the contribution of prey larger than 1 000 μm to the diet ofN.nomuraiwas relatively low. The relatively large zooplankton species,C.sinicusandE.pacifica, were consumed less than smaller species byN.nomurai, comprising 16% and 13% ofits diet, respectively. Instead,N.nomuraitended to consume smaller food particles and prey such as POM andO.similis, which comprised 38% and 33% of theN.nomuraidiet, respectively(Fig.5). The dietary composition of SNN was similar to that of LNN.
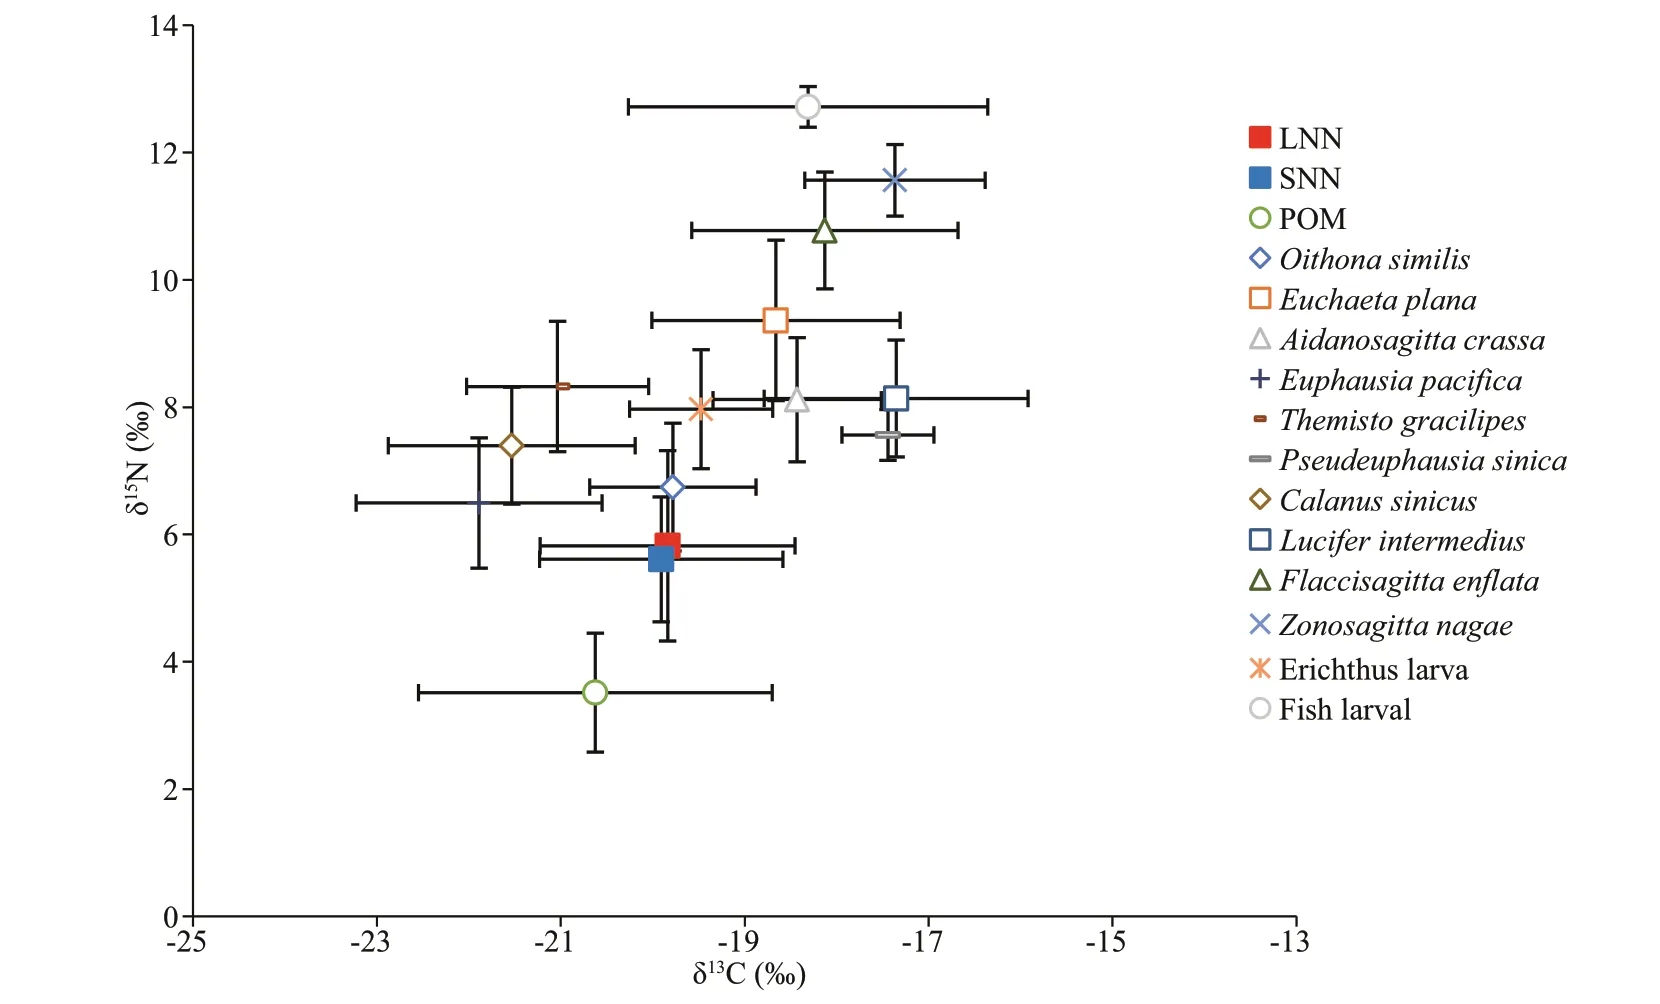
Fig.4 Stable isotope bi-plot based on species collected from the Yellow Sea
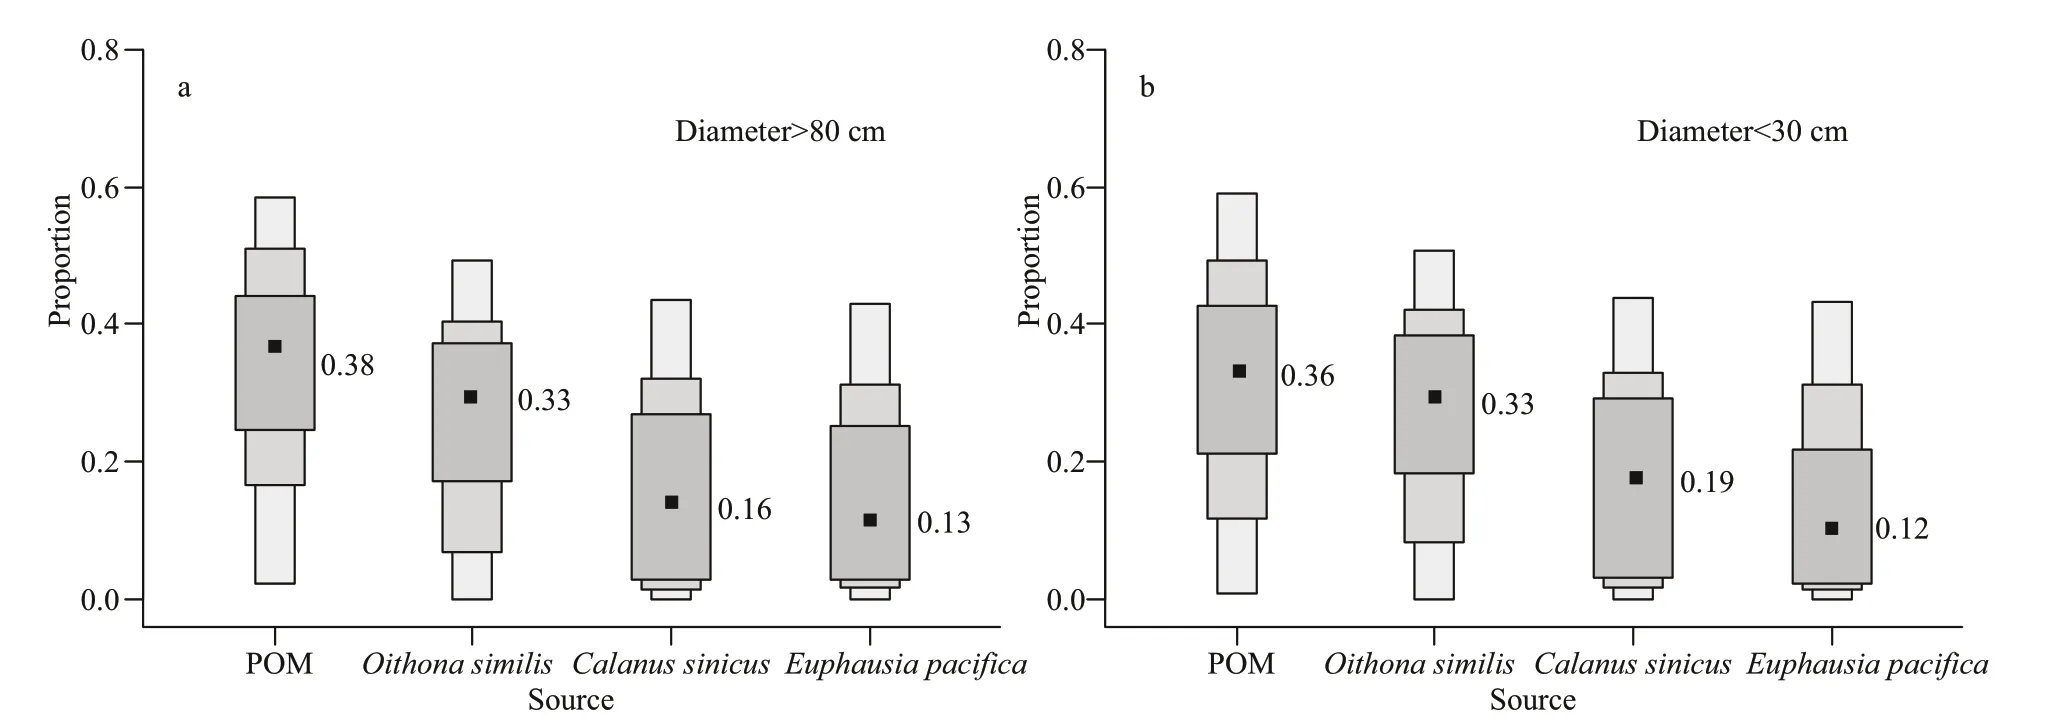
Fig.5 Results ofisotope mixing models in SIAR (95%, 75%, and 50% credibility intervals (shown by different gray scale))of the contribution ratio of sources to Nemopilema nomurai diet
4 DISCUSSION
4.1 Diet of N. nomurai
A previous study indicates thatN.nomuraibegan to appear in the Yellow Sea in late May and that its population increased rapidly from June to August,peaking in September or October (Sun et al., 2015).The sampling period for this study was August 2016,a period of rapid growth forN.nomuraiin the Yellow Sea. Stable isotope and FA analyses may reflect nutrient absorption during this period.
The average abundance ofN.nomuraiin the Yellow Sea in August 2016 was 401 inds./km2, which was close to the 689 inds./km2observed in August 2013 (Sun et al., 2015). Because 2013 was a midbloom year forN.nomurai(Sun et al., 2015), we assumed that the sampling period used in this study was also during a mid-bloom year forN.nomurai.From 2006 to 2013, the average abundances ofN.nomuraicollected by bottom trawl from the Yellow Sea ranged from 34 inds./km2to 4 951 inds./km2(Sun et al., 2015). In this study, the abundance ofN.nomuraiwas also within this range. Therefore, theN.nomuraicollected here were in a regular state, and our results may be representative of the typical diet for mostN.nomuraiin the Yellow Sea.
The results of the stable isotope analysis show that POM and small copepods (dominated byO.similis)measuring less than 1 mm comprised over 60% ofN.nomuraidiet (Fig.5). Thus, despite its large body size,N.nomuraistill preys predominantly on small plankton and organic particles, and this is mainly determined by the structure ofN.nomuraifeeding organ and its predation method.N.nomuraiis a Rhizostomeae jellyfish, and its preys are engulfed into the terminal pore and travel through the canal system to the gut. The diameter of the terminal pore directly determines the size of the food particle that can be ingested byN.nomurai, and regardless of body size, its terminal pore diameter is always about 1 mm (Lee et al., 2008). Thus, it is theoretically difficult forN.nomuraito engulf particles exceeding 1 mm in diameter. Some larger but slender zooplankton may also be preyed upon by Rhizostomeae (Pitt et al.,2009). Therefore, we considered large copepods and krill sizes greater than 1 mm to be potential prey items forN.nomurai. The SIAR results show that although a high biomass of zooplankton larger than 1 mm was observed during the survey period (Fig.2), and their contribution toN.nomuraidiet was much lower than that of small copepods and POM (Fig.5). According to the studies of Chinese researchers, the POM in the South Yellow Sea was mainly composed by resuspension and river input detritus, as well as phytoplankton and microzooplanktons (Qin et al.,1988, 1989; Liu et al., 2010; Hu et al., 2017).Therefore,N.nomuraiblooms may impose relatively high feeding pressure on small creatures which include small copepods, microzooplankton, and phytoplankton.
The FA analysis results showed that the content of FAs C18∶2n-6+C18∶3n-3 in POM was higher than in all the other zooplankton (Table 2). In previous studies, C18∶2n-6+C18∶3n-3 was used as a biomarker for terrestrial material. The threshold to distinguish between terrestrial and marine sources was considered 2.5% (Parrish et al., 1995; Budge and Parrish, 1998).When the C18∶2n-6+C18∶3n-3 content in the FAs of a species is higher than 2.5%, its diet likely contains substances of terrestrial origin (Budge and Parrish,1998). Therefore, given that the C18∶2n-6+C18∶3n-3 content in POM in this survey was much higher than 2.5%, it may be that the POM in the Yellow Sea contains large quantities of terrestrial components.Considering POM’s large contribution to the diet ofN.nomurai, terrestrial sources of nutrition should have taken a certain contribution toN.nomuraidiet.Therefore, terrestrial inputs may promote blooms ofN.nomurai.
4.2 Impact of N. nomurai on zooplankton community
The FA clustering results showed that the FA composition ofN.nomuraiwas similar to that of the krillE.pacifica(Fig.3). Past studies indicate that as a food source ofN.nomurai, most small plankton can also be potential food sources forE.pacifica(Ohman,1984; Dilling et al., 1998; Nakagawa et al., 2004;Bargu et al., 2006). Because the size of the terminal pore makes it difficult forN.nomuraito feed on organisms larger than 5 000 μm, including krill, the only explanation for the similarities betweenN.nomuraiand krill in terms of FA composition is that they had ingested similar food sources. Having a similar diet could lead to competition for food resources. Therefore,N.nomuraiblooms could have a negative impact onE.pacificapopulation growth.E.pacificais the main food for many marine vertebrates, including fish and seabirds (Brinton and Townsend, 2003; Croll et al., 2005; Chae et al., 2008;Suntsov and Brodeur, 2008; Hipfner, 2009). IfN.nomuraiblooms contribute to a reduction in the krill population, the food supply of higher trophiclevel animals may also decrease. In other words,N.nomuraiblooms may affect krill abundance as a result of competition for food resources, and this impact may be transmitted to higher trophic-level organisms.
The stable isotope bi-plot showed thatN.nomuraishared similar δ13C and δ15N values with krill and small copepods (Fig.4), which indicated that the effect ofN.nomuraiblooms on krill and small copepods was likely caused mainly by competition for food resources. However, the small copepodO.similismay also be preyed upon byN.nomurai, which indicates overlap between the δ15N values ofN.nomuraiand its prey. This phenomenon has been reported inP.noctilucaandA.aurita(D’Ambra et al., 2013; Milisenda et al., 2018). Therefore,N.nomurailikely influences small copepods through predation and competition. Because arrow worms and fish larvae are also predators of copepods, they could be indirectly affected byN.nomurai. In summary, the impact ofN.nomuraiblooms on zooplankton communities exerts a negative bottom-up influence that is mainly a result of diminishing the low trophiclevel prey.
4.3 Limitations and countermeasures of SIAR tools used in this study
Two issues must be considered when using SIAR.First, to obtain accurate results, the source data should include as many of the consumer’s total food sources as possible (Remon et al., 2016). Yet if all ofN.nomuraipossible food sources were substituted into the model,the number of food sources would be too large, which can influence the model’s accuracy (Parnell et al.,2010). Secondly, the contribution of two relatively close food sources with different abundances yet similar isotope values to the diet of consumers should be different. However, because the data imported to the SIAR model includes only isotope values that do not consider abundance (Parnell et al., 2010), similar isotope values substituted into the model may result in similar contribution ratios; this is not consistent with real-world observations. To solve these two problems,we chose to group sources according to particle size.After investigating zooplankton abundance in the study area, the isotopic data of dominant species in each group were selected to execute the SIAR model. The number of food sources was reduced as few as possible to ensure successful operation of the model. The food sources data can also represent the vast majority of the food forN.nomurai, ensuring the accuracy of results. Future research efforts shall focus on increasing the sampling frequency to obtain stable isotopic data for more species and establishing a stable isotope database for plankton.After that, plankton could be classified into groups according to the stable isotope data to decrease the number of sources imported into the model. When running SIAR models, substituting each group of plankton as a single source into the model; that way, the errors caused by different species abundances can be avoided. In future, this database may also facilitate the study of material energy flows in marine research.
5 CONCLUSION
Food compositions of large and smallN.nomuraiare similar. Both are mostly composed by organisms with size smaller than 1 000 μm in diameter. Therefore,the feeding pressure ofN.nomuraiblooms is mostly put on small planktons. The impacts on large zooplanktons (e.g. krills) are mainly caused by food competition. This would provide certain guiding significance for the impact assessment research ofN.nomuraibloom. In addition, the food composition ofN.nomuraicould be reference materials for the forecasting research ofN.nomuraiblooms.
6 DATA AVAILABILITY STATEMENT
The data that support the findings of the current study are available on reasonable request from the corresponding author.
7 ACKNOWLEDGMENT
We thank Drs. Song FENG, Lijuan WANG,Pengpeng WANG, and Nan YU, from Key Laboratory of Marine Ecology and Environmental Sciences,Institute of Oceanology, Chinese Academy of Sciences, for their great assistance during shipboard research activities.
 Journal of Oceanology and Limnology2022年3期
- Journal of Oceanology and Limnology的其它文章
- Typhoon-induced wind waves in the northern East China Sea during two typhoon events: the impact of wind field and wave-current interaction*
- Effect of subsea dispersant application on deepwater oil spill in the South China Sea*
- Geochemical characteristics of cold-seep carbonates in Shenhu area, South China Sea*
- Examination of seasonal variation of the equatorial undercurrent termination in the Eastern Pacific diagnosed by ECCO2*
- Deviation of the Lagrangian particle tracing method in the evaluation of the Southern Hemisphere annual subduction rate*
- Immunostimulatory effect of quaternary degree and acetyl group of quaternized chitosan on macrophages RAW 264.7*
