Effect of subsea dispersant application on deepwater oil spill in the South China Sea*
Haibo CHEN
1 CAS Key Laboratory of Ocean Circulation and Waves, Institute of Oceanology, Chinese Academy of Sciences, Qingdao 266071,China
2 Pilot National Laboratory for Marine Science and Technology (Qingdao), Qingdao 266237, China
3 Center for Ocean Mega-Science, Chinese Academy of Sciences, Qingdao 266071, China
Abstract There are considerable amounts of offshore oil/gas fields in the South China Sea (SCS), and for potential oil spill events in this area, dispersants may provide a reliable large-scale response when the preferable option of recapturing the oil cannot be achieved. In this paper, effect of chemical dispersants on underwater oil transport is investigated with an underwater oil spill model. Since the model is an adaption of an existing one, we first calibrate it by comparing the model result with echo-sounder data that were observed during the “DeepSpill” experiment with crude oil/LNG (liquefied natural gas) discharge. Then,with the hydrodynamic data provided by an operational forecasting system and the drilling data obtained from offshore platforms in the SCS, we apply the model to a hypothetical spill case, and examine the difference in oil distribution in water column caused by subsea dispersant application. The model results can provide valuable reference for contingency plan makers to make an efficient emergency response to potential underwater oil spill accidents in the SCS.
Keyword: underwater oil spill; numerical simulation; chemical dispersants; South China Sea; contingency planning
1 INTRODUCTION
Over the last several decades, offshore oil spills have become a global environmental concern due to the growing petroleum industry activities in the sea,representing a major threat to marine environment and ecosystems (Mignucci-Giannoni, 1999; French-McCay, 2004; Hester et al., 2016). The production safety is always a major concern and the potential oil spill accidents should be taken seriously considering the fact that, from time to time, there have been some underwater oil spill accidents that attracted a great deal of public attention to consequent problems(Vethamony et al., 2007; Spier et al., 2013; Burns and Jones, 2016). These accidents were usually of difficult management due to their large relative distance to the shore, where civil protection teams and clean-up equipment were located.
The South China Sea (SCS) is an important area for present and future offshore oil/gas exploitation of China. Hence, once a spill occurs in the SCS, it may bring a great negative effect not only on the marine environment and ecosystems therein but also on the economics and politics of countries around this sea area. After all, the tragic 2010 Deepwater Horizon(DWH) accident in the Mexico Gulf (Ryerson et al.,2012) and the 2011 Penglai 19-3 oil spill in the Bohai Sea (Li et al., 2013) enlightened us that large releases may also occur from drilling operations in the offshore oil/gas fields in the SCS. Thus, although there has not yet been large oil spill accident in the SCS so far, we still ought to heighten our vigilance and enhance our risk preparedness. To that end, it is still of practical significance to conduct case studies of hypothetical oil spill scenarios with results that will be valuable to contingency plans for potential accidents (e.g.,Dasanayaka and Yapa, 2009; Alves et al., 2015;Khade et al., 2017).
In recent years, some scholars have begun to conduct numerical studies of underwater oil spills in the offshore areas of China. But many of these studies only took the shallow Bohai Sea (maximum depth 85 m) as their study area, maybe because the existing offshore oil exploitation and production activities in China mainly concentrate in this area (Wang et al.,2008, 2013; Guo and Wang, 2009; Li et al., 2013,2018). By contrast, researches on the underwater behavior of oil spill, especially from deepwater region in the SCS, are quite limited. This may be due to the limitation of available exploiting information and limited number of underwater spill accidents that have occurred in this sea area. With underwater drilling information obtained from two offshore platforms located in the northern SCS, Chen et al.(2015, 2016) conducted two hypothetical case studies,and their simulation results would have guiding significance for contingency planning with regard to the emergency response to an accidental underwater oil spill in this area.
Another interesting point is about the underwater application of chemical dispersants, which have been widely used for mitigating oil spill impacts on the environment since the 1950s (Ramachandran et al.,2004). It was reported that, during the 2010 DWH spill, about 7.9 million liters of chemical dispersants(Corexit EC9500A and Corexit 9527A) were applied at the sea surface and near the 1 500-m deep wellhead(Kujawinski et al., 2011). Since then, the effects of chemical dispersant have become an important part of many studies of underwater oil spill (e.g., Paris et al.,2012; Yapa et al., 2012; Johansen et al., 2013; Spier et al., 2013; Zhao et al., 2014a). An important result of subsurface dispersant application is to increase hydrocarbon concentration in subsurface waters(Spier et al., 2013). Despite the toxicity of these chemicals and the dispersed oil, in most cases, the potential environmental costs of dispersant application are still outweighed by the environmental benefits from the viewpoint of integrated environmental impact (Prince, 2015). In a case study for early oil spill response in the Eastern Mediterranean Sea,Alves et al. (2015) supported the use of chemical dispersants in the very few hours after large accidental oil spills. Socolofsky et al. (2015) conducted an intercomparison of oil-spill prediction models for accidental blowout scenarios with and without subsea injection of chemical dispersants, and concluded that the subsea dispersant addition could result in a significant fraction of the released oil never reaching the sea surface. As the offshore oil/gas industry staffs in the northern SCS are concerned, once an underwater oil spill accident occurs in the deep-water area in the SCS, how will the chemical dispersants affect the underwater oil transport? Some related discussions will be presented in this paper. Note that here we only focus on the underwater transport of the spilled oil,although simulating the oil transport on sea surface is equally important, especially for a long-term spill response and damage assessment.
This paper is organized as follows. In Section 2, we first briefly introduce the oil spill model and oil droplet size distribution employed by the model,considering the effect of subsea dispersant application.In Section 3, the model is calibrated by comparing the model predictions with experimental data observed in a full-scale field experiment of the “DeepSpill”.Section 4 shows the application of the model to a scenario in which a hypothetical oil spill occurs at the seabed of an oil/gas field in the northern SCS, and the effect of subsea dispersant application on underwater oil transport is discussed. Finally, we provide a summary, and draw some conclusions in Section 5.
2 OIL SPILL MODEL
Conventional short-term (several days long)underwater oil spill simulation usually involves nearfield simulation and farfield simulation, via two submodels, respectively (e.g., Johansen, 2000; Zheng et al., 2003). For the oil spill model, the present work will follow the framework constructed by Chen et al.(2015, 2016) and make necessary modification to their model. This section will give a brief introduction of model construction. For details of model formulation, interested readers are referred to Chen et al. (2015, 2016).
2.1 Two submodels
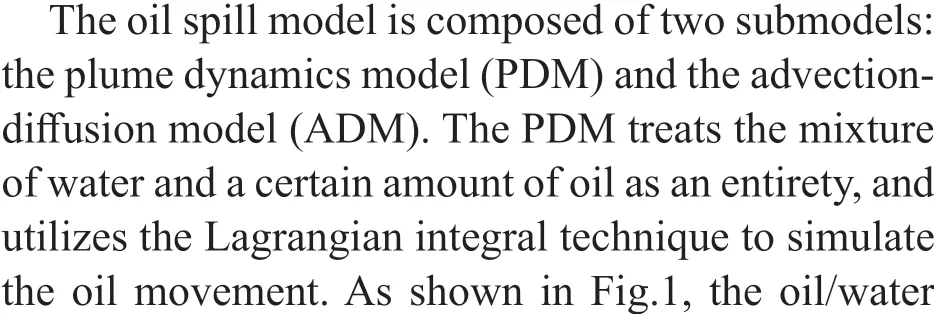
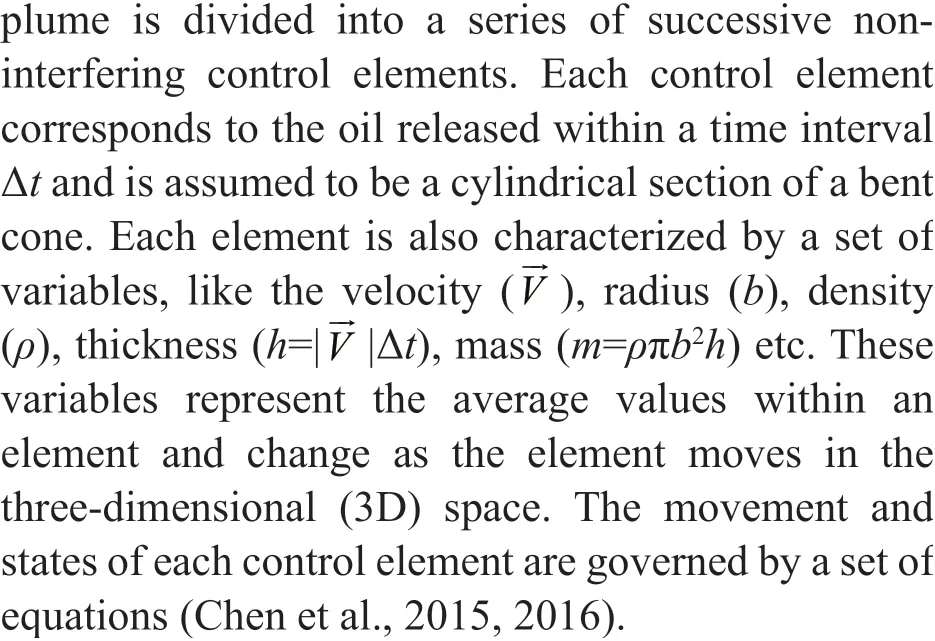
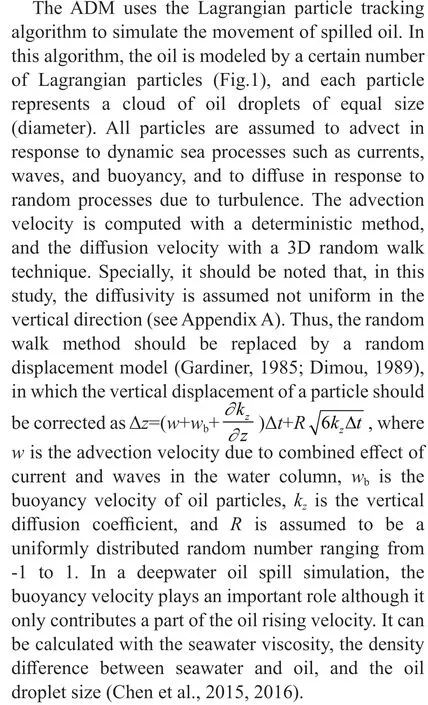
The oil dissolution is an important process for the underwater oil. It was reported that, during the 2010 DWH spill, the soluble compounds made a considerable fraction of the deep plume mass (Ryerson et al., 2012; Spier et al., 2013; Gros et al., 2017).Actually, the final effect of the dissolution process depends on both the dissolution rate and the processing time. In the present work, oil dissolution is considered in both submodels, following the formulation presented by Chen et al. (2015).
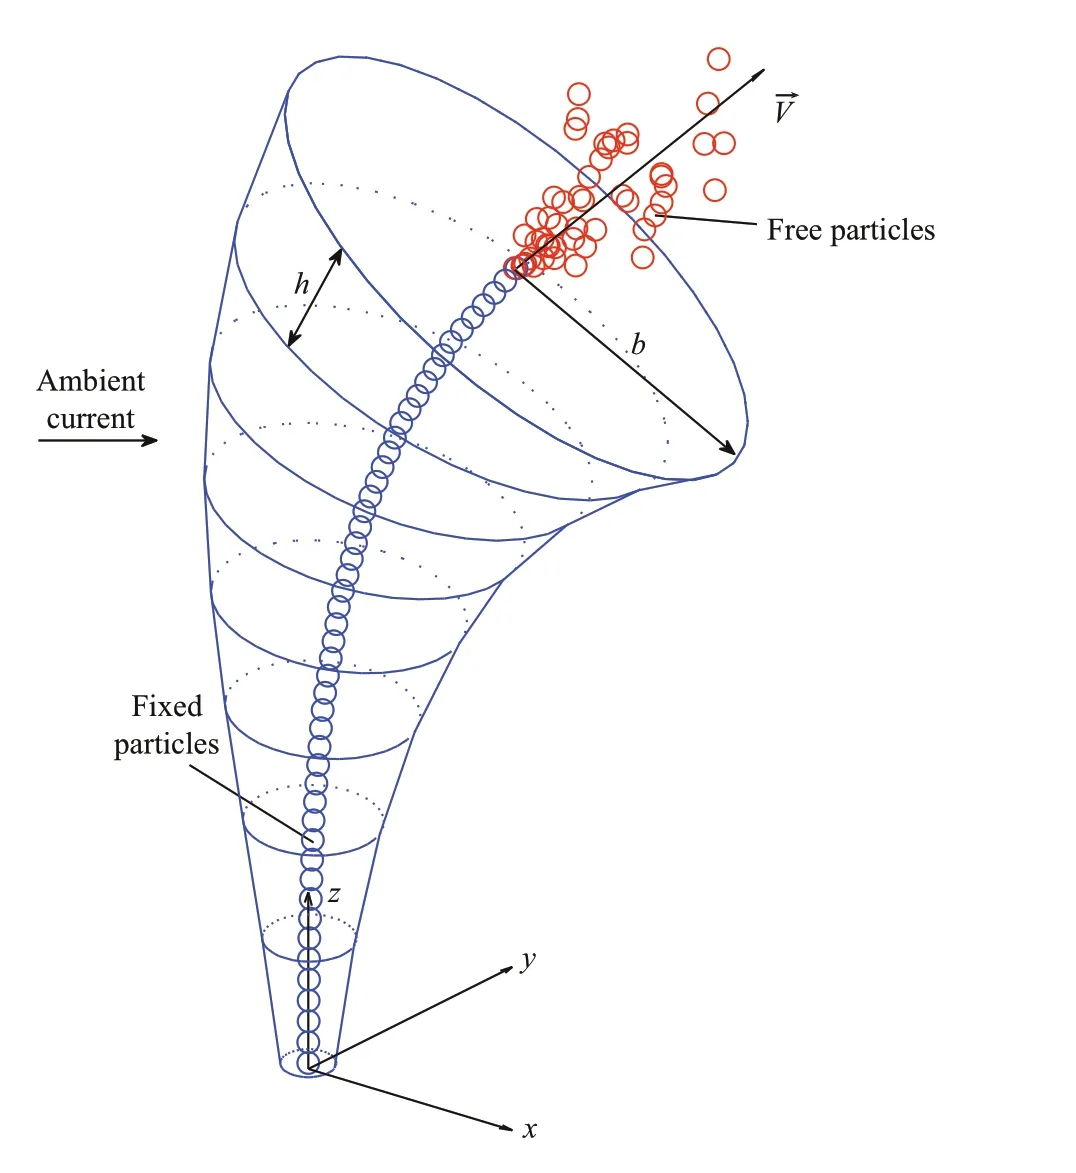
Fig.1 Conceptual model for underwater oil spill
2.2 Transition from PDM to ADM
To effectively examine the difference in underwater oil distribution between the cases with and without dispersant application, we make a modification to the spill model of Chen et al. (2015, 2016) in this section.In the PDM, we present the model result as a number of oil particles that are fixed at the centerline of the plume body and move along with a control element,as shown in Fig.1. It should be noted that in the PDM the plume movement and breath are simulated by a series of governing equations, rather than by the Lagrangian particle-tracking algorithm although the particles are also employed by this submodel.Actually, we use a two-step algorithm in the PDM. In the first step, we conventionally solve the governing equations of the plume dynamics and obtain the plume trajectory and its local size. In the second step,the particles are employed to reconstruct the result of the first step mainly for the visualization purpose on the one hand and on the other hand to prepare the initial conditions for the ADM. To that end, it is a natural way to place the particles along the center axis of the plume (Fig.1) and characterize each particle with an oil concentration distribution. Then, the integration of local concentration spreads of all particles is used to construct the plume width. Note that both the particle location and corresponding local concentration spread have to be passively calibrated to the plume breadth, until the plume dynamic stage terminates.
Here, the droplet buoyant velocity criterion (or rather the buoyant velocity corresponding to the median oil droplet size) is used to determine the transition point, following the suggestion of Dasanayaka and Yapa (2009). Once the plume dynamic stage terminates, all particles are set free from the center of control element, and then continue to advect and diffuse in the next stage. This means that the final state of the control element will provide the ADM with initial conditions, and therefore one Lagrangian particle should represent a whole oil cloud that shares the same center with the control element at the beginning of the advection-diffusion stage. Note that one particle is characterized by only a specified droplet size (diameter), and therefore it only represents part of the oil droplets that are of the same size. The idea of treating particle as representing a Gaussian-shaped cloud can also be found in some other oil spill models (e.g., Reed et al., 2000, 2004;French-McCay, 2003).
In the ADM, since an oil droplet released from great depth may travel a long time (several hours or more) before reaches the sea surface, the oil cloud represented by a particle may then grow to a larger size due to turbulent diffusion. In the present model,we make an assumption that the particle will always serves as the center of the corresponding cloud throughout the whole advection-diffusion stage.Then, a following problem is how to calculate the cloud size and the 3D oil mass distribution within the cloud, so that the spatial distribution of oil concentration can be further calculated. In this study,we adopt a modified version of algorithm of de Haan(1999), which was originally proposed for modeling atmospheric pollutant dispersion, to calculate the cloud size and oil mass distribution inside. The derivation is given in Appendix A. In this way, the initial conditions of the oil cloud size can be naturally obtained from the final state of the PDM, allowing a rational transition from PDM to ADM. Besides, since oil cloud concept should be applied to each particle,the surfacing of an oil particle could be a slow process,rather than instantaneous. The algorithm for particle surfacing is given in Appendix B.
2.3 Droplet size distributions and effect of chemical dispersants
In the present study, two types of droplet size distribution (DSD) are used, corresponding to untreated oil (type A) and oil treated with dispersants(type B), respectively. Here we will neither use the results of the empirical and numerical models(Brandvik et al., 2013; Johansen et al., 2013), nor consider the evolution of droplet size in the field far from the release point (Zhao et al., 2014a, b). This is based on the following two considerations. On one hand, in this model, the motion of the oil cloud in the plume dynamic stage is not related to the DSD. On the other hand, before the plume dynamic stage terminates, the spilled oil may have transported a long distance (typically 100 m or more), the oil droplets can be very scattered, and the DSD may reach a steady state (Zhao et al., 2014a, b). Alternatively, the two DSDs used in this study are respectively derived from two discrete distributions given by Yapa et al.(2012), of which one is based on observation data of the “DeepSpill” experiments (Johanson et al., 2001)(for type A, Fig.2a) and the other represents a situation corresponding to posting dispersant application (for type B, Fig.2b). The DSD for the case with dispersant addition is derived from two assumptions (Yapa et al.,2012). First, the chemical dispersants are assumed to be applied at the source and therefore can be efficiently mixed with oil due to the high turbulence at this level.Second, adding dispersants makes it easier for oil to break into droplets of finer sizes. The distribution is assumed to consist of 40% of the oil volume in smaller droplets whose sizes range from 100 to 900 μm. The 40% chosen here is based on generally accepted figures that are between 40% and 60%, if dispersants are applied at the source. The DSD of type B is developed for the SCS oil spill simulations which will be presented later. Although the type B DSD is not obtained by direct observation since testing the effect of dispersants on oil spill was not a part of the“DeepSpill” experiments, both the discrete distributions will be referred to as observation data in this section.
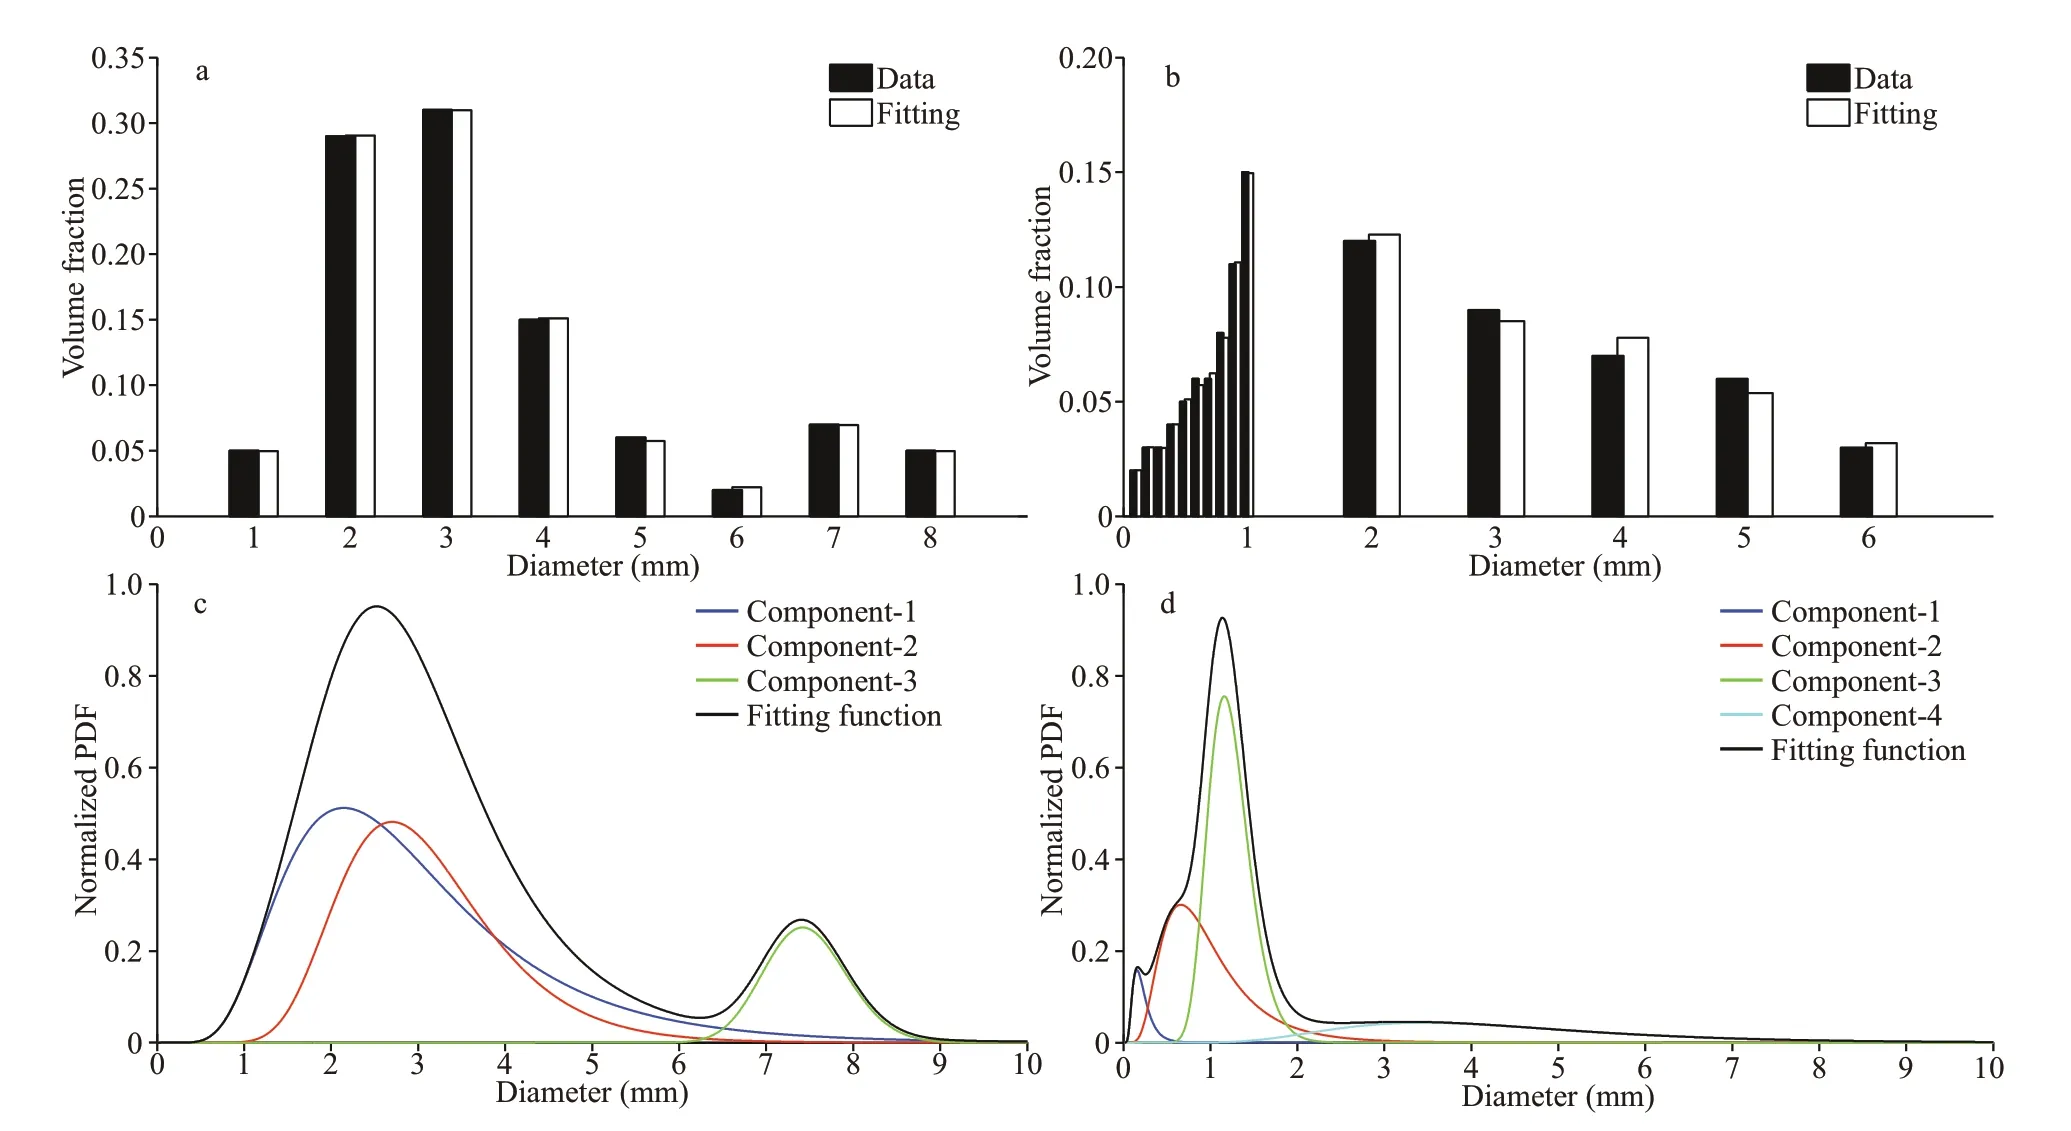
Fig.2 Oil droplet size (diameter, in mm) distributions for the untreated oil (a, c) and oil treated with dispersants (b, d)
To allow an effective comparison between model results derived from the two DSDs, we first bin the DSDs into the same set of size intervals. A way to achieve this is to fit the observation data with a distribution function, considering one observation value as a result from integrating a probability density function (PDF) within an interval. Here, we follow the method proposed by Chen et al. (2014), and use a sum of multiple functions as the fitting function. This means that the size distribution fitting the observation data can be treated as a linear superposition of several sub-distributions. For the fitting function, two candidates are chosen in this work: the lognormal distribution and the Rosin-Rammler distribution, as described in Johansen et al. (2013). In the work of Johansen et al. (2013), the Rosin-Rammler distribution was chosen as the optimal fitting function since it could fit the data over a wider size range than the lognormal distribution. This form was also followed subsequently by some other studies, e.g, Socolofsky et al. (2015) and Johansen et al. (2015). In the present work, however, we find that the lognormal distribution is slightly better at fitting the data than the Rosin-Rammler distribution, so only the result of the lognormal distribution is used here.
The fitting DSDs of types A and B are shown in Fig.2c & d, respectively, together with the subdistributions. For type A, three sub-distributions are enough to have a satisfactory fitting result, and for type B, four are enough, because more subdistributions cannot remarkably improve the fitting result in both cases. The integral results binned in the same intervals as the observation data are shown in Fig.2a & b, in order to be comparable to the observation data. For type B, it should be specially noted that, the fitting distribution function in Fig.2d seems very different from observation data in Fig.2b,especially in the range of droplet size larger than 2 mm. In fact, as shown in Fig.2b, the bin size for droplet diameter smaller than 1 mm is one tenth of that for larger droplet diameter. Although the fitting function has larger values for smaller droplets(Fig.2d), the integral result is still comparable to that for larger droplets (Fig.2b). Comparison of the subdistributions between the two types of DSD indicates that the effects of dispersants result in a larger fraction of smaller oil droplets.
To initialize the oil spill model, all Lagrangian particles are equally divided into 20 droplet size classes, which respectively correspond to 20 size bins that are evenly distributed on a lognormal scale from 10 to 10 000 μm. In each class, all particles are assigned the same oil amount as well as a series of random droplet sizes that follow the uniform distribution within corresponding size bin. The classintegrated oil amount is calculated as the sum of oil amounts of all particles in corresponding size class,and these 20 class-integrated oil amounts follow the bin-integrated DSD of type A (or type B) for case without (or with) dispersants.
3 MODEL CALIBRATION
Since the oil spill model used in this study is an adaption of the model developed by Chen et al. (2015,2016), it should be calibrated before applied to scenario simulations. The calibration is conducted by comparing the model predictions with experimental data observed in a full scale field experiment of“DeepSpill”. This experiment was conducted by SINTEF in June 2000 in a deepwater area (844 m) of the Norwegian Sea, as a part of the “DeepSpill” Joint Industry Project (JIP), and was described in details in a report of Johansen et al. (2001). The experimental data from DeepSpill have been used to calibrate numerical oil spill models by a number of studies(e.g., Chen and Yapa, 2003; Johansen et al., 2003;Yapa et al., 2010; Wang and Adams, 2016). There were three subsea discharges in the “DeepSpill”experiments, and in the present work, we only choose the experiment with crude oil/liquefied natural gas(LNG) discharge as an example. Some key inputs,like the measured sea salinity, temperature, and currents, can be found in Johansen et al. (2001), or partly from Johansen et al. (2003) and Chen and Yapa(2003). It should be pointed out that, although this discharge experiment used composite of oil and gas,in the present study we only focus on the behavior of oil, which concerns the offshore responders most.This means that no particle is actually employed for simulating the gas transport. However, in the PDM,the effect of gas phase on the plume movement is still taken into account. In fact, the main effect of gas phase on the blowout is to increase the initial release speed and the plume buoyancy (Chen and Yapa,2004), and then to some extent changes the terminal time and depth of the plume stage as well as the oil surfacing time and location. In this test, we treat the gas simply as non-ideal and soluble. But the hydrate formation is not considered because actually the hydrates were not observed during the “DeepSpill”(Johansen et al., 2003), although it can form in theory.Besides, during the “DeepSpill” experiments, the stratification was relatively weak and the cross flows dominated the deepwater condition. In this case,according to some laboratory observations(Socolofsky and Adams, 2002), if the cross flows are so strong that the oil/gas plume is bent apparently, the gas bubbles will separate from the plume body on the upstream edge due to its faster rising velocity.Simulation of gas separation has been adopted by many underwater spill models (e.g., Johansen, 2003;Chen and Yapa, 2004; Chen et al., 2015). In the present work, gas separation module is also embedded in the PDM, following the algorithm of Chen and Yapa (2004). For the oil DSD, type A shown in Fig.2c is adopted in this calibration test.
The model result is compared to the echo-sounder data from two views: the side view (Fig.3) and the bird’s eye view (Fig.4). In the side views, the profiles are made in the West-East and South-North planes.The echo-sounder data (Figs.3a & b) were obtained within a chosen period during the “DeepSpill”experiments. In order to be comparable with the observations, the model result (oil concentration)shown in Fig.3c & d is calculated within the same period. The concentrations are projected maximum in the direction of the eyes, considering that if one were to conduct echo-sounder measurements as in“DeepSpill”, the observations will be projected maxima. According to the model result, the buoyant plume stage terminates at the height of 74.4 m.However, it is difficult to make a distinction as to such a point from the observed data in Fig.3a & b. The modeled time taken by the first oil droplet to appear at the surface is 65.0 min after the release starts,comparable with the 60 min observed during experiment as well as the 75 min given by the DeepBlow model (Johansen, 2003). Note that in Fig.3 the comparison is relatively poor near the release point. This discrepancy can be possibly attributed to the interference due to the noises generated by cryogenic pump at the nozzle and the influences from the motion of the remotely operated vehicle (ROV)during horizontal scanning of the plume (Chen and Yapa, 2003). From Fig.3, a discrepancy can also be found in the upper part of the plume, i.e., the modeled pollution area is wider than the observation. A possible reason, we think, is that, during the “DeepSpill”experiments, there might be some observation points that actually had oil but had no data because the oil concentrations there were not high enough for the equipment to detect, especially near the sea surface.Nevertheless, the model result is still reasonably good, considering those complexities involved in such a large scale field experiment.
Figure 4 show a bird’s eye view of the echo sounder recordings vertically integrated within three depth ranges: 0-300 m, 300-600 m, and 600-844 m. The data were also time averaged in two time windows,from 05∶00 to 06∶00 UTC June 29 and from 06∶00 to 07∶00 UTC June 29. Therefore, there are totally 6 sets of available data. Correspondingly, the model results are also vertically integrated within these three depth ranges and then averaged over time. Note that the original data given by Johansen et al. (2001) also showed the trajectory of research vessel with the depth integrated strength of the area back scattering signal marked with dots in different colors. However, as a preliminary calibration, only the data locations are used for comparison in this study. As shown in Fig.4,the overall comparison between the model result and observation data is reasonably good. Still, there are some differences in the horizontal distribution of spilled oil. In Fig.4b, on the one hand, the modeled plume area is much smaller than the observation,indicating that the modeled oil cloud rises more slowly.This can be attributed to the uncertainties of oil rise velocity and oil droplet distribution. In addition, the uncertainties of the ambient currents, especially the absence of the vertical currents, can also bring discrepancies. On the other hand, the predicted horizontal distribution of oil in the bottom layer is quite different from the observation, as shown in Fig.5c & f.This can be attributed to the errors in measurement of the plume size near the release location, which might be brought in by the relatively large noises generated by the cryogenic pump. As the distance from the nozzle increases, the noise effect decreases (Chen and Yapa,2003). This can also be used to interpret the discrepancy of the horizontal oil distribution in the lower part of the plume between Figs.3b & 4b.
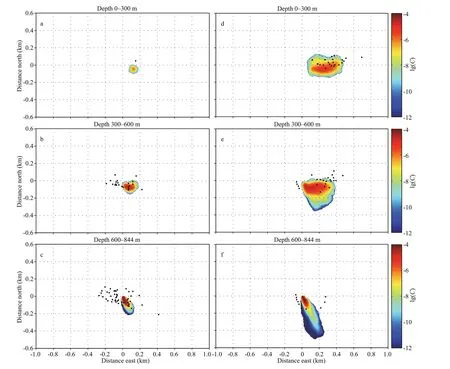
Fig.4 Bird’s eye view of comparison between model simulation (colored area) and echo-sounder data (black dots, obtained from Johansen et al. (2001)) at 3 layers (0-300 m; 300-600 m; 600-844 m)
4 SCENARIO SIMULATION
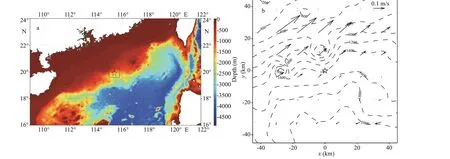
Fig.5 Study area and oil spill location
In this section, in order to investigate the effect of subsea dispersant application on underwater oil transport in the SCS, we apply the oil spill model to a hypothetical underwater oil spill in an offshore oil/gas field in the northern SCS. The input information (like the local hydrodynamic background, oil properties)was provided by responders working on drilling platform of this oil/gas field. For the DSD, we borrow the result obtained from the “DeepSpill” experiments(Fig.2). Note that a potential spill in the SCS can differ from the “DeepSpill” experiment in many aspects, such as the ocean dynamic environment, oil properties, and discharge conditions, which together play an important role in oil behavior and fate. First,the dynamic environment of the SCS can be more complicated than that of the Norwegian Sea, which may be due to existence of some ocean dynamic processes in the SCS, like typhoon, internal waves,and Kuroshio intrusion. This means that the oil spilled from deep water in the SCS can have a very different transport from that in the “DeepSpill”. Second, light crude oil is very common among existing offshore oil/gas fields in the SCS. In this study, the oil used in the hypothetical spill case is lighter than that in the“DeepSpill” experiment (842.5 kg/m3). Furthermore,the SCS oil is usually less viscous, potentially promoting formation of smaller oil droplets under a certain discharge condition. These differences in oil properties may result in a different behavior of underwater released oil. Third, the discharge depth in this study is much larger than that in the “DeepSpill”experiment, and the oil/gas fields in the SCS usually contain a great amount of gases. As a result, potential subsea blowout in the SCS tends to be more violent,which may lead to a very different DSD from that in the “DeepSpill”. These uncertainties in the formation of oil droplets can complicate further assessment of the potential effect of the dispersants on the subsea oil spill. However, there has not been major spill accident in the SCS so far, and thus no observation data about the DSD in this area is available. Alternatively, we have to borrow the result obtained from the“DeepSpill” experiments. In this way, the simulation result may not be exactly realistic in the SCS, but we still believe that, to some extent, it can provide helpful information for the responders working here.
4.1 Hydrodynamic data and spill information
Corresponding to the cases without (Case A) and with (Case B) application of chemical dispersants,two hypothetical scenarios are simulated, respectively.The hypothetical oil spills are assumed to take place at the seabed of an oil/gas field located in the northern SCS (Fig.5a). The background hydrodynamic data(e.g., the seawater temperature, salinity, potential density, and current velocity) was provided by the First Institute of Oceanography, Ministry of Natural Resources, China, using an operational 3D forecasting system. The wind data is not considered because here we only focus on the underwater oil transport within the first two days after release starts. The model domain is shown in Fig.5b, which is sufficiently large to guarantee that the oil would not move out, and also shown is the depth-averaged current field at the spill time.
The spill information was derived from the drilling data obtained from offshore platforms in the SCS. The oil/gas field of interest is located at 115°25′E and 19°55′N, 300 km to the southeast of Hong Kong,China, and the local depth is 1 442 m. The oil is assumed to be spilled upwards from the seabed into the sea environment. The oil density is 811 kg/m3. In this hypothetical spill, it is assumed that the discharge orifice diameter is 0.1 m, the release duration is 24 h,the simulation duration is 48 h, and the total volume of spilled oil is 1 000 m3. Besides, we assume that no gas is released during the hypothetical spill, since we did not get available gas information from the offshore oil industry. In the scenario simulations, 1 080 Lagrangian particles are released per hour from the discharge point, and totally 25 920 particles are employed. The fitting results of types A and B DSDs described in Section 2.3 are used in Case A and Case B, respectively.
4.2 Result and discussion
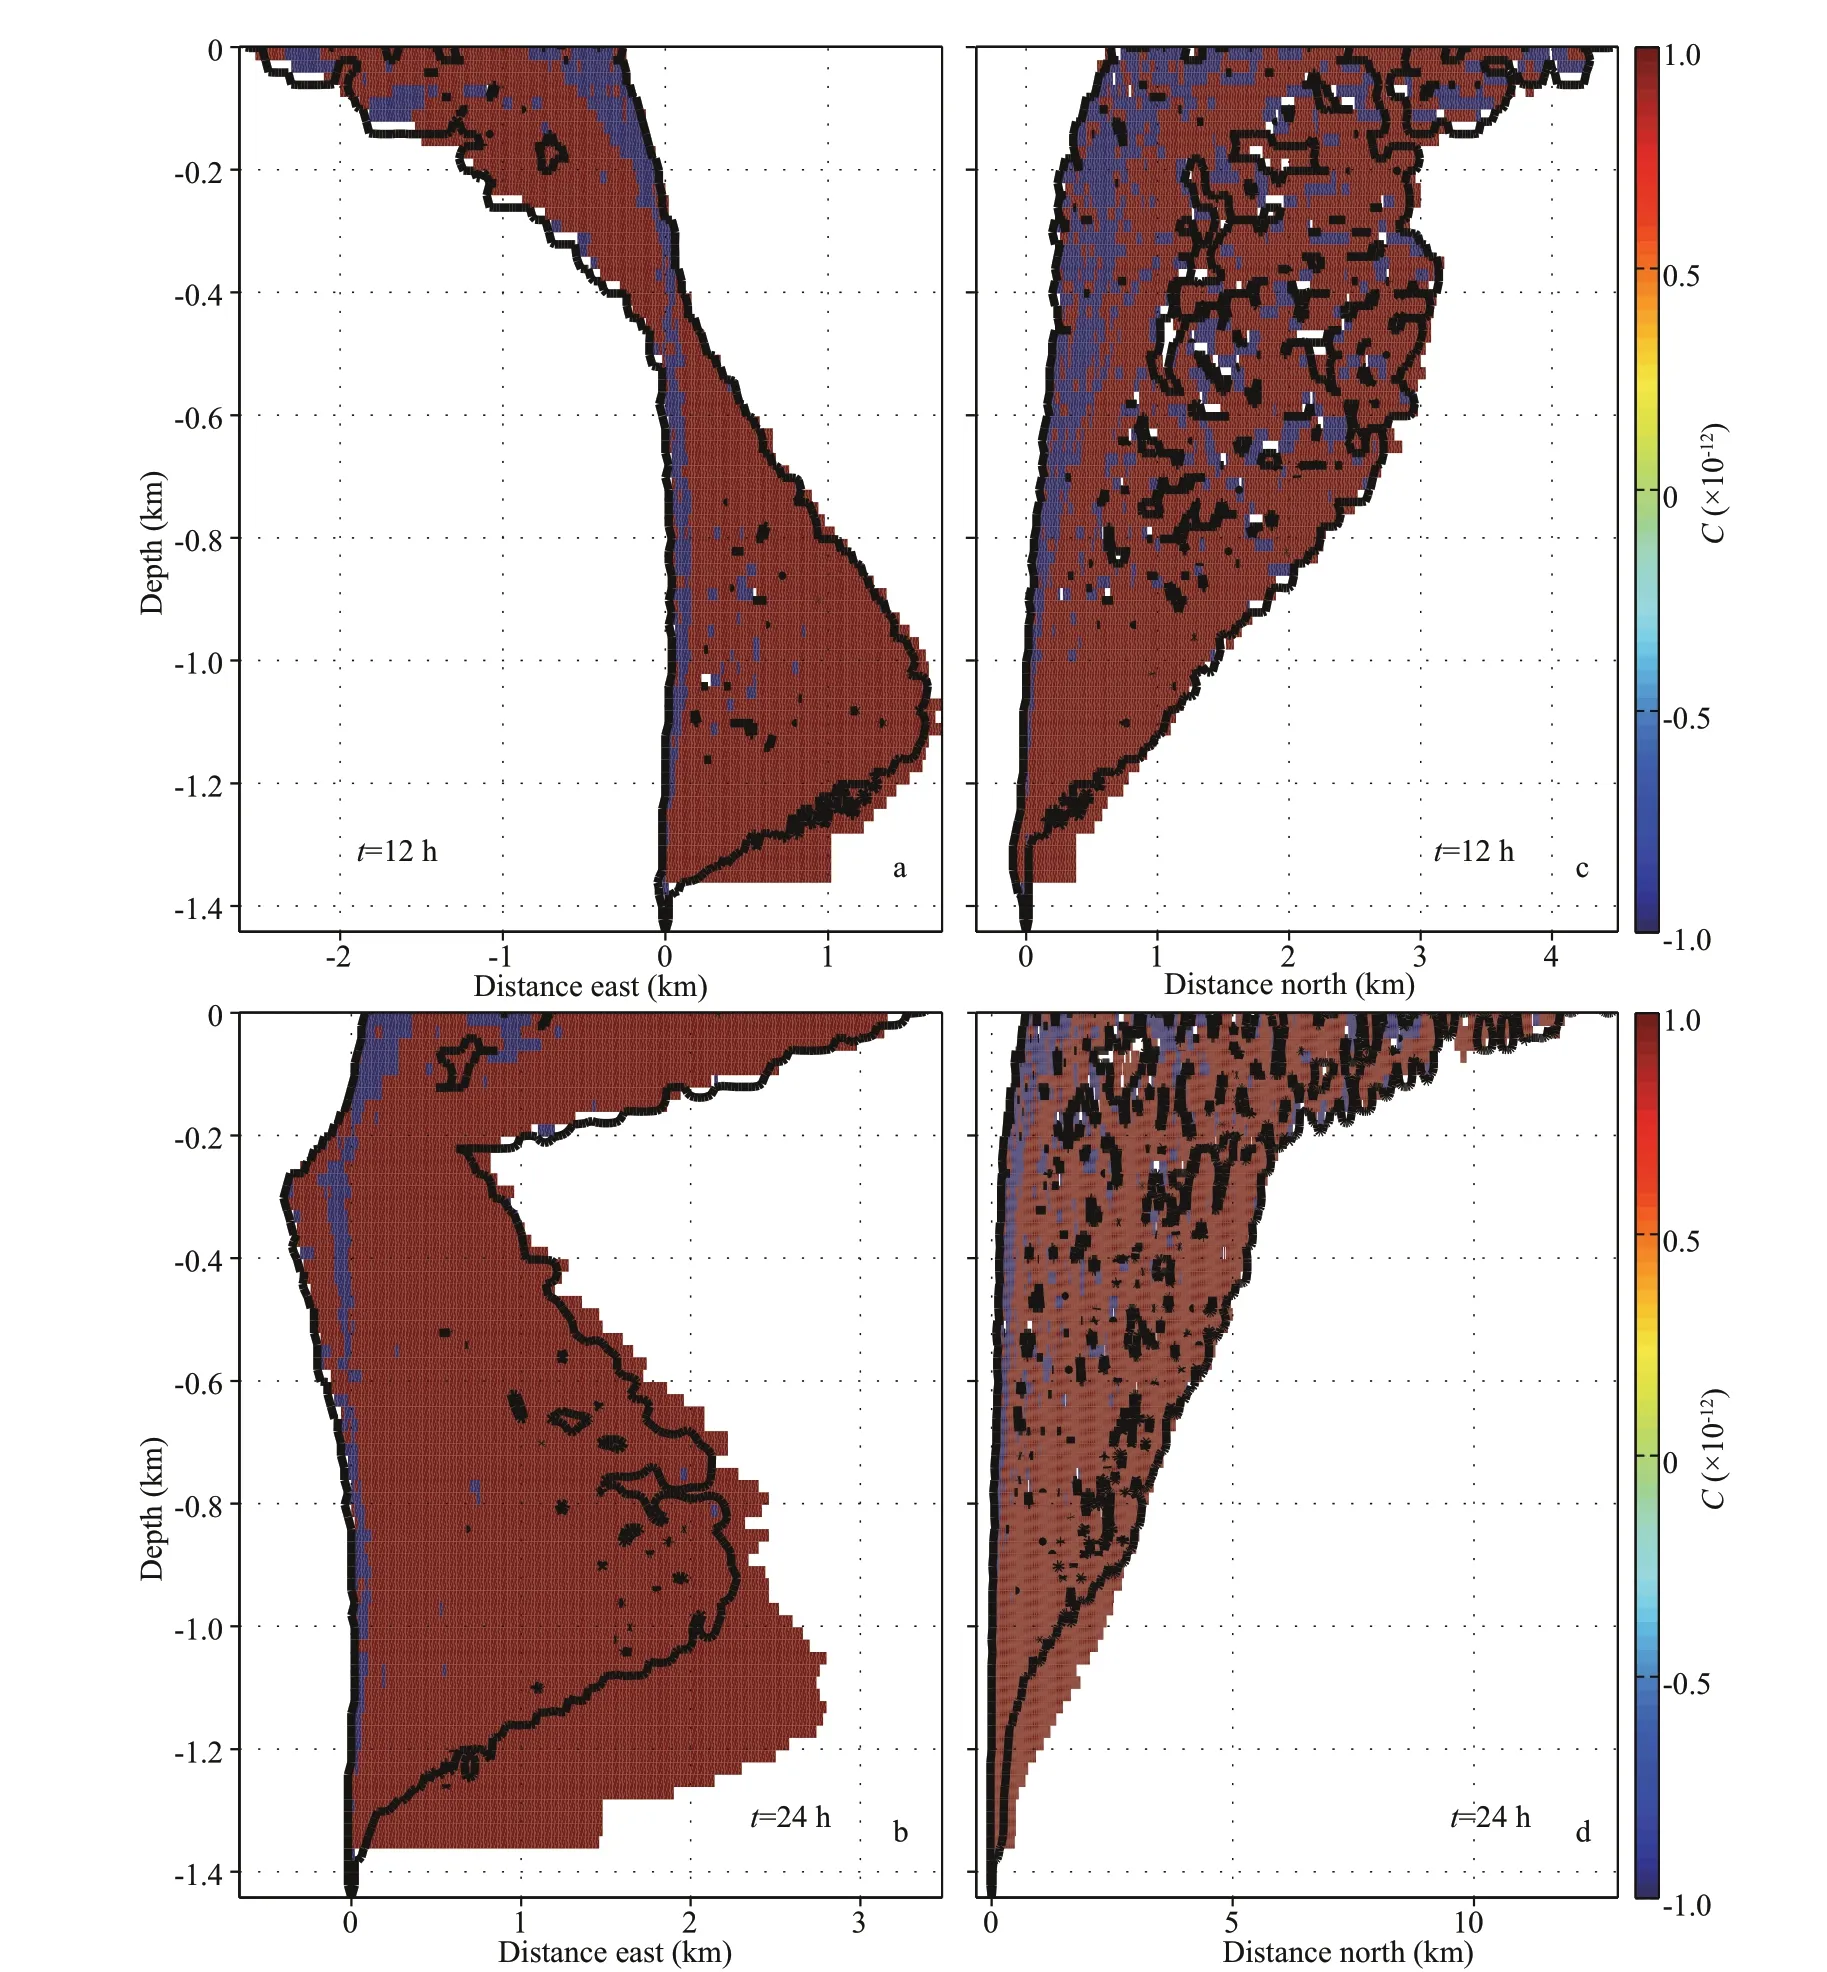
Fig.6 Side views of underwater distribution of oil concentration difference (mass fraction) between two cases at t=12, 24,36, and 48 h
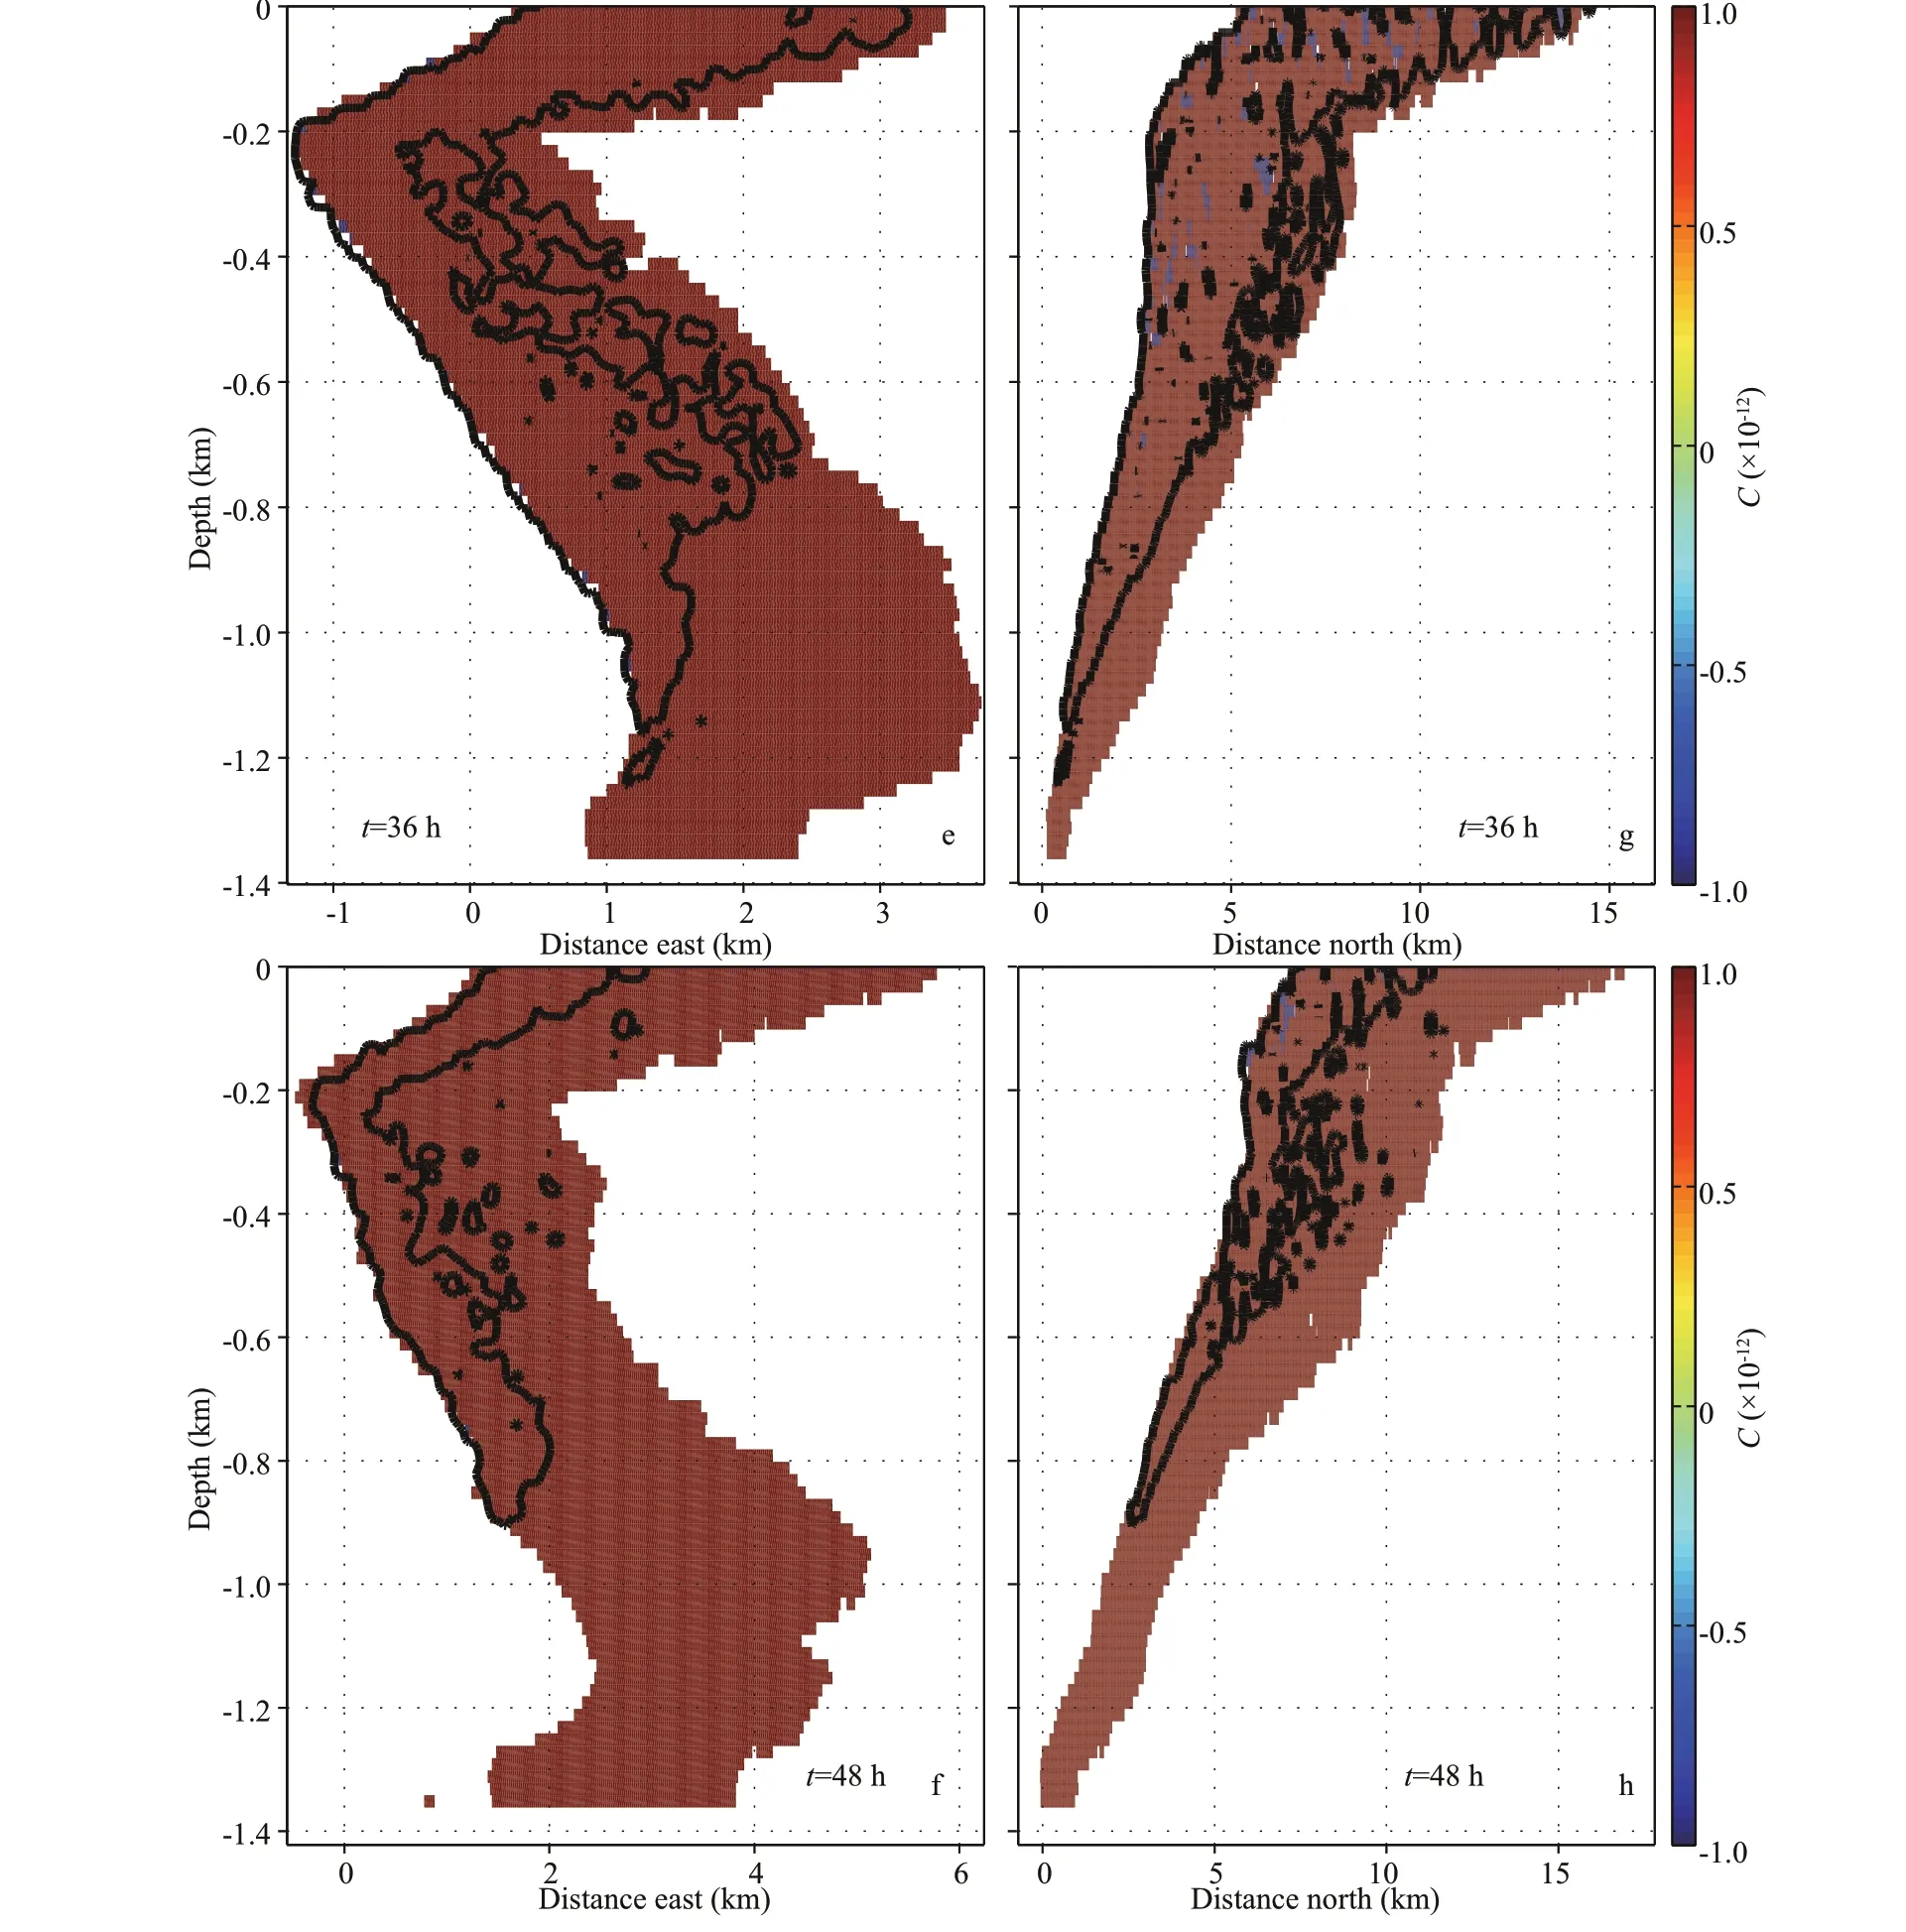
Fig.6 Continued
The difference in underwater distribution of oil concentration caused by chemical dispersant application is shown in Fig.6, in which four pairs of insets show the projection of the maximum concentration difference between two cases into the West-East plane (Fig.6a & b, e, & f) and South-North plane (Fig.6c & d, g, & h) at four time moments. This can also help to view the oil distribution changes with space and time. It should be noted that in Fig.6 the concentration cutoffis 1e-12, meaning that the region of absolute value less than 1e-12 is not shown. Here,positive (or negative) value means that larger (or smaller) oil concentration is caused by dispersant application. In addition, envelop of underwater oil for Case A (defined by contour line of 1e-12) is also plotted in each inset, whereby we can compare the contaminated area between the two cases.
From Fig.6a-d we can see that, in the first 24 h,during which the source keeps releasing oil into ambient environment, the negative concentration difference mainly appears in water column above the source, and in other contaminated area the value is mostly positive. This may result from the fact that, in Case A, there are more large oil droplets that can quickly rise to the surface and thus have very limited time (1.78 h here) for horizontal movement. Therefore,the contaminated area above the source is in fact a pathway for large droplets going through. By contrast,in Case B, there are not so many large droplets and therefore the oil concentration in water column above the source is smaller than that in Case A. On the other hand, the chemical dispersants can increase the amount of smaller droplets, whose movements can be more readily impacted by the crosscurrents due to their slower buoyancy velocity. This leads to larger oil concentration beyond the water column above the source as well as larger horizontal extension of subsea oil distribution especially in deepwater area (below 1 000-m depth). After 24 h when the source stops releasing oil, in both cases, most of large droplets have arrived at the sea surface, leaving small droplets moving in the water column. Since there are more small droplets in Case B due to dispersant application,in most contaminated area, the oil concentration in Case B is larger than that in Case A (Fig.6e-h). In addition, the horizontal extension of subsea oil distribution in Case B is also larger than that in Case A, and their difference increases with depth. This is similar to the pattern within the first 24 h, but the difference between the two cases is more remarkable within the second 24 h.
It should be noted that, in all insets of Fig.6, the difference in subsea oil distribution due to dispersant application is rather polarized, leading to very rare presence of medium values. This can be interpreted as the different transport pathways in the water column between the cases of treated and untreated oil. In fact,adding dispersants at the source promotes the formation of smaller oil droplets. This directly slows down the upward movement of spilled oil, which equivalently enhances its horizontal transport. As a result, the contaminated area in Case B is more horizontally expanded than that in Case A, especially in the lower part of the water column (Fig.6e-h).
From Fig.6, we can also find that, in shallower areas, the underwater oil horizontal extension is larger and farther away from the release point. This can be attributed to the fact that, in the present study area, the ambient currents are generally much stronger in shallower areas than in deeper areas. But for the oil treated with dispersants, this difference is not that obvious, and the bottom part (below 1 000-m depth)of the oil plume is horizontally wider than that of the untreated oil plume. On the other hand, the horizontal extensions of the upper part (above 800-m depth) of the oil plume are similar in the two cases, especially during the first 24 h. This plume part is mainly composed of medium and large droplets whereas the bottom part is mainly composed of small droplets,indicating that the small droplet size range in the DSD plays an important role in the formation of the underwater oil distribution pattern.
We also compared the model results with previous studies carried out on related subject. Note that there has not yet been large oil spill event in the SCS so far,and it is a hypothetical spill scenario that is used for model application in this study. Hence, we have to select previous researches about typical spill events that have ever occurred in other sea areas, and make a qualitative comparison. As the DWH oil spill in the Gulf of Mexico in 2010 was the first attempt at largescale applications of dispersants in deepwater(Kujawinski et al., 2011), this event was usually taken as a typical case by many numerical studies to investigate the effect of subsea dispersant application on deepwater oil spill. For example, based on simulation results of an oil spill model (CDOG), Yapa et al. (2012) showed that breaking up oil with chemical dispersants has a dramatic effect on transport and distribution of oil released from the DWH, and pointed out that underwater oil plumes can be formed and stay submerged for a long period, if very small size droplets are present due to dispersant addition.Such plumes can travel with the currents in the deep water and are carried away for long distances. Paris et al. (2012) adapted a coupled hydrodynamic and stochastic buoyant particle-tracking model to the transport and fate of hydrocarbon fractions and simulated the farfield transport of the oil during the DWH incident. Their study showed an increase of 10%-25% in oil amount below 1 000-m depth due to application of synthetic dispersants at the wellhead,which means a notable deeper shift in the mass center of the subsea oil. Socolofsky et al. (2015) conducted an intercomparison of oil spill model predictions for a prototype subsea blowout (with an oil flow rate 1/3 that of the DWH) with and without subsea chemical dispersant injection, and showed that subsea dispersant injection moves the oil surfacing zone downstream by an order of magnitude beyond that for untreated cases. Qualitatively, the results of these previous studies for the DWH spill are compatible with our simulation results for the hypothetical spill in the SCS. Still, we note that there is a debate on partitioning of surface and subsea oil among some studies for the DWH spill. On the one hand, Paris et al. (2012) pointed out that the application of synthetic dispersants would only make a marginal difference to the global partitioning of surface and subsea oil,decreasing the surfacing oil by 1%-2%. On the other hand, Socolofsky et al. (2015) argued that subsea dispersant addition can result in a significant fraction of the released oil never reaching the sea surface. In the present study carried out for the SCS, our results tend to agree more with the latter.
The above differences in subsea oil distribution due to dispersant application suggest that different ways of subsequent responses should be taken for the two cases, respectively. For the case without dispersants, a relatively great number of large oil droplets may exist. They can reach the sea surface several hundred meters away from the source, and then rapidly form oil slicks. Then, the responders need to deal with these surface slicks near the source as soon as possible before these slicks spread over a larger area. For the case with dispersants, the formation of smaller oil droplets is promoted, which helps to keep more oil suspended in the water column.Consequently, the responders need to deal with less surface oil slicks, while they may have to search a larger area for oil. Adding dispersants could have both positive and negative effects. One positive effect could be the increased safety for responders working on the surface, because a considerable amount of oil is sequestered away from contact with them. Another positive effect could be the enhanced dissolution and biodegradation of the oil due to the higher surface area of smaller droplets compared to larger droplets.Also, the biodegradation of dispersed oil in water column is dramatically faster than that of oil in a slick(Prince, 2015). On the other hand, the main negative effect of dispersants may be the increased toxicity in the water column, which could be caused by the increased subsurface hydrocarbons or by the dispersants themselves. Regulators will need to take these variables into consideration when preparing for deepwater oil spill responses.
4.3 Sensitivity analysis
As shown by the present study, in this modified oil spill model, the cloud approach plays an important role in connecting the particle centralizing scheme and the final output of the model. The cloud approach can improve the computation efficiency through reducing the particle number while guaranteeing a physically meaning of oil mass distribution. In order to further demonstrate the practical value of the cloud approach, this section will present a sensitivity analysis on the particle number and inclusion versus not of the cloud approach. The West-East plane projection of oil concentration at 12 h in Case A is taken as a reference (Fig.7a). For the particle number,a tripled value (77 760) is used for comparison since the present study has employed as few particles as possible and the number is not allowed to further reduce. On the other hand, besides the cloud approach,another alternative method is the so called box counting method and is used for comparison with the cloud approach here. In the box counting method, the concentrations are estimated by counting the particles in a rectangular volume. In this way, we find that the result is quite sensitive to the box size and the total particle number. Comparison between the cloud approach and the box counting method for different particle numbers and different box sizes can be found in de Haan (1999). For the sensitivity analysis, another three tests are conducted in this study. The corresponding three results are shown in Fig.7b, c, &d, respectively. It is worth bearing in mind that more particles may usually lead to a better result, although at the expense of more computation. Thus, both the results in Fig.7c and d have good presentations since both are obtained with tripled particles, suggesting that the difference between the two methods is very limited when sufficient particles are employed,especially in the lower part of the oil plume where the particles are dense. However, when fewer particles are used, the two methods perform differently. In this case, the result of the cloud approach (Fig.7a) is still comparable to the result obtained with tripled particles(Fig.7c & d). By contrast, when the box counting method is employed instead, fewer particles will result in more concentration blanks in the upper part of the plume (Fig.7b) where the particles are sparse due to their earlier release time. These results indicate a better robustness of the cloud approach than the box counting method when fewer particles are adopted.
5 SUMMARY AND CONCLUSION
In this paper, effect of subsea dispersant application on underwater transport of oil spilled from deepwater in the South China Sea is investigated with an oil spill model through a hypothetical oil spill scenario. In order to effectively examine the difference in underwater oil transport between the cases with and without dispersant application, the oil spill model used in this study is an adaption of model of Chen et al. (2015, 2016). First, in the plume dynamic stage,conceptual oil particles are employed and all are distributed along the oil plume centerline, allowing a rational transition from the nearfield simulation to the farfield simulation. Second, a modified version of the algorithm originally proposed by de Haan (1999) is installed to calculate the oil concentration distribution in the water column for the farfield simulation.Subsequently, the model is calibrated through comparing the model result with the echo-sounder data observed during the “DeepSpill” experiment with crude oil/LNG discharge.
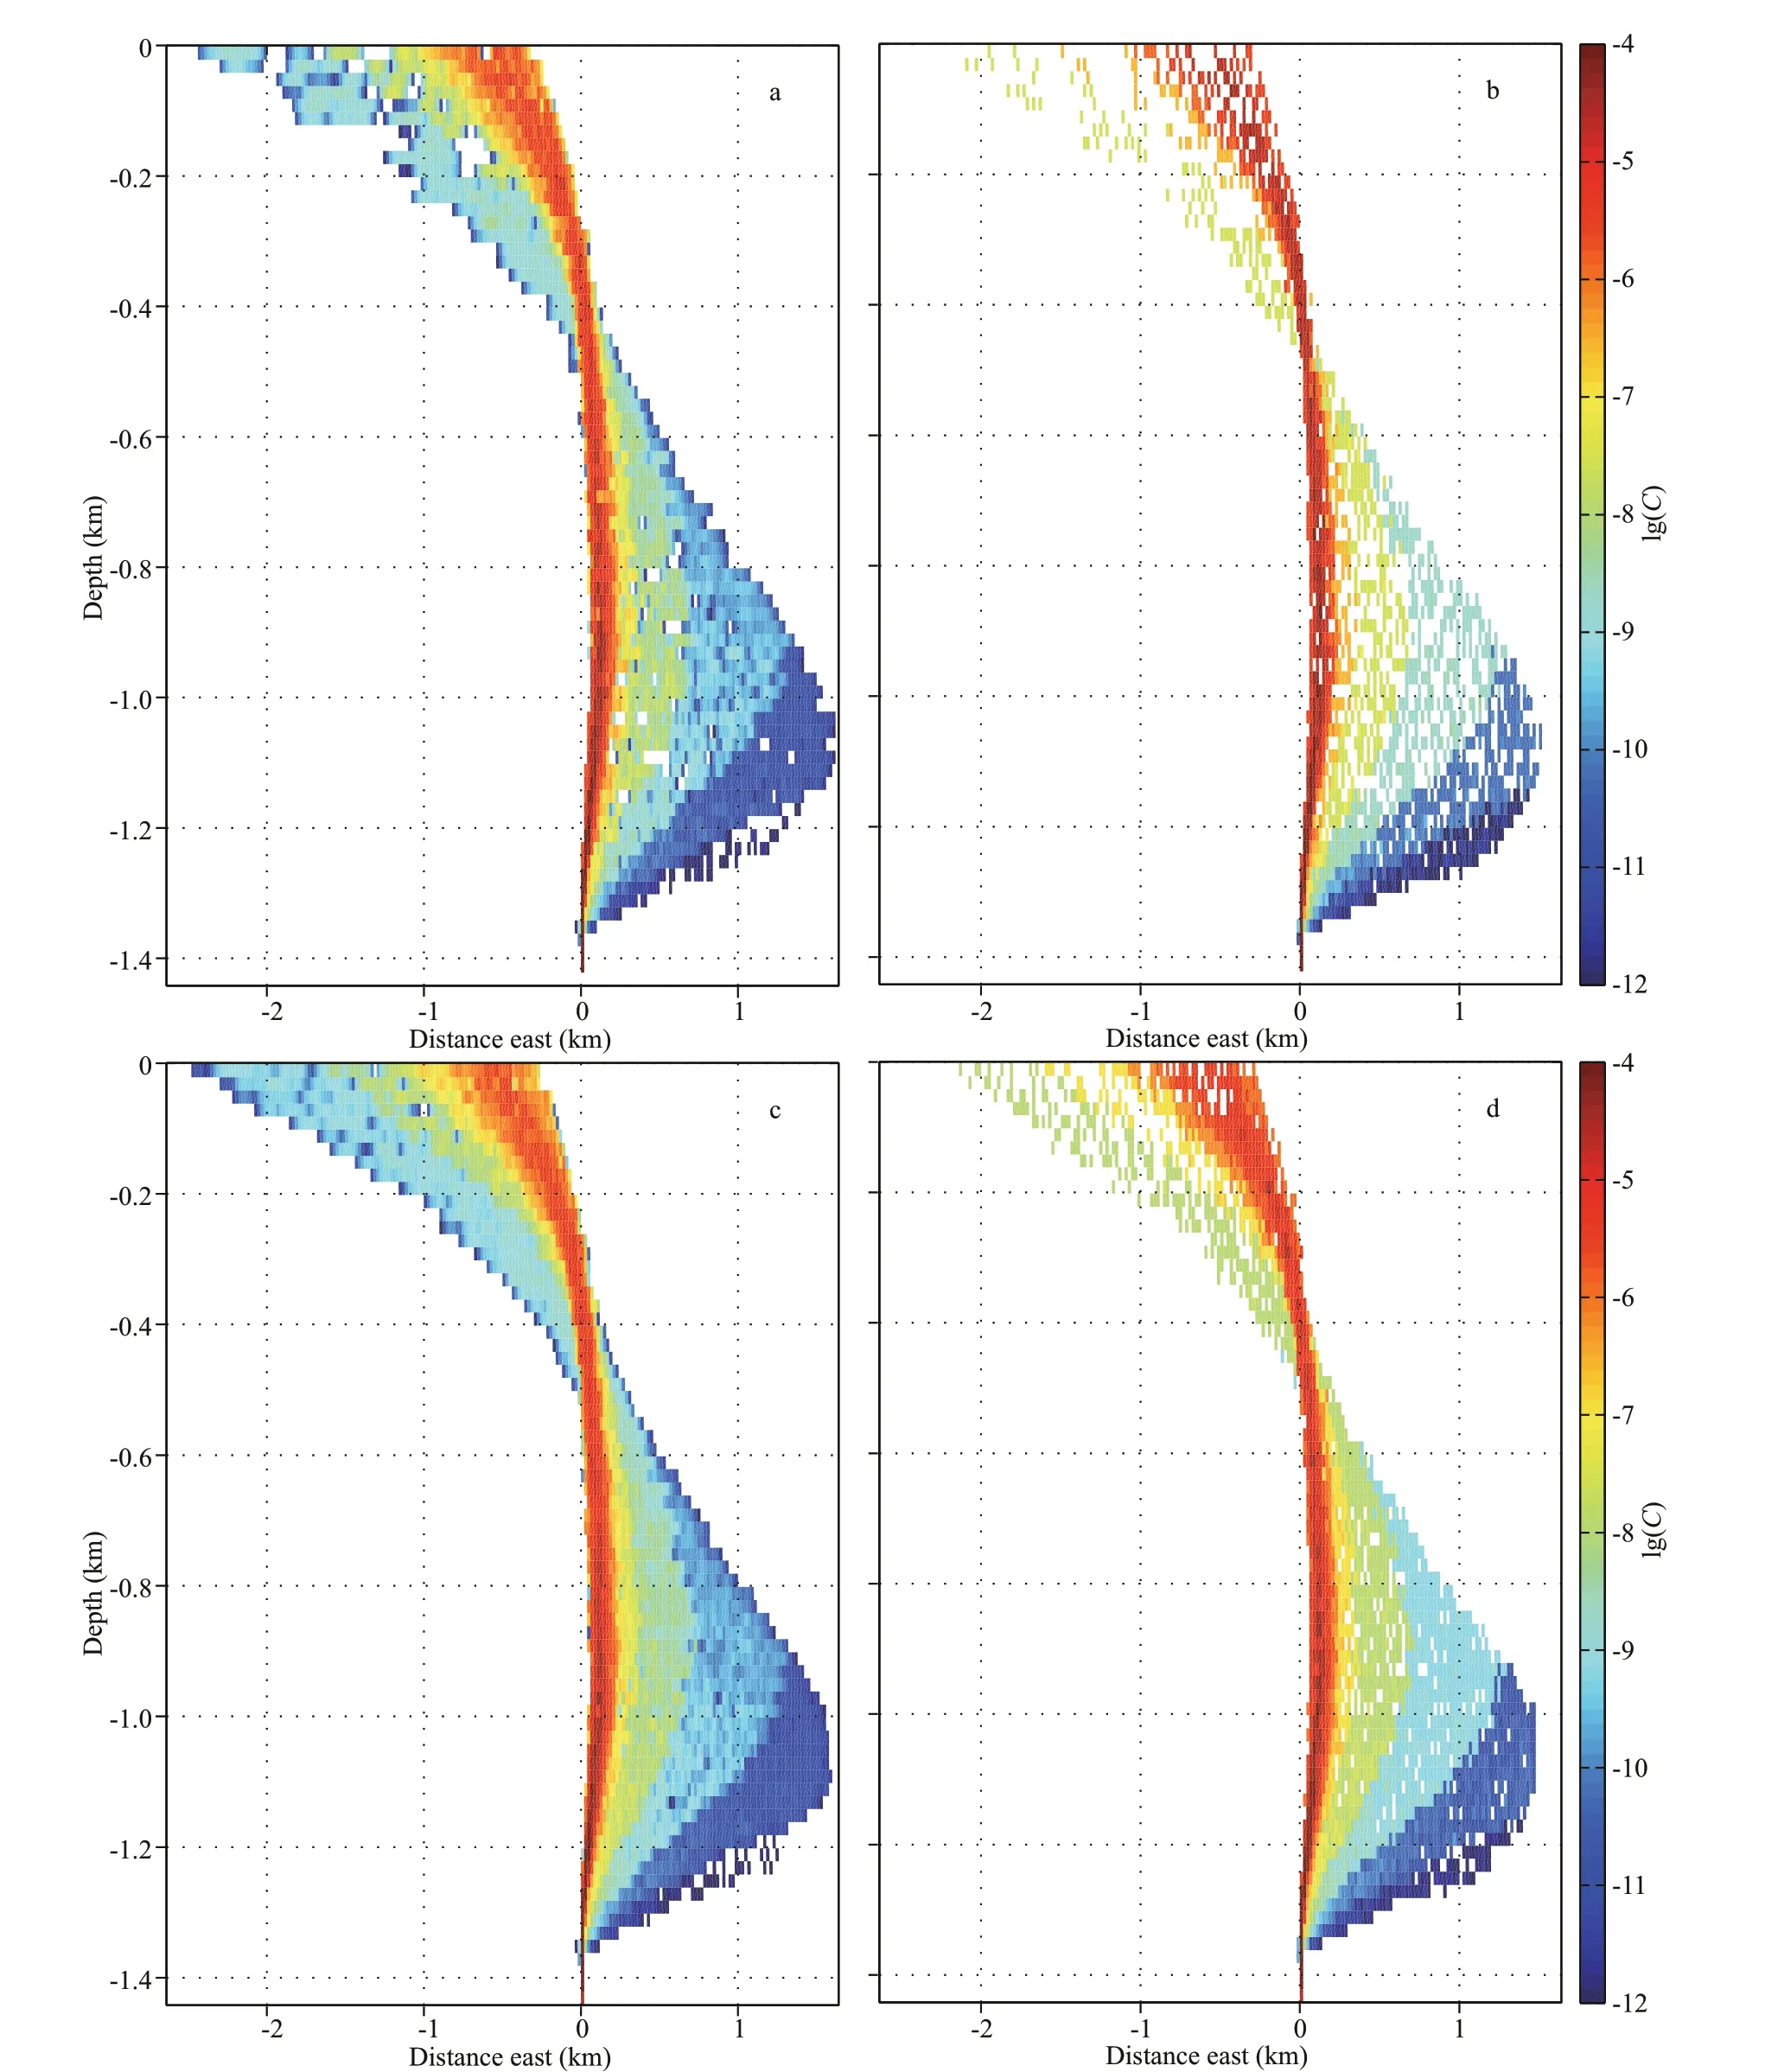
Fig.7 Side views of underwater distributions of oil concentration (oil mass fraction)
The model is applied to two hypothetical scenarios in the deepwater area of the northern SCS,corresponding to the cases with and without subsurface application of chemical dispersants,respectively. Result comparison between the two cases is conducted in terms of the underwater oil concentration distribution. The present study takes in account the impact of chemical dispersants on shortterm (2 days) behavior of the deepwater oil spill through changing the DSD. The model results clearly show that the application of chemical dispersants has a considerable influence on the underwater oil spill process in terms of the underwater oil distribution.This means that, once a deepwater spill event occurs in this area, it may be of practical significance to spray dispersants at the release point. The direct effect of dispersant application is to dramatically increase the fraction of small oil droplets. These small droplets could stay underwater for a long time before arriving at the sea surface due to their slow buoyancy speed.Also, they could be carried a large distance downstream by ocean currents. Due to vertical variation in ocean currents, they could spread over a large sea area. Furthermore, small droplets have relatively large contact area with ambient environment,which potentially facilitates various oil degradation processes. The oil spill model constructed in this study would lay a solid foundation for relevant numerical studies in the future.
As much of decision-making process is driven by predictions from spill prediction models during a spill event, the results of this study can tell regulators the differences made by chemical dispersants in underwater oil distribution, the location and time of oil reaching the sea surface. This can provide valuable reference for spill preparedness and contingency planning for potential underwater oil spill accidents in the SCS, especially when the regulators need to weigh the positive and negative effects of chemical dispersant application on subsequent response actions.
In the future, further more works will be required to improve the model. First, the presence of downward currents can prolong the plume residence time under water. In the northern SCS, they can exist due to active internal waves. Still, no downward currents were taken into account in this study. Second, for multiphase blowouts in deep water, gases may dissolve before they reach the sea surface, and the dissolved gases may change the water density, which was not considered in the present model. Third, the main role of the chemical dispersants in oil spill responses is to promote smaller oil droplet formation,helping to keep oil suspended for longer residence time in the water column. For these dispersed oil,their potential toxicity to planktonic species,biodegradation, and natural attenuation are important aspects that need to be considered during long term oil spill responses and damage assessment. However,the present study did not take these variables into consideration. Finally, although a great amount of oil can be broken into finer droplets due to dispersant application, large oil droplets may still exist due to limited dispersant efficiency. These oil droplets can surface and rapidly form oil slicks within a region that is close to the source. The long-term behavior and fate of the surface oil slicks were not simulated in the present study. We plan these as future developments,so that the model result can provide more valuable information for short term contingency planning as well as long-term damage assessment.
6 DATA AVAILABILITY STATEMENT
The data that support the findings of this study are available from the corresponding author upon reasonable request.
7 ACKNOWLEDGMENT
The authors would like to deeply thank the editors and three anonymous reviewers for their constructive suggestions whereby this work has been improved greatly. We also thank the First Institute of Oceanography, Ministry of Natural Resources, China,for providing the hydrodynamic data used in the study.
 Journal of Oceanology and Limnology2022年3期
- Journal of Oceanology and Limnology的其它文章
- Typhoon-induced wind waves in the northern East China Sea during two typhoon events: the impact of wind field and wave-current interaction*
- Geochemical characteristics of cold-seep carbonates in Shenhu area, South China Sea*
- Examination of seasonal variation of the equatorial undercurrent termination in the Eastern Pacific diagnosed by ECCO2*
- Deviation of the Lagrangian particle tracing method in the evaluation of the Southern Hemisphere annual subduction rate*
- Immunostimulatory effect of quaternary degree and acetyl group of quaternized chitosan on macrophages RAW 264.7*
- Taxonomy and toxin profile of harmful benthic Prorocentrum(Dinophyceae) species from the Xisha Islands, South China Se a*
