Archaeal diversity in the seawater of Changjiang River estuary reveals its adaptability to bottom seawaters*
Yan HUANG, Wu QU, Yingping FAN, Jianxin WANG
Marine Microorganism Ecological & Application Lab., Zhejiang Ocean University, Zhoushan 316022, China
Abstract Archaea regulate the biogeochemical processes of ocean systems. The Changjiang (Yangtze)River estuary (CRE) is a complex and dynamic area strongly affected by seawaters and ocean currents.In this study, the planktonic archaeal communities in the surface and bottom seawaters of the CRE were investigated. Significant differences in the archaeal community composition were found between the surface and bottom seawaters ( P <0.001). Marine Group II (MG-II) was dominant in the surface layers, and Nitrosopumilales was enriched in the bottom layers. Marine Group III (MG-III) was more abundant in the bottom layers than in the surface ones ( P <0.001). These results were completely different from previous findings in the CRE seawater. Instead of dissolved oxygen (DO), temperature and salinity were the most vital environmental variations in the distribution of the archaeal communities. According to the predicted metabolic pathways, the following functional subcategories were enriched in the hypoxic condition:replication and repair, membrane transport, glycan biosynthesis and metabolism, amino acid metabolism,metabolism of cofactors and vitamins, and xenobiotics biodegradation and metabolism ( P <0.001), which indicated the strong adaptability of archaea to the harsh environment in the bottom seawater. These findings expand the understanding on archaeal structure and functions in the surface and bottom seawaters, including the hypoxic zones in the CRE, and may contribute to further works of the archaeal community in the CRE.
Keyword: archaeal communities; adaptability; predicted metabolism; hypoxic zone; Changjiang River estuary
1 INTRODUCTION
In marine environments, microorganisms account for nearly 90% of biomass and 98% of ocean primary productivity and are the key players in biogeochemical processes (Caron, 2005; Sogin et al., 2006).Planktonic bacteria and archaea are important ocean microbial communities with different evolutionary histories. Initial researches revealed that bacteria are distributed globally, and archaea prefer extreme environments, such as psychrophilic and hypersaline environments, deep-sea hydrothermal vents and hot springs (Ochsenreiter et al., 2002; Miroshnichenko,2004; Cavicchioli, 2006; Mirete et al., 2011).However, the applications of molecular technologies in microbial ecology have completely changed our understanding of archaea in marine ecosystems(Schleper et al., 2005). Analysis of 16S rRNA gene sequences from numerous environmental samples showed that archaea are widespread and play important roles in the global carbon and nitrogen cycle. It was also found that Euryarchaeota and Thaumarchaeota dominate most marine environments(DeLong, 1992; Karner et al., 2001; Francis et al.,2005; Wuchter et al., 2006; Kubo et al., 2012; Vila-Costa et al., 2013). The archaeal strains were difficult to be isolated or purified. So far, the marine archaea strains that could be purely cultured were from the phylum Thaumarchaeota, which has made great progress in the physiology, biochemistry, and niche specification (Ingalls et al., 2006; Martens-Habbena et al., 2009; Qin et al., 2017). Most Euryarchaeota have not been cultured; however, their lifestyle was mainly obtained based on metagenome-assembled genomes (Iverson et al., 2012; Deschamps et al.,2014; Martin-Cuadrado et al., 2015). The phylogeny of Euryarchaeota is diverse, including physiologically distinct groups, such as strict anaerobic methanogens,extreme halophiles, and extreme acidophiles(Lewalter and Müller, 2006). The clade Marine Group II (MG-II), which affiliated to Euryarchaeota,is globally distributed in the seas and open ocean(Massana et al., 2000). The identification of proteorhodopsins in genomes derived from the surface water layer indicated that MG-II is a taxon of photoheterotrophs (Frigaard et al., 2006; Pereira et al., 2019). Some subclades can degrade the algalose or protein in the surface layers, and some lack proteorhodopsins in the mesopelagic zones (Tully,2019). These metabolic characteristics make MG-II significant contributors to the global oceanic carbon cycle. Deep ocean environment lacks sunlight and is one of the few ecosystems on the earth that is mainly driven by chemolithoautotrophy rather than photosynthesis (Yakimov et al., 2011).Thaumarchaeota were predominant and regarded as chemolithoautotrophs that use nitrification as a major energy acquiring mechanism in the dark primary production process (Könneke et al., 2005, 2014;Yakimov et al., 2011; Stahl and de la Torre, 2012).Zhong et al. (2020) assembled several thaumarchaeotal genomes, which obtained from the Mariana Trench. Through comparative genomics,and Zhong et al. (2020) predicted unexpected genes involved in bioenergetics, which may be of great help to the success under extreme conditions. Zhong et al. (2020) also found that the clade has genetic potential to import a far higher range of organic compounds than their shallower water counterparts.Michoud et al. (2021) studies the composition of prokaryotic communities in the Red Sea deep halocline found that Thaumarchaeota play an important role in adapting to the changing conditions of the chemocline.
The Changjiang (Yangtze) River estuary (CRE), a transitional zone between the land and open ocean, is a complex and dynamic region suffering from the strong influence of seawaters and ocean currents all year round. In summer, seasonal hypoxia often occurs in the bottom layers of the CRE, which may be caused by Taiwan Warm Current, and the high concentrations of particle organic carbon and nitrogen (Li et al.,2002). In addition, it is common in some estuaries,such as the Zhujiang (Pearl) River estuary (Liu et al.,2014; Orita et al., 2015). Hypoxia may be caused by water stratification and the decomposition of deposited organic matter from rivers mediated by microorganisms (Diaz and Rosenberg, 2008; Lohrenz et al., 2008; Grenz et al., 2010).
Estuaries have always been hotspots for biogeochemical cycling. Many high-throughput sequencing studies were conducted on the distribution of microbial communities in estuaries (Liu et al.,2014, 2015, 2020; Ye et al., 2016; Wu et al., 2019).However, only a few works have explored the distribution of archaeal community structure in the CRE. Zeng et al. (2007) found the main groups in the seawater of the CRE were Marine Group I (MG-I),which was affiliated to the phylum Thaumarchaeota,and MG-II. Moreover, MG-I dominated the surface layers. Dang et al. (2008) proposed that ammoniaoxidizing archaea (AOA) are unique in the seawater of the CRE mixing zone, and its community distribution is crucially related to salinity and sediment sorting coefficient. Liu et al. (2011) found similar results to Zeng et al. (2007) by denaturing gradient gel electrophoresis technology and proposed that MG-II is the abundant group in the bottom seawater and salinity seriously affects the archaeal community composition. He et al. (2016) found that AOA were substantially related to nitrite in the CRE sediments.
Although research progress has been achieved regarding archaeal distributions in the ocean, the adaptive mechanism of archaea communities to the corresponding environments in the CRE remains unclear. In this study, the structures and adaptability of archaeal community in surface and bottom water layers of the CRE were determined through 16S rRNA gene analysis and metagenomic functional prediction. The results may lay the foundation for the functional researches of archaea in estuaries.
2 MATERIAL AND METHOD
2.1 Sample collection and physicochemical measurements of seawater
During a summer cruise in July 2016, 24 seawater samples were collected from 12 stations in the CRE(Fig.1). Seawater from the surface (1.9-2.1-m depth;S) and bottom layers (26-60-m depth; B) was collected at each site (Table 1) by using Niskin bottles mounted on an SBE32 CTD (Sea-Bird Electronics).Each 2 L of seawater sample was pre-filtered through a 3-μm pore size filter (Millipore Corporation,Billerica, MA, USA) with a gentle vacuum pressure<33.3 kPa and then re-filtered with a 0.22-μm filter to collect free-living microbial cells. The 24 filters with the pore size of 0.22 μm were temporarily stored at-20 °C on board and then transferred to -80 °C in the laboratory until DNA extraction. The 24 samples were divided into two groups: surface and bottom.Each sample was named with the location name,followed by the abbreviation of the layer. For example,the C3S sample means sampling from the surface seawater in the C3 site.
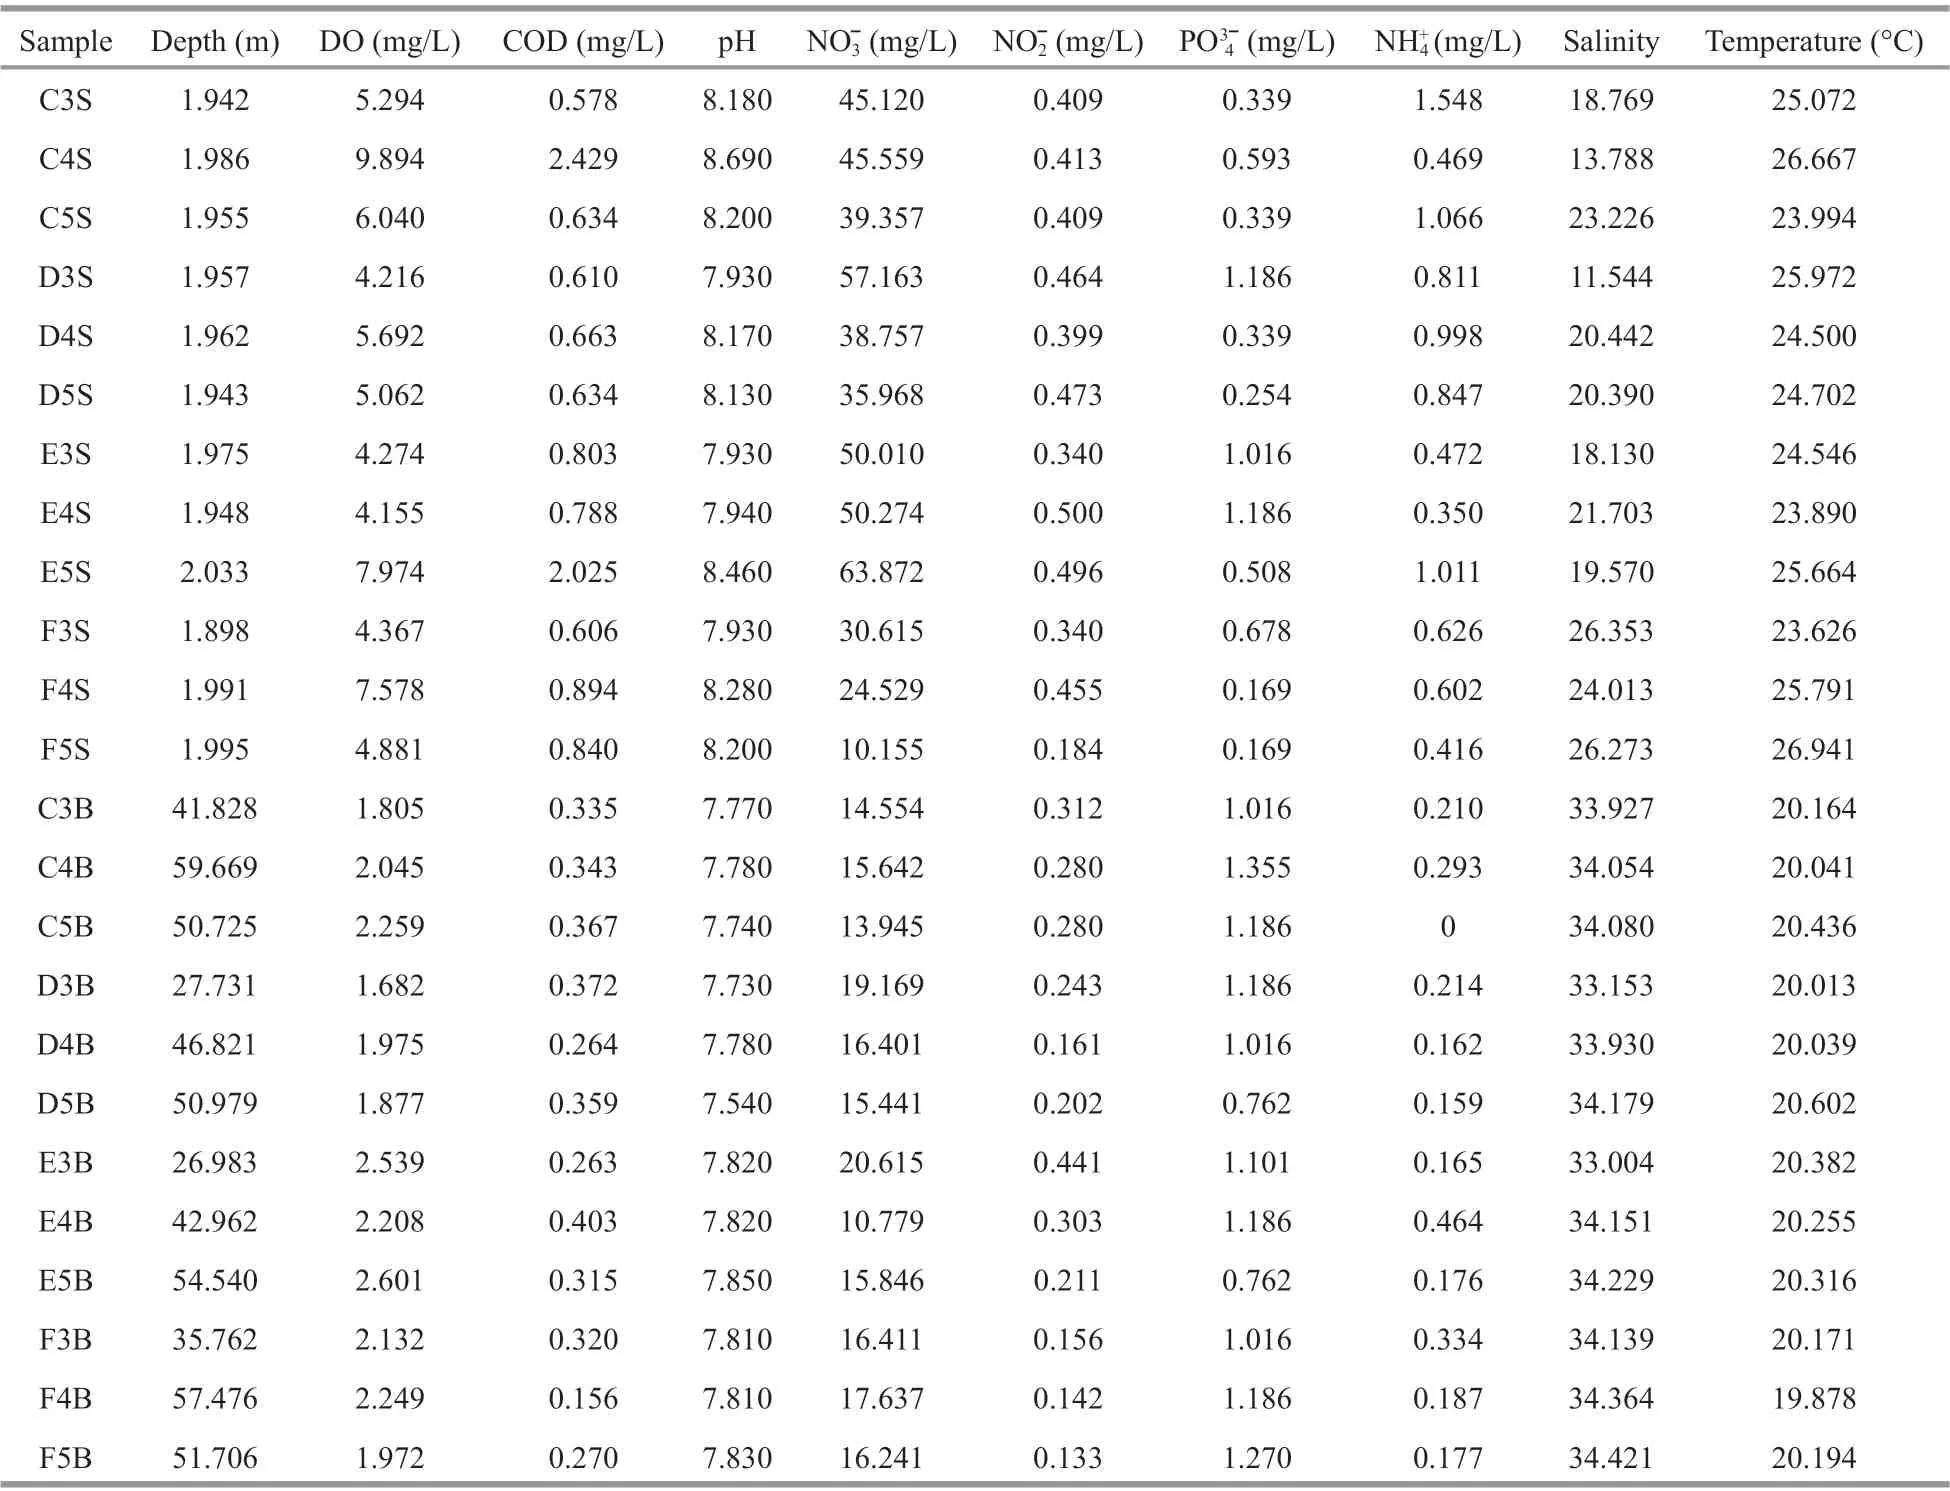
Table 1 Environmental and physicochemical factors of the seawater from two layers (surface and bottom) of the 24 samples in the 12 sites in the Changjiang River estuary
Seawater physicochemical parameters, including depth, salinity, and temperature, were measured by CTD in situ. Other parameters, such as the concentration of nitrate (NO3ˉ), nitrite (NO2ˉ),ammonium (NH4+), chemical oxygen demand (COD),phosphate (PO43ˉ), and dissolved oxygen (DO), were measured following the specifications for marine monitoring prior to chemical parameter analysis (Wu et al., 2019).
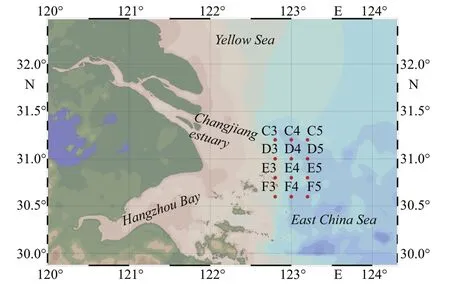
Fig.1 A map showing the study areas in the Changjiang River estuary
2.2 DNA extraction, PCR, and sequencing
The DNA of the 24 samples was extracted with a FastDNA spin kit for soil (MP Biomedicals, USA) in accordance with the specification. The DNA extracts were quantified using a NanoDrop 2000 (Thermo Fisher Scientific, USA) and then sent to Biozeron Company (Shanghai, China) for 16S rRNA gene amplification (V4-V5 region) using dual-indexed archaeal barcoded primer pairs 524F(5′-TGYCAGCCGCCGCGGTAA-3′) and 958R(5′-YCCGGCGTTGAVTCCAATT-3′). Prior to PCR,the 12-bp barcode sequences were linked to the primers during primer synthesis. Each DNA sample was amplified as an undiluted template and at a 1∶10 template dilution to reduce the potential effects of PCR bias. The 16S amplicons were pooled together and their quality was verified by Bioanalyzer (Agilent Technologies). Following dilution, the library pool was quantified by quantitative-PCR. Finally, the pooled samples were run on the Illumina HiSeq platform. Raw sequence files are available at the NCBI Sequence Read Archive under accession SUB6193127.
2.3 Sequence quality control and amplicon sequence variant (ASV) assignment
The raw reads FASTQ files were processed and analyzed using the QIIME 2 bioinformatics program(Bolyen et al., 2019). Plugin “qiime tools import” was used to import the raw FASTQ data by a manifest file including the samples’ IDs and absolute pathways.Barcodes and primers were removed by the plugins“qiime cutadpt demux-paired” and “qiime cutadapt trim-paired”, respectively. Plugin “qiime dada2 denoise-paired” was used to perform quality filtering,denosing and chimera removal to cluster the sequences into ASVs (i.e., the representative sequences). After the base with average quality lower than 20 were removed, the average length of reads was 455 bp. A total of 780 721 sequences were obtained after denosing and chimera removal. Finally, plugin “qiime feature-classifier classify-sklearn” was used to assign taxonomy with Silva 132 database (16S rRNA gene;97% similarity level) trained by the primers used in this study (Quast et al., 2012).
Nitrosopumilales and Marine Group III (MG-III)were the focus of analysis. These orders were aligned against the GenBank database in National Center for Biotechnology Information (NCBI, http://www.ncbi.nlm.nih.gov) data and the top-hit sequence was downloaded for each ASV. The cloned and ASV sequences of Nitrosopumilales and MG-III were used to construct the phylogenetic trees, respectively by using the neighbor-joining (NJ) methods and MEGA-X with Tanura-Nei model (Kumar et al.,2018). The tree topologies were checked by 1 000 bootstrap.
2.4 Statistical analysis
For diversity analysis, the ASVs table was used to calculate the alpha and beta diversities in R v4.0 (R Core Team, 2013). Package picante was applied to calculate the diversity and richness indexes (Shannon,Chao1, and Simpson) (Lee and Chao, 1994; Kembel et al., 2010). Alpha diversity indexes were analyzed with the function “ggsignif” in the “ggplot2” package to compare the diversities and richness of archaeal communities in the two groups (surface and bottom seawater layers) (Wickham and Chang, 2009). Beta diversity was explored with the Bray-Curtis dissimilarity index by the function “vegdist” of the“vegan” package (Bray and Curtis, 1957; Oksanen et al., 2010). Complete linkage hierarchical clustering based on Bray-Curtis dissimilarity using the normalized ASVs matrix was performed using the package “vegan” (Oksanen et al., 2010). Non-metric multidimensional scaling (NMDS) analysis was also conducted with normalized ASVs using the “vegan”and “ggplot2” packages (Wickham and Chang, 2009).Co-occurrence networks were constructed for archaeal communities in all the samples, and ASVs affiliated with Nitrosopumilales, MG-II, and MG-III were included in analysis. The correspondences between the ASVs and the groups were formed the edges, while selected ASVs served as network nodes.The edge and the node files were formed in R (R Core Team, 2013), and the network topology were shaped in Cytoscape (Baryshnikova et al., 2016).
Redundancy analysis (RDA) combined with 999 Monte Carlo permutation was employed with “vegan”package in R to analyze the influence of environmental factors on archaeal communities (Oksanen et al.,2010). Hellinger was used to standardize the ASV data and the dissimilarity in environmental factors was log-transformed. A heatmap was plotted to visualize the Spearman correlations between the environmental factors and ASVs of Nitrosopumilales with “pheatmap” package in R (Wickham and Chang,2009). Principal component analysis (PCA) was performed with “vegan” package in R based on the relative abundance of different individual pathways to analyze the relationship among archaeal communities and environmental factors (Oksanen et al., 2010).Hellinger was also used to standardize the relative abundance of pathways.
2.5 Prediction of functionality of archaeal communities
Phylogenetic Investigation of Communities by Reconstruction of Unobserved States (PICRUSt2)was used to predict the functional potential of prokaryotic community based on marker genes,particularly 16S rRNA genes (Ye and Doak, 2009).ASV sequences were used to clustered into a reference tree to predict functions, which were pre-calculated for genes in databases including Kyoto Encyclopedia of Genes and Genomes (KEGG) and Clusters of Orthologous Groups of proteins (COG). Script“picrust2_pipeline.py” was used to predict the functions of the archaeal ASVs and received the predictions for enzyme commission (EC) number metagenome, KEGG orthology (KO) metagenome,and pathway abundance. Script “pathway_pipline.py” was employed to collapse the predictions at the level of the individual pathways. Linear discriminant analysis effect size (LEfSe) was used to test the data for statistical significance, and biological consistency was applied to identify differentially abundant pathways between the surface and bottom seawaters(Segata et al., 2011). Cladogram plot was presented hierarchically with category, subcategory, and individual pathways. Linear discriminant analysis(LDA) scores were calculated, and the barplots for the relative abundance ofindividual pathways were displayed. PCA biplot was constructed based on relative abundance ofindividual pathways to understand the relationship among archaeal communities and environmental factors.
3 RESULT
3.1 Environmental factors in seawaters
The physicochemical parameters of 24 samples from 12 sites are summarized in Table 1. Most environmental factors changed vertically in the 12 sites (Supplementary Fig.S1). Temperature, pH, and the concentrations of COD, NO2ˉ, NO3ˉ, NH4+, and DO in the surface layers were significantly higher than those in the bottom ones (P<0.01), whereas salinity and the concentration of PO43ˉ in the surface layers were significantly lower than those in the bottom ones(P<0.001). In this study, the DO concentration in the surface water layers was greater than 4 mg/L, whereas that in the bottom layers was less than 2.6 mg/L. In accordance with the definitions (Li et al., 2011), the surface layers were called oxic ones, and the bottom layers were called hypoxic zones.
3.2 Diversity of archaeal community and community comparison
The 24 samples yielded 782 095 high quality archaeal sequences ranging from 23 734 to 38 164(Supplementary Table S1). A total of 121 ASVs were generated from the 24 samples at a 97% similarity level. Normalized Shannon and Chao1 indexes were used to represent the diversity and richness,respectively. The Shannon index of archaea ranged from 1.62 to 3.83, and its Chao1 index ranged from 24 to 48 (Supplementary Table S1). The Shannon and Chao1 indexes in the bottom layers were significantly higher than those in the surface layers (P<0.05,Wilcoxon test, Supplementary Fig.S2), indicating that the bottom layers had higher archaeal diversity and richness than the surface ones.
Beta diversity was used to explore the transition of archaeal diversity in different environments.Hierarchical clustering dendrogram showed the separation of archaeal community composition from the surface layers to the bottom layers (Fig.2a).NMDS analysis also separated the samples from the depth by the first axis (Fig.2b). Analysis of similarity(ANOSIM) tested the dissimilarity of all the samples based on the Bray-Curtis distance and also confirmed the significant difference in the archaeal community composition between the depth groups (R=0.992 6,P=0.001).
3.3 Taxonomic assignment
All sequences were classified into two main phyla,Euryarchaeota and Thaumarchaeota (99.8%-100% of the total population), with a few belonging to Crenarchaeota, Diapherotrites, Hydrothermarchaeota,and Nanoarchaeaeota. The two major phyla displayed different distribution patterns in the two layers of the CRE (Fig.3a). Euryarchaeota (P<0.001) accounted for the most abundant proportion of archaea in the surface samples, and Thaumarchaeota (P<0.001) was the most enriched in the bottom zones. The archaeal communities at the class level mainly belonged to two main classes: Thermoplasmata and Nitrososphaeria,which are affiliated to Euryarchaeota and Thaumarchaeota, respectively (Supplementary Table S2). Some rare taxa mostly existed in the bottom layers. For example, Bathyarchaeia was found in C4B, D5B, F3B, and F4B, and Woesearchaeia was observed in C5B and D5B. At a fine taxonomic resolution, MG-II and Nitrosopumilales were prevalent across all samples. MG-II was relatively abundant in the surface layers, and Nitrosopumilales was more predominant in the bottom ones. In all samples, the most abundant order in E5S was MG-II(93.97%), and in C3B was Nitrosopumilales(74.87%). Notably, MG-III (P<0.001), which is affiliated to Euryarchaeota, was highly abundant in the bottom layers. C4B contained relatively high percentages of MG-III (9.14%), followed by F5S(4.95%).
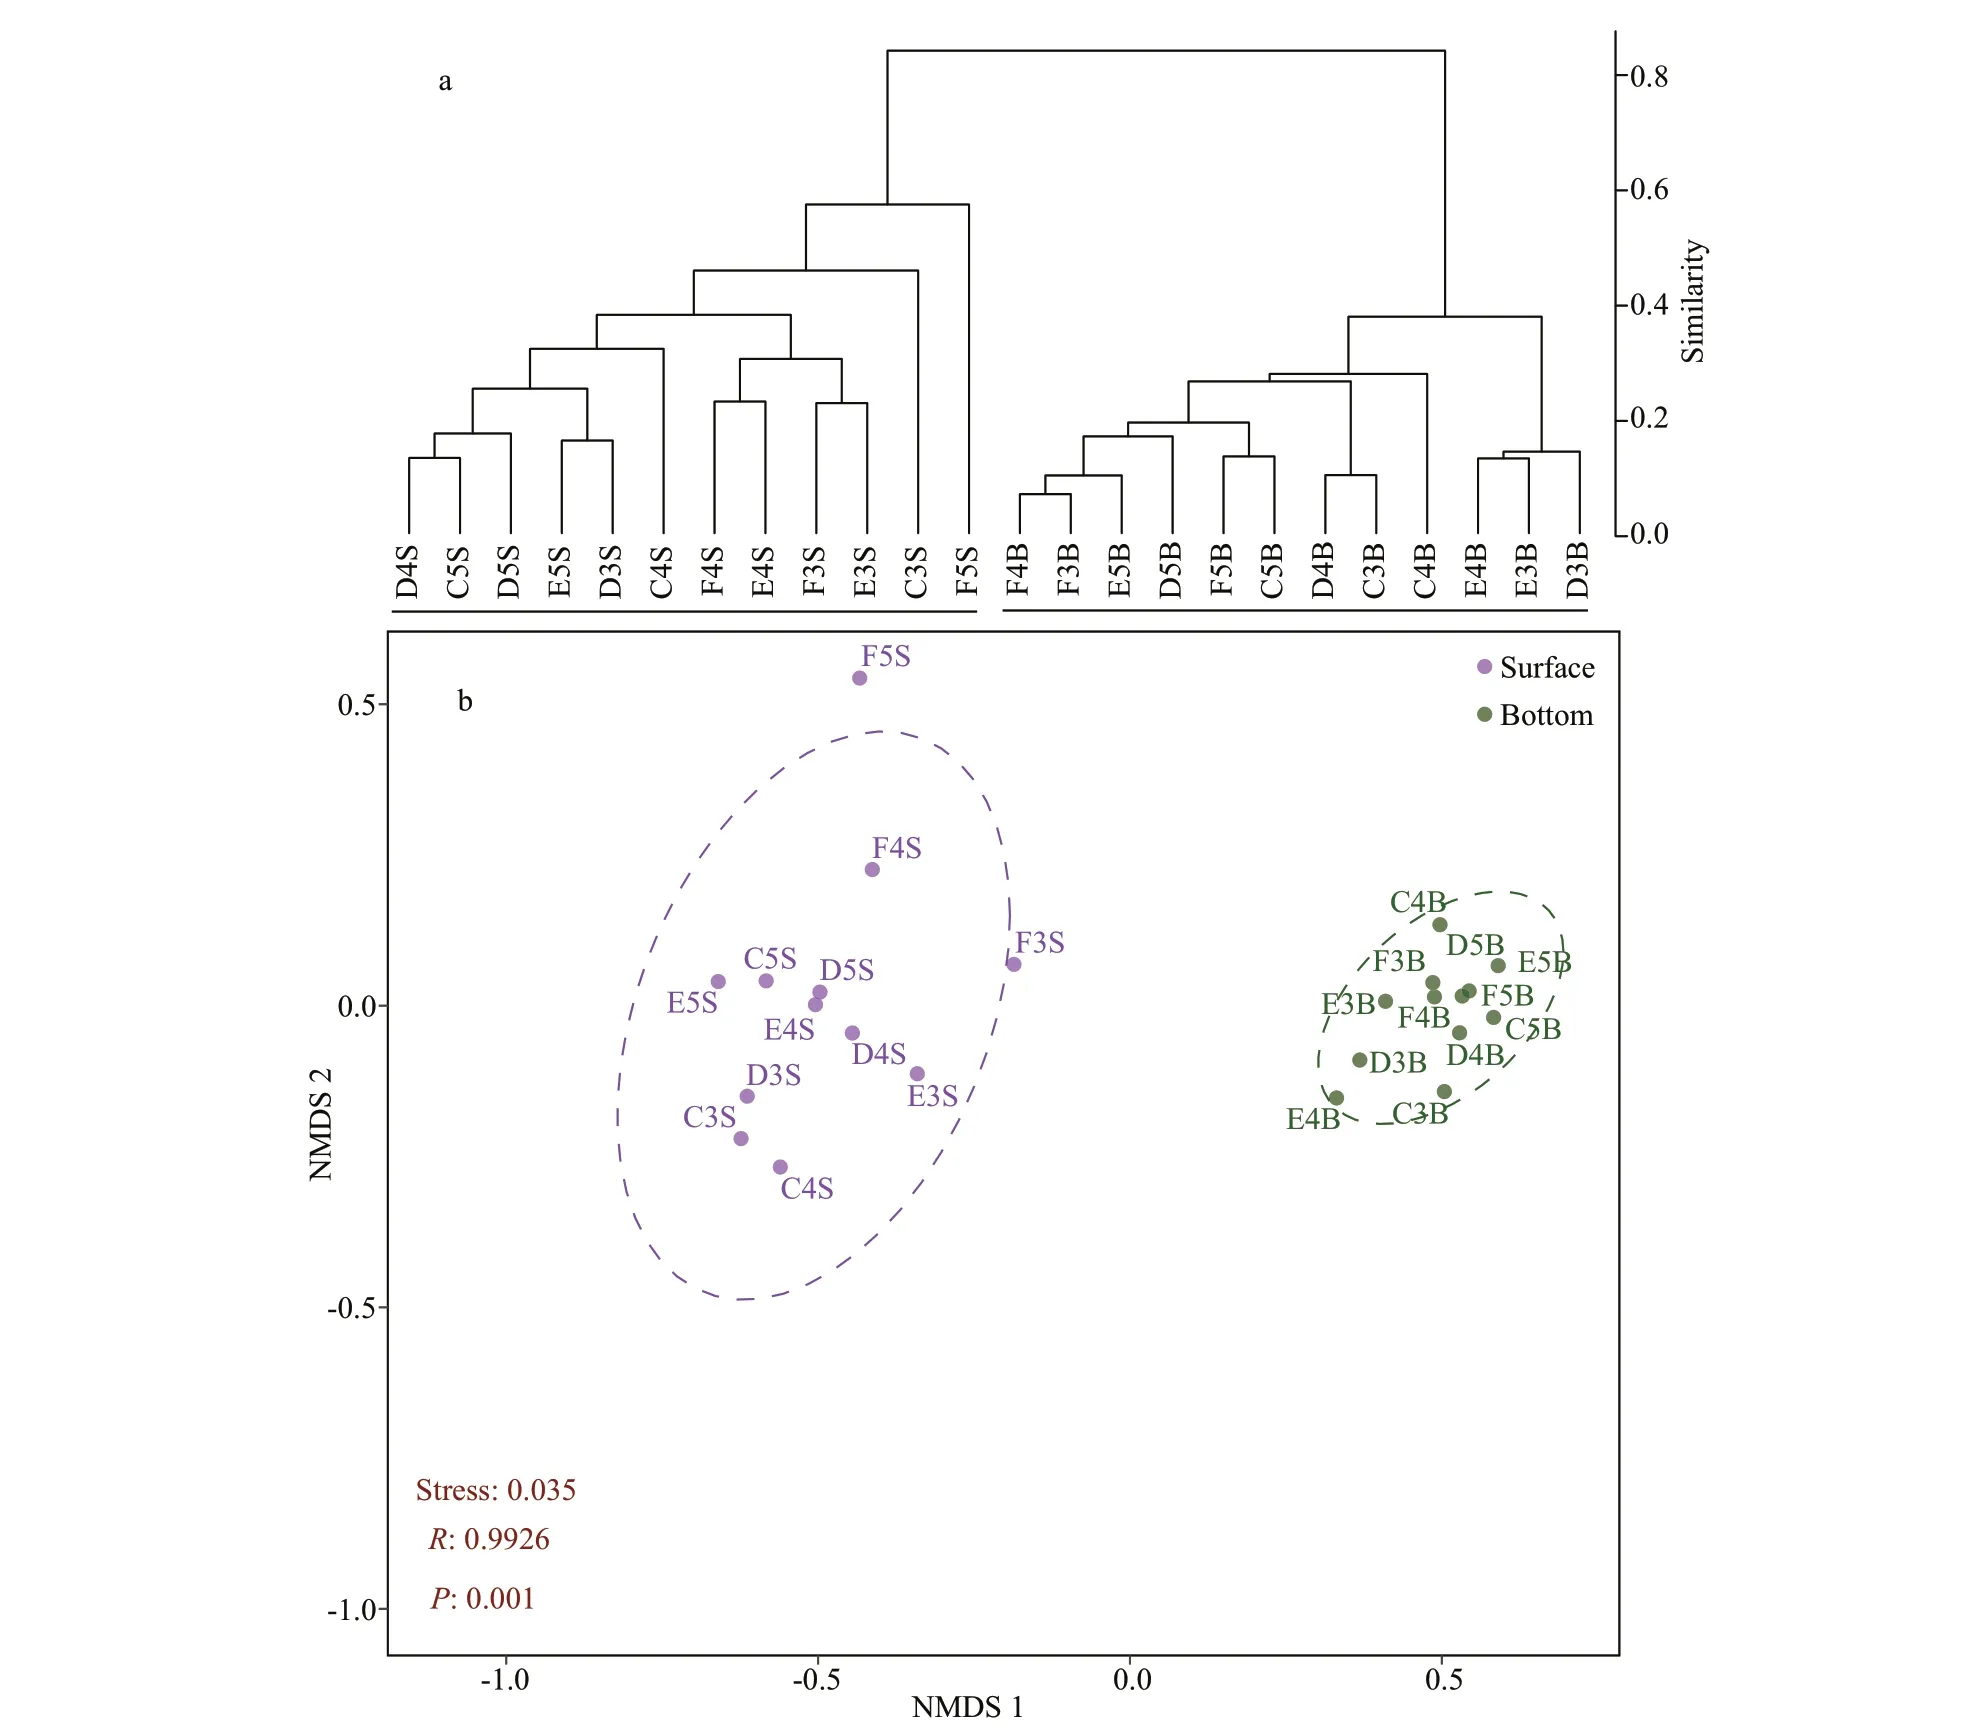
Fig.2 Bray-Curtis dissimilarity based dendrogram showing the clustering of samples using the archaeal amplicon sequence variants (ASVs) (a); non-metric multidimensional scaling (NMDS) results showing the relationship among all the samples based on the archaeal community composition using ASVs (stress=0.035) (b)
The co-occurrence network also showed the distribution of the ASVs of MG-II, MG-III, and Nitrosopumilales in the two layers (Supplementary Fig.S3). Most ASVs of MG-II were distributed in both layers, while Nitrosopumilales and MG-III were mainly distributed in the bottom seawater.
3.4 Correlation between archaeal communities and environmental variations
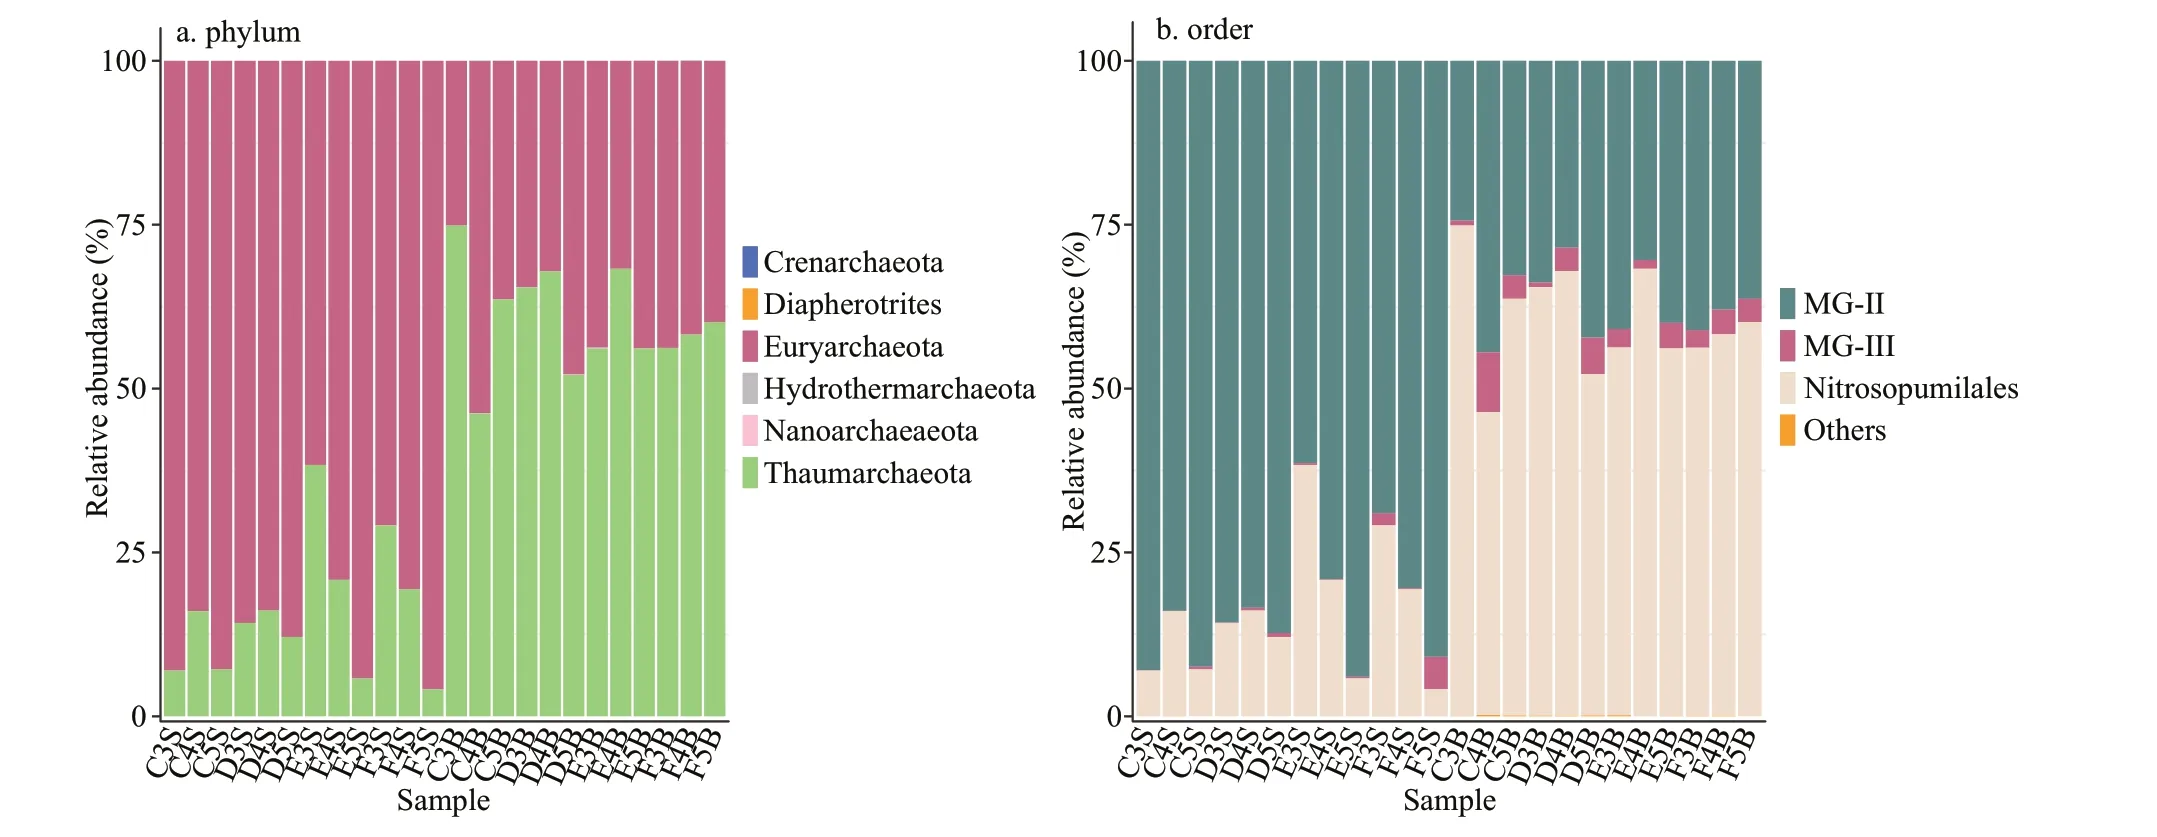
Fig.3 Archaeal community compositions at different taxonomic levels in each seawater sample
From all samples, 40 ASVs of MG-II, 4 ASVs of MG-III, and 25 ASVs of Nitrosopumilales were extracted for reducing complexity and eliminating rare taxa. RDA was used to analyze the variation of archaeal communities as a function of environmental factors including salinity, temperature, DO, NO3ˉ,NO2ˉ, NH4+, COD, PO43ˉ, and pH. RDA1 and RDA2 explained 80.81% of the total variations (Fig.4). On the horizontal axis (RDA1, 74.3% of constrained variability), the most influential constraining variable was temperature (biplot score=-0.97) followed by DO (biplot score=-0.93) and salinity (biplot score=-0.89). The sites were distinctly separated into two groups (surface and bottom layers,P<0.001) by RDA1. F5S relatively deviated from the 95%confidence interval of the surface groups, and the bottom groups gathered closely. On the horizontal axis (RDA2, 8.03% of constrained variability), the most influential constraining variable was NO3ˉ(biplot score=0.50), followed by PO43ˉ (biplot score=0.44). Function “envfit” was used to measure each factor onto an ordination. Salinity and temperature were significantly related to the archaeal community (Supplementary Table S3,P<0.001). In addition, the ASVs of MG-II and Nitrosopumilales was separated by RDA1 (P<0.05), indicating that most ASVs of the two groups prefer different biotopes.
A heatmap of Nitrosopumilales (25 ASVs) and the environmental factors was constructed to determine the relationship between Nitrosopumilales and environmental factors (Supplementary Fig.S4). The ASVs were sorted according to the relative abundance.Except for ASV24, ASV8, and ASV55, the top 20 ASVs were positively related to PO43ˉ, depth, and salinity and negatively related to other factors. Except for ASV24, most of the top 10 ASVs were correlated with all the environmental factors (|R|>0.40) and displayed coordinated relationships with each factor.
3.5 Phylogenetical diversity of Nitrosopumilales and MG-III
Compared with archaeal communities in the surface water, Nitrosopumilales and MG-III were more abundant in the bottom layers. The NJ trees of the ASVs affiliated to Nitrosopumilales and MG-III,respectively. The Nitrosopumilales phylogenetic tree identified two major clusters (Fig.5a). Most ASVs were relatively abundant in the bottom layers, and others were abundant in the surface layers. For example, ASV24, ASV55, ASV36, and ASV61 were more abundant in the surface layers than in the bottoms and were clustered in another branch. In addition, most sequences of genetically close species downloaded from the NCBI nt database were derived from deep seawater, sediments, or the hypoxic zones,such as the northeast Pacific Ocean and the northern Gulf of Mexico.
The MG-III phylogenetic tree also identified two clusters (Fig.5b). The sequences in one cluster were mainly recovered from the deep seas, and those in the other cluster were from the surface seawater or hypoxic areas. ASV50, which was assigned into the second cluster, occurred in both layers.
3.6 Predicted metabolic potentials
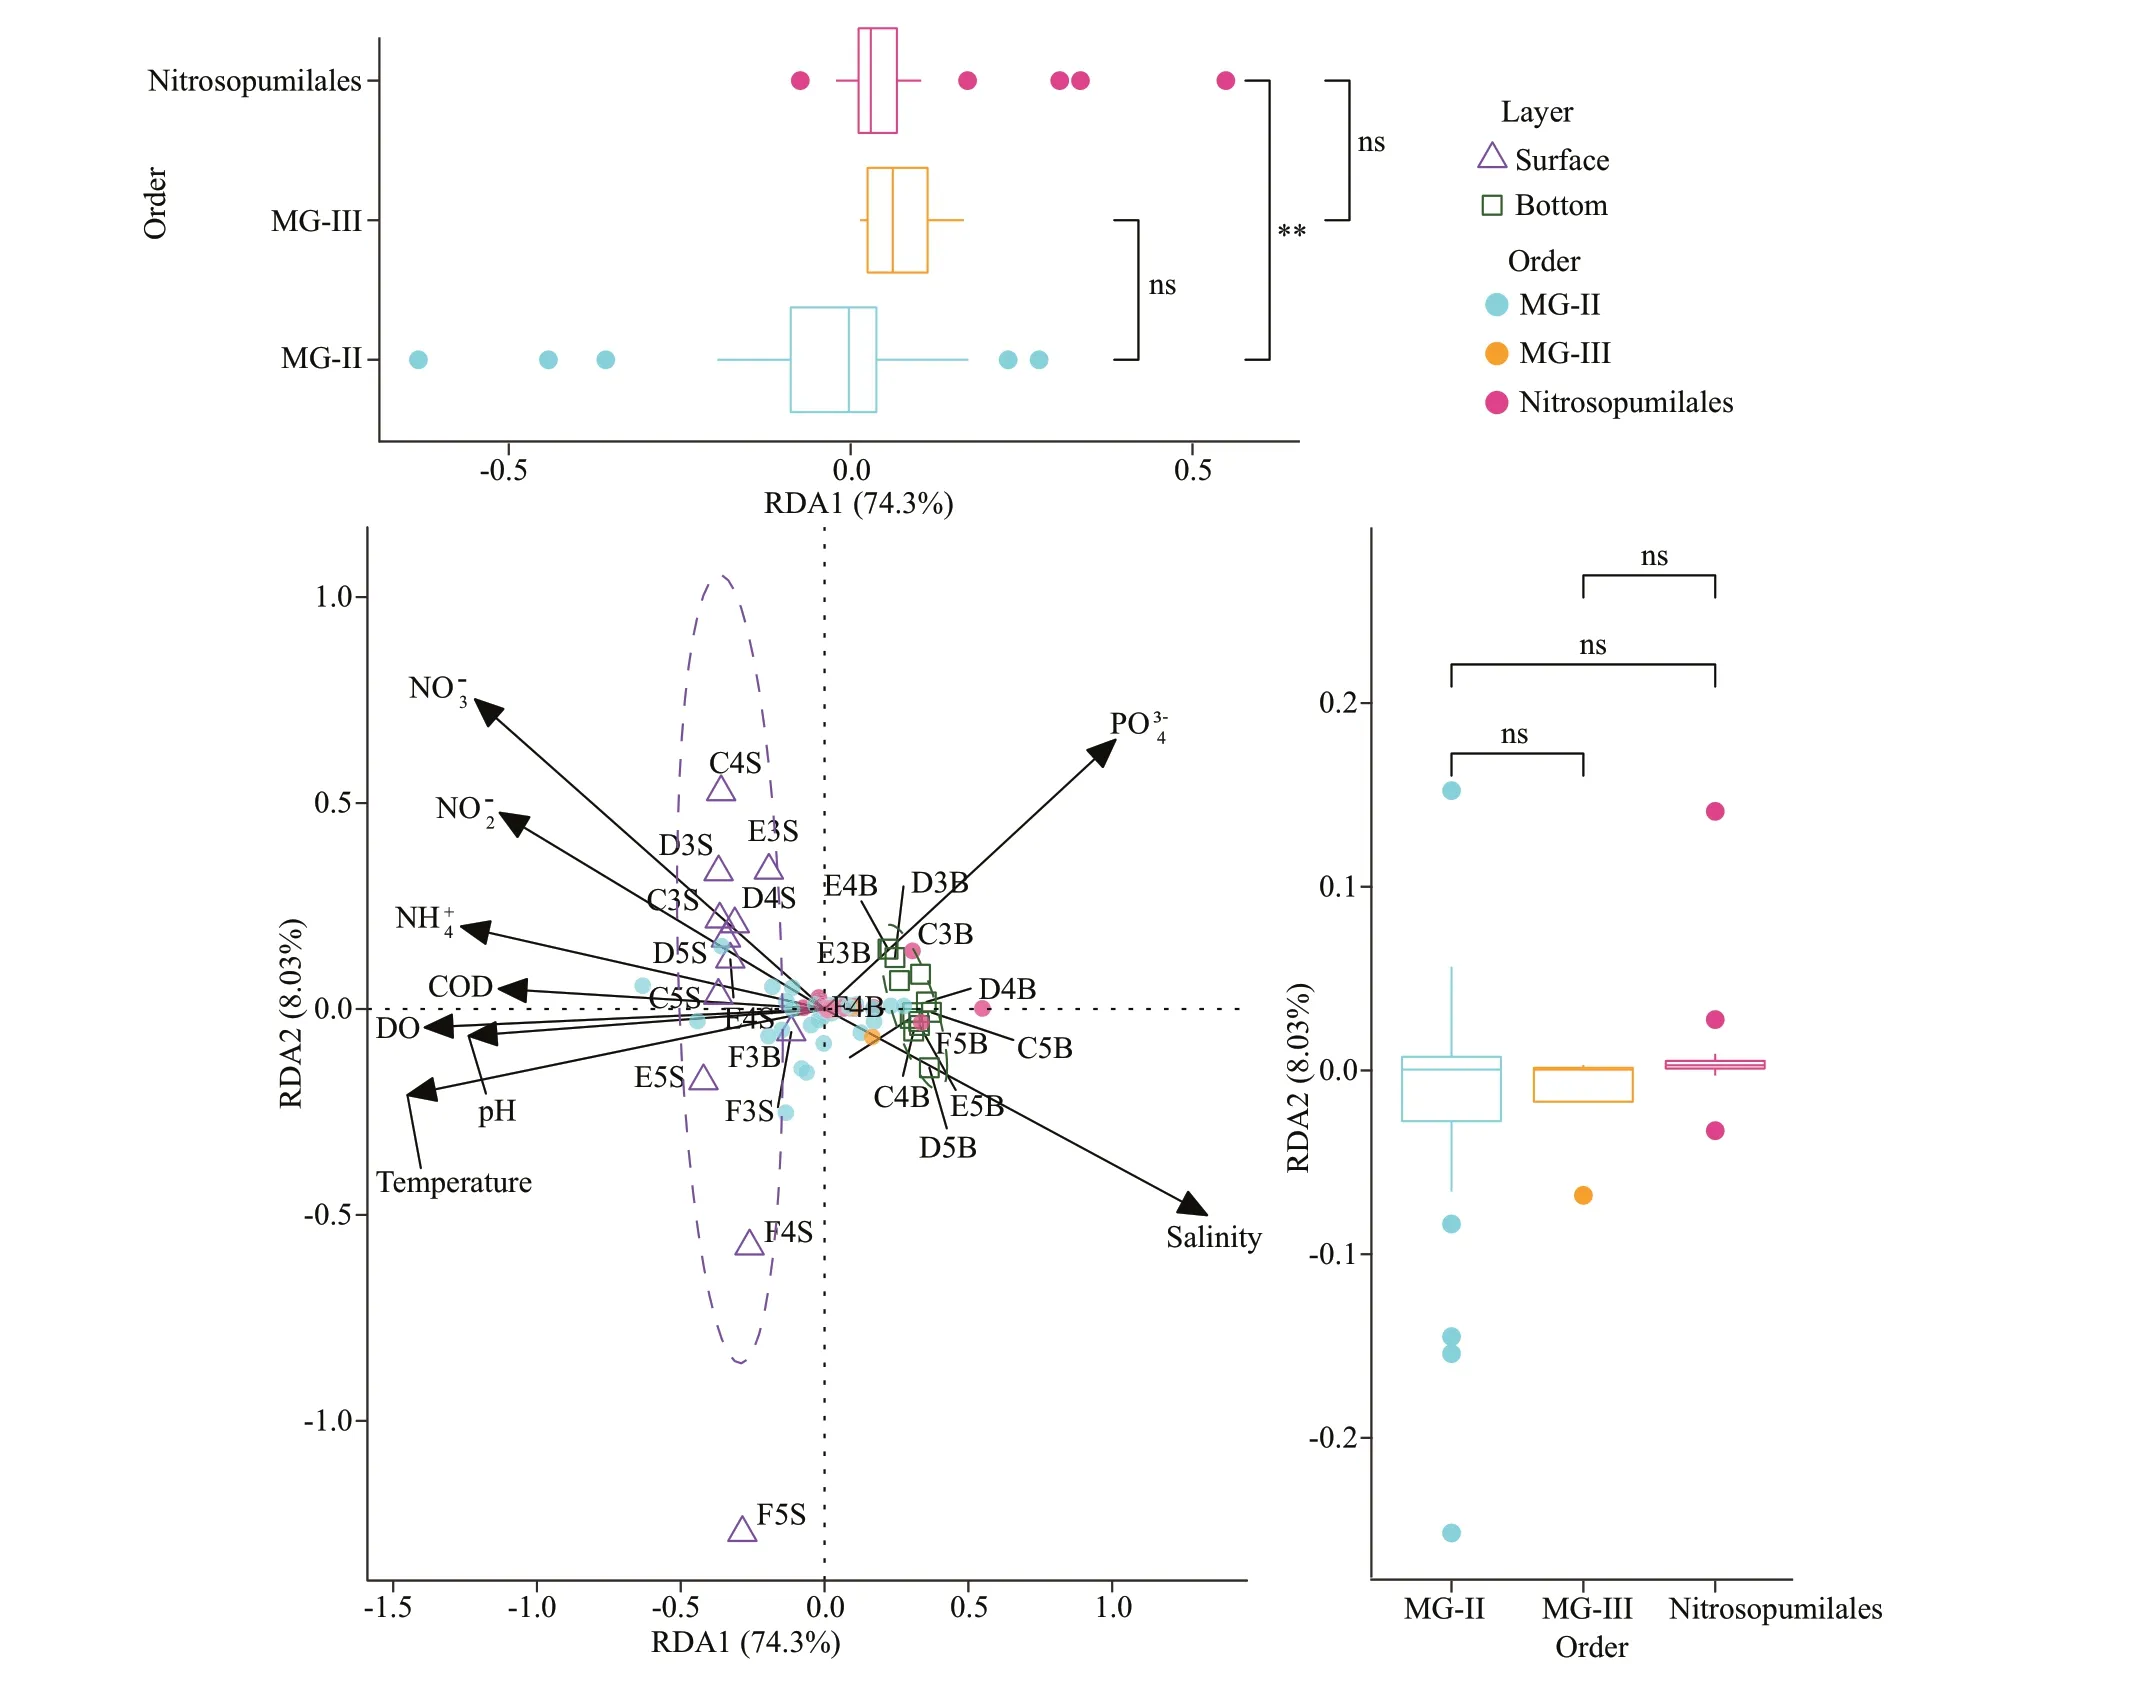
Fig.4 Archaeal community composition associated with environmental factors
PICRUSt2 analysis detected 78 individual pathways. LEfSe was used to reveal the significant differences of the metabolic functionality between the two water layers (Fig.6, Supplementary Table S3). In the functional categories, the surface layers were enriched with genetic information processing(P<0.001), and the bottom layers were enriched with environmental information processing (P<0.001),cellular processes (P<0.001), and organismal systems(P<0.001). Several functional subcategories, including“cell growth and death”, “folding, sorting and degradation”, “translation; amino acid metabolism”,“carbohydrate metabolism”, “metabolism of terpenoids and polyketides” and “nucleotide metabolism” were significantly higher (P<0.001) in the surface layers compared to the bottom ones.Subcategories, such as “cell motility,” “membrane transport,” “replication and repair,” “biosynthesis of other secondary metabolites,” “energy metabolism;glycan biosynthesis and metabolism,” “lipid metabolism; metabolism of cofactors and vitamins,”“metabolism of other amino acids,” and “xenobiotics biodegradation and metabolism” were enriched in the bottom layers (P<0.001). The boxplot showed the significant enrichment in the bottom layers(Supplementary Fig.S5,P<0.001). Functional subcategories, such as replication and repair, amino acid metabolism, carbohydrate metabolism and metabolism of cofactors and vitamins, were abundant in the bottom layers. Individual pathways, such as chemotaxis, basal transcription factors, sulfur metabolism, biotin metabolism, and biosynthesis of vancomycin group antibiotics, were significantly enriched in the bottom layers (P<0.001). The PCA plot constructed based on relative abundance of different metabolisms presented the clustering of the samples. All surface and bottom samples formed two distinct clusters by the first axis (Supplementary Fig.S6,P=0.001). Similar clustering was observed in the RDA and NMDS analysis (Figs.2 & 4) which was conducted because of the archaeal community composition. A similar trend was obtained with different statistical analyses based on community composition and predicted community function,indicating that different archaeal communities reflect the community function. In addition, the environmental factors driving the predicted metabolic pathways were similar to those actuating the taxonomic composition.Temperature and salinity were also the main important chemical factors that explained most of the variations(P<0.01,R2>0.8; Supplementary Tables S4 & S5).
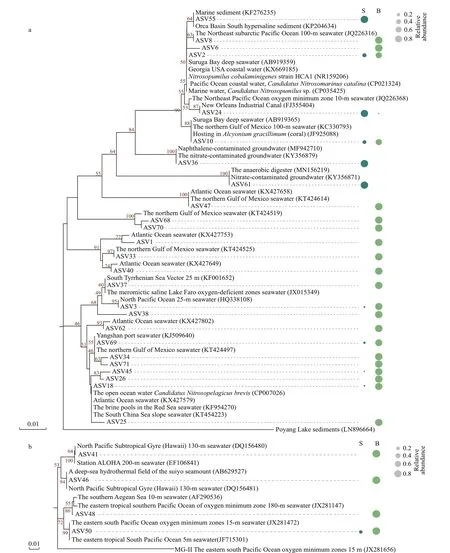
Fig.5 Phylogenetic tree based on the 16S rRNA gene from the ASVs of Nitrosopumilales (a) and Marine Group III (b)detected in our study
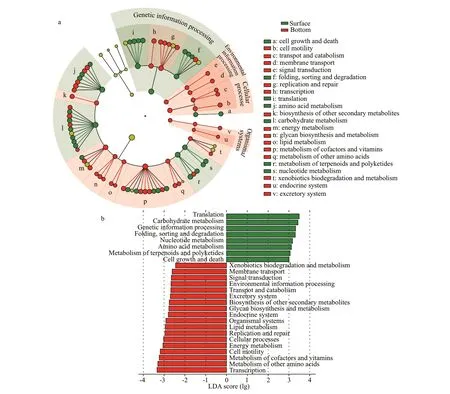
Fig.6 LEfSe analysis and metabolic pathway enrichment analysis for archaea in the surface and bottom seawater samples
4 DISCUSSION
4.1 Comparison of archaeal communities between surface and bottom water layers
In general, the ocean is characteristically stratified as reflected in the vertical distributions of zooplankton or microbial communities (Banse, 1964; DeLong et al., 2006). 16S rRNA gene sequencing was performed on 12 seawater samples from the surface layers(DO≥3 mg/L) and 12 seawater samples from the bottom layers (DO<3 mg/L) to reveal the features of the archaeal community structure in the CRE. The environmental factors were measured in situ. The two layers showed significantly different environmental factors and archaeal communities (P<0.01; Fig.2,Supplementary Figs.S1 & S2). The archaeal richness and diversity were higher in the bottom water(P<0.01) than the surface layers, suggesting the presence of complex archaeal communities in deep layers. Similar results of the microbial community were also found in the saltwater of the Zhujiang estuary and in the same sites of our study (Liu et al.,2014, 2015; Wu et al., 2019). However, the bottom layers in this work were under hypoxia, which can vary the composition of microbial loop (Naqvi et al.,2000). The archaeal community is less abundant in the hypoxic seawater, which is relative to oxic layers(He et al., 2016). Considering that the samples were obtained from two different depths, relabeling them as hypoxic and hypoxic groups based solely on the DO values was inappropriate. RDA analysis showed that salinity and temperature were the most important environmental factors to the archaeal community.Therefore, we speculated that DO value was not the most important factor for the vertical distribution of the archaeal community in the CRE. Liu et al. (2011)also found that salinity has a remarkable effect on archaeal community composition. In the present work, although the surface and bottom samples were distinctly divided into two branches during clustering(Fig.2a), the archaeal community compositions in the surface samples were not uniform (Fig.2b) due to some environmental factors (Supplementary Fig.S1).The quartile deviations of NO3ˉ, DO, salinity, and NH4+were long in the surface group, indicating that the values of the measured factors were largely different within the surface samples (Supplementary Fig.S1).In F5S, salinity was the highest in the surface group,and the concentrations of NO2ˉ and NO3ˉ were the lowest among all surface samples. RDA analysis also presented that the surface sample sites were relatively dispersive (Fig.4).
In line with previous studies in the CRE and the Zhujiang River estuary (Liu et al., 2014, 2020), MGII was predominant in the surface seawater, and Thaumarchaeota and MG-III prevailed in deep layers(López-García et al., 2001; DeLong et al., 2006;Zhang et al., 2015). Surprisingly, these results were completely different from previous findings in the CRE. Zeng et al. (2007) and Liu et al. (2011) proposed that MG-I is dominant in the surface seawater, and MG-II is abundant in the bottom layers. Massana et al. suggested that Euryarchaeota might be more limited in the temperate zone (Massana et al., 2000)and dominated in the middle and deeper seawater(Massana et al., 1997). Some studies also found the similar phenomenon (DeLong et al., 1994). A research found that the MG-II were dominant in planktonic archaea throughout the water column in the northeastern South China Sea (Liu et al., 2017)possibly due to strong vertical mixing (Tian et al.,2009; Jiao et al., 2014). Besides, Orsi et al. (2015)also proposed that MG-II preferred to attach to particles. Considering that the CRE is often strongly influenced by various ocean currents and water masses in summer, we suggested that the previous results might also be related to the current fluctuation or the preference of archaea for particles.Unfortunately, these speculations have not been confirmed and further verification. MG-II contributes more to archaeal assemblages from the surface than from deeper waters (López-García et al., 2001; Herndl et al., 2005; DeLong et al., 2006; Tseng et al., 2015).Similar to our results, Liu et al. (2009) found that MG-II showed decreased diversity with the increase of depth in the Gulf of Mexico, and Liu et al. (2014)has reported that MG-II were more predominant in the surface saltwater sites of Zhujiang River estuary.In phylogenetic analysis based on the 16S rRNA genes (Massana et al., 2000; Martin-Cuadrado et al.,2008; Belmar et al., 2011), MG-II was classified into two major clusters: MG-IIA, which was more common in the surface seawaters (Frigaard et al.,2006), and MG-IIB, which is abundant in deep water(Hugoni et al., 2013). The distribution of MG-II(ASVs) in the RDA plot also displayed different preferences of environmental factors, and most were negatively related to salinity and positively related to DO and temperature (Fig.4). The wide distribution of MG-II indicated its extensive adaption to diverse marine habitats (Zhang et al., 2015).
MG-III, another dominant family of Euryarchaeota,presented relatively higher abundance in the bottom layers. A few studies confirmed that MG-III is mainly retrieved from deeper seawater (Galand et al., 2009;Tseng et al., 2015; Tarn et al., 2016). Similar to MGII, no strain of MG-III has been cultured, which explains its unclear ecological and physiological characteristics. The phylogenetic structure of MG-III showed that most referenced sequences were mainly from the deep sea or hypoxic zones (Fig.5b). ASV50 occurred in both groups, and the clustered sequences,JX281472 (unpublished) and JF715301, were also from the surface water layers in the eastern South Pacific Ocean seawater (Belmar et al., 2011). Six novel MG-III genome sequence bins were recovered in the photic zone (Haro-Moreno et al., 2017), and a small amount of MG-III was found in surface Arctic waters and the South China Sea (Galand et al., 2009;Li et al., 2021). Notably, F5S possessed the highest amount of MG-III among all the surface samples and detached from the surface group in the RDA plot(Figs.3 & 4). Among the environmental factors,salinity in F5S was the highest among the surface samples, and the concentrations of NO3ˉ and NO2ˉ in F5S were extremely lower than in other surface samples. F5S processed similar environmental status to the bottom layers, thus explaining why MG-III is relatively abundant in the site. Metagenomics analysis revealed that the DNA fragments of MG-III genes resembled those in ammonia-oxidizing archaea(AOA), indicating that some members of MG-III may oxidize ammonia (Martín-Cuadrado et al., 2007). In general, we speculated that environmental factors affect the archaeal community components.
Thaumarchaeota had a niche preference for the hypoxic bottom layers, and this finding is in agreement with several works (Massana et al., 2000; Molina et al., 2010; Beman et al., 2012; Tolar et al., 2013).Thaumarchaeota, initially known as mesophilic Crenarchaeota, is a new phylum (Brochier-Armanet et al., 2008). Most of the studies proposed that marine Thaumarchaeota are chemolithoautotrophs, and all cultured representatives of Thaumarchaeaota are AOA (Pester et al., 2011; Hatzenpichler, 2012).Nitrosopumilales, which also belong to AOA, were the most abundant order of Thaumarchaeota in the previous study (Könneke et al., 2005). AOA and AOB play important roles in the ocean nitrogen cycle.Moreover, AOA dominates in many environments,indicating that AOA play more important role in ammonia oxidation (Albers et al., 2004; Shen et al.,2008; Kembel et al., 2010; Jin et al., 2011; R Core Team, 2013; Liu et al., 2017). For the correlations between each ASV of Nitrosopumilales and the environmental factors (Supplementary Fig.S4), most ASVs were positively related with depth and salinity,and negatively related with temperature, DO, pH, and the concentration of NO3ˉ, NO2ˉ, and PO43ˉ.Environmental factors, such as salinity, temperature,nitrate concentration, and total nitrogen, are the driving forces affecting the diversity of AOA communities (Cao et al., 2011; Yu et al., 2016). A small amount of Nitrosopumilales also existed in the surface layers (Fig.3b). As shown in the phylogenetic tree (Fig.5a), several ASVs, such as ASV24, ASV55,and ASV61, were relatively abundant in the surface layers and clearly clustered in the upper topologic structure. Some referenced sequences were also found from the surface waters. ASV24 (CandidatusNitrosopumilus) was one of the top ASVs of Nitrosopumilales in the relative abundance. The clustered sequences FJ355404 and JQ226368 were detected from the surface water in Industrial Canal(Amaral-Zettler et al., 2008) and 10-m seawater in the Northern Pacific Ocean oxygen minimum zone,respectively. ASV36 (CandidatusNitrosoarchaeum)and ASV61 (CandidatusNitrosotenuis) were also closely clustered with KY356879 and KY356871,respectively, which were obtained from the nitrateand radionuclide-contaminated groundwater. Hence,several relatively abundant ASVs of Nitrosopumilales in surface layers, which have strong adaptability, may be injected from terrestrial freshwater rivers and even industrial swages to the coastal surface seawater(Amaral-Zettler et al., 2008; Ren et al., 2019).Furthermore, some researches show thatCandidatusNitrosotenuis uzonensis andNitrosopumilussp. are associated with low-salinity and freshwater environments (Mosier and Francis, 2008; Restrepo-Ortiz et al., 2014; Alves et al., 2018). Most of the ASVs of Nitrosopumilales in this study exhibited high similarity to the uncultured archaeal sequences from other environments, such as the Northeast Pacific Ocean, the northern Gulf of Mexico, Atlantic Ocean, and South China Slope. Therefore, these ASVs did not represent the special groups in the CRE and constantly adapt to different environments worldwide.
4.2 Metabolic prediction of archaeal community in the hypoxic layers
Identifying the archaeal communities responding to hypoxia is vital to understand the structure and function of estuarine ecosystems. Here, PICRUSt2 was applied to predict the archaeal metabolic function in the CRE. Comparison of the metabolic pathways in different water layers revealed many relative abundant pathways were shown in the hypoxic bottom layers.
The replication and repair of genetic information processing were enriched in the bottom layers(P<0.001; Supplementary Fig.S5). The rugged environment condition in the bottom layers, such as low pH, high salinity, and hypoxia, acted as the DNAdamaging agents to accelerate DNA damage (Zatopek et al., 2018). Owing to the toxic nature of DNA lesions,organisms have evolved several DNA replication and repair pathways. Base excision repair, homologous recombination, mismatch repair, and nucleotide excision repair were abundant in the bottom layers(P<0.001; Supplementary Fig.S5). Therefore, under environmental pressure, archaea may need powerful DNA replication and repair compounds to ensure genomic fidelity (Shin et al., 2014).
The membrane transport and signal transduction of environmental information processing were relatively abundant in the bottom layers (P<0.001;Supplementary Fig.S5), especially adenosinetriphosphate (ATP) binding cassette (ABC)transporters pathways. Different from most bacteria,archaea prefer primary ATP-driven uptake systems for carbon and energy sources (Konings et al., 2002).The high affinity of the binding proteins may enable them to survive in habitats with low carbon sources such as sugars and peptides (Albers et al., 2004).Konings et al. (2002) suggested that archaeal ABC sugar transporters are equipped with an exceptionally high affinity for the subnanomolar substrate, which is beneficial for archaea to compete with others in harsh environments and thereby maximize their ability to absorb nutrients. Here, the starch and sucrose metabolism and the degradation of some amino acids were relatively vigorous in the bottom hypoxic layers(P<0.001) possibly because the archaea consume these substrates for energy through ABC transporters.
Some subcategories pathways affiliated to metabolism enriched in the bottom layers, including amino acid metabolism, carbohydrate and lipid metabolism, metabolism of cofactors and vitamins,and energy metabolism. Arginine and methionine are sulfur-containing amino acids. In hypoxic environments, some organic sulfides, such as methanethiol and dimethyl sulfide, can be derived from the degradation of sulfur-containing amino acids(Kadota and Ishida, 1972; Lohrenz et al., 2008).Sulfur metabolism was vigorous in the bottom layers(P<0.001, Supplementary Fig.S5), which was consistent with other studies (Liu et al., 2014; Wang et al., 2016; Wu et al., 2019). In addition to being the basic structure of protein synthesis, amino acids are also precursors for the production of secondary metabolites. The synthesis of streptomycin and vancomycin was also vigorous in the bottom layer.Vancomycin is a class of glycopeptide antibiotics that effectively inhibit the biosynthesis of bacterial peptidoglycans (Khelaifia and Drancourt, 2012), and streptomycin is a class of amino sugar antibiotics, that prevent bacterial ribosomes or their reaction substrates(Weisblum and Davies, 1968). These antibiotics may be protective agents that archaea could use to maintain their growth in complex environments. Some sponge archaeal communities could produce tetracycline with protective properties against potential sponge pathogenic microorganisms and competitors (Polónia et al., 2014). In this work, glycan biosynthesis was enriched in the bottom layers. The cell surface of prokaryotes is particularly rich in glycans, which are glycosylated with the proteins and play fundamental roles in cell physiology (Doyle, 2002). In archaea,N-linked glycosylation is the most common and mainly occurrs on S-layer proteins (Mescher and Strominger, 1976; Kärcher et al., 1993; Schäffer and Messner, 2001) and flagellins (Voisin et al., 2005;Kelly et al., 2009). The S-layers also have two noteworthy functions. First, they can minimize unspecific binding and are important for nutrient absorption in harsh environments (Pohlschroder et al., 2018). Second, they can also reduce flow resistance to promote archaea-driven movement due to their structural characteristics (Sleytr et al., 2014). These functions are necessary for the archaea that live in harsh environments to maintain their own growth and division. The current results also showed that protein export and some amino acids synthesis pathways were vigorous and could satisfy the S-layer synthesis.
Xenobiotics biodegradation and metabolism, one of the functional subcategories, were abundant in seawater (Jain et al., 2005). In the bottom layers, the degradation pathways of aminobenzoate benzoate,chlorocyclohexane, and chlorobenzeneare were enriched (P<0.001) (Battersby, 1990). These organic compounds are widely used in many industries(paints, textiles, wood, and chemistry) and agriculture(herbicides and pesticides) and have been considered as important environmental contaminants. The CRE is adjacent to the Changjiang River Delta area with developed industry and agriculture, which is highly affected by human activities. The above organic compounds might flow into the aquatic environment mainly through agricultural and industrial runoff, and gradually sink to the bottom (Embrandiri et al., 2016).These findings indicated that archaeal communities could be regarded as xenobiotic biodegradants for environmental remediation. The archaea community could also obtain carbon, nitrogen, and energy to adapt the harsh niches (Polónia et al., 2018; Wang et al., 2018).
5 CONCLUSION
The archaeal communities in the surface and bottom layers of the CRE were detected on July 2016.Distinct archaeal community structure was observed between the two layers. At the taxonomic levels, MGII dominated in the surface layers, whereas Nitrosopumilales was enriched in the bottom water.However, the results were completely different from previous studies in the CRE. Salinity and temperature were the most important environmental factors affecting the archaeal community. In addition,metabolic prediction revealed that the functional subcategories such as replication and repair,membrane transport, and xenobiotics biodegradation and others, indicating that archaea have a strong ability to protect themselves against harsh environmental conditions. These findings expend the understanding of the archaeal structure and functions in different water layers, even in the hypoxic zones in the CRE, and may contribute to further works of the archaeal community in the CRE.
6 DATA AVAILABILITY STATEMENT
The raw sequence datasets in this study are available in GenBank under BioProject PRJNA632685(BioSample accession Nos.: SAMN16378058-SAMN16378081) (https://www.ncbi.nlm.nih.gov/bioproject?LinkName=biosample_bioproject&from_uid=16378061)
7 AUTHORS’ CONTRIBUTION
Yan HUANG processed the experimental data,performed the analysis, and wrote the manuscript. Wu QU analyzed the data. Yingping FAN carried out the part of experiments. Jianxin WANG supervised the project from experimental design to submission of the manuscript. All authors agreed and approved the manuscript to be published.
8 ACKNOWLEDGMENT
We are grateful to all the staffwho assisted in the field sampling.
 Journal of Oceanology and Limnology2022年3期
- Journal of Oceanology and Limnology的其它文章
- Typhoon-induced wind waves in the northern East China Sea during two typhoon events: the impact of wind field and wave-current interaction*
- Effect of subsea dispersant application on deepwater oil spill in the South China Sea*
- Geochemical characteristics of cold-seep carbonates in Shenhu area, South China Sea*
- Examination of seasonal variation of the equatorial undercurrent termination in the Eastern Pacific diagnosed by ECCO2*
- Deviation of the Lagrangian particle tracing method in the evaluation of the Southern Hemisphere annual subduction rate*
- Immunostimulatory effect of quaternary degree and acetyl group of quaternized chitosan on macrophages RAW 264.7*
