The ecological response of natural phytoplankton population and related metabolic rates to future ocean acidification*
Haijiao LIU , Yuying ZHAO , Chao WU , Wenzhe XU , Xiaodong ZHANG ,Guicheng ZHANG , Satheeswaran THANGARAJ , Jun SUN ,2,**
1 Research Centre for Indian Ocean Ecosystem, Tianjin University of Science and Technology, Tianjin 300457, China
2 College of Marine Science and Technology, China University of Geosciences (Wuhan), Wuhan 430074, China
3 Department of Marine Science, Incheon National University, Incheon 22012, Republic of Korea
Abstract Ocean acidification (OA) and global warming-induced water column stratification can significantly alter phytoplankton-related biological activity in the marine ecosystem. Yet how these changes may play out in the tropical Indian Ocean remains unclear. This study investigated the ecological and metabolic responses of the different phytoplankton functional groups to elevated CO 2 partial pressure and nitrate deficiency in two different environments of the eastern Indian Ocean (EIO). It is revealed that phytoplankton growth and metabolic rates are more sensitive to inorganic nutrients rather than CO 2. The combined interactive effects of OA and N-limitation on phytoplankton populations are functional groupspecific. In particular, the abundance and calcification rate of calcifying coccolithophores are expected to be enhanced in the future EIO. The underlying mechanisms for this enhancement may be ascribed to coccolithophore’s lower carbon concentrating mechanisms (CCMs) efficiency and OA-induced [HCO 3 ˉ]increase. In comparison, the abundance of non-calcifying microphytoplankton (e.g., diatoms and dinoflagellates) and primary productivity would be inhibited under those conditions. Different from previous laboratory experiments, interspecific competition for resources would be an important consideration in the natural phytoplankton populations. These combined factors would roughly determine calcifying coccolithophores as “winners” and non-calcifying microphytoplankton as “losers” in the future ocean scenario. Due to the large species-specific differences in phytoplankton sensitivity to OA, comprehensive investigations on oceanic phytoplankton communities are essential to precisely predict phytoplankton ecophysiological response to ocean acidification.
Keyword: natural phytoplankton community; ocean acidification; coccolithophore calcification; primary productivity; eastern Indian Ocean
1 INTRODUCTION
Oceans can mitigate anthropogenic atmospheric CO2increasing to some degree. More CO2uptakes by the surface oceans lead to a decrease in seawater pH and carbonate saturation state, forming the wellknown “ocean acidification (OA)” phenomenon (Qi et al., 2017). In recent years, many marine organisms from different trophic levels have been reported to be negatively influenced by OA (Hofmann et al., 2010;Roleda et al., 2015; Bellerby, 2017). Phytoplankton as a major group of the marine primary producers is also undergoing various eco-physiological changes in growth rate, nutrient uptake kinetics, and cellular element ratios due to OA (Fu et al., 2007, 2012).Many conflicting observations were reported in field and laboratory experiments on positive as well as negative responses of phytoplankton to ocean carbonate chemistry. A recent study indicated that diatoms have various physiological and ecological responses to the OA conditions in coastal and pelagic areas (Bach and Taucher, 2019). Specifically, most pelagic diatoms expressed positive responses to the oceanic environments and vice versa due to the elevated CO2. In addition, Yoshimura et al. (2010)reported a decreased organic carbon production by natural assemblages under a nutrient-depleted and CO2-elevated condition. Coccolithophore calcification along the various oceanic regions (the North Atlantic,Patagonian Shelf, and western Pacific) was benefited from increasing carbon supply upon OA (Krumhardt et al., 2019). Some studies reported higher calcification rate in a high-CO2world (Iglesias-Rodriguez et al.,2008; Shi et al., 2009; Smith et al., 2012). However,most laboratory studies on the model speciesEmilianiahuxleyihave suggested a potential calcification reduction in the future acidified scenario(Walker, 2018). Similarly, Meyer and Riebesell(2015) also obtained the contradictory results from different OA incubation experimental setup or intraspecific (and strain) difference. The time scale of cellular physiological response, survey duration, and operational approach of pH might have extended influence on the final biological response. A recent study on natural coccolithophore populations and ocean geochemistry also evidenced the relationship of coccolithophore calcification with carbonate chemistry (Ridgwell et al., 2009). Furthermore, global warming could result in strong ocean stratification and reduced nutrient supply into the upper water(Sarmiento et al., 2004). The various environmental factors such as elevated temperature, light availability during the ocean acidification and warming processes would further influence the biological effects (Xu et al., 2014). Furthermore, such as light, macro- and micro-nutrient limitations in the oceanic mixed layer could additionally affect the phytoplankton growth(Davey et al., 2008; Marinov et al., 2010). Thus, to get a clear insight of the physiological responses of phytoplankton community to the multi-stressors under OA conditions, further studies coupling the field and laboratory experiments are greatly needed(Riebesell and Gattuso, 2015).
The natural oceanic phytoplankton community and their metabolic rate under simulated OA conditions are rarely attempted, especially in the tropical Indian Ocean. In recent decades, the enhanced tropical Indian Ocean warming is believed to be a major modulator for global and regional climate changes(Luo et al., 2012; Mochizuki et al., 2016). The tropical eastern Indian Ocean (EIO), as a part of Indo-Pacific warm pool, where seasonal upwelling and equatorial undercurrent occur, has been poorly examined concerning its dynamic biogeochemistry and carbon cycling (Strutton et al., 2015; Chen et al., 2016a, b).In natural phytoplankton community, it is speculated that competition for resources together with underlying adaptation mechanisms could make the primary productivity and coccolithophore calcification rate responding differently to OA scenario. Thus, to evaluate this hypothesis, the CO2-simulation platform was set up in the marked areas featured with highsalinity equatorial jets (EJs) and high-level eddy kinetic energy (EKE) from upwelling transient region in the tropical EIO through batch culture. The ecological response of natural phytoplankton community, biodiversity, and metabolic rates(phytoplankton primary productivity and coccolithophore calcification rate) in the study area of EIO under elevated CO2are discussed here.
2 MATERIAL AND METHOD
2.1 Experimental setup
The cruise (2018EIO) was conducted in the tropical EIO during the spring intermonsoon period of 2018. The surface water samples (suffered N-limitation, as shown by present N/P ratio and Si/N ratio) were collected from two stations (St. I404 and St. I103) characterizing different environmental setups (Fig.1). During the inter-monsoon period,both stations had low sea-level anomalies (SLA)amplitudes with positive values (St. I404: 2.82 cm,St. I103: 0.35 cm) (Fig.1b & c). Sampling station St.I404 was located towards the west of equator (0°,83°E) and characterized by high-salinity equatorial jets, whereas St. I103 sited towards the northwest of Sumatra (3°N, 91.8°E) and influenced with highlevel EKE. These samples were filled in the transparent plastic bottles (19 L) and used for the further experiment. On-deck biological incubation was conducted using batch culture method. The incubation temperature was controlled by recirculating surface seawater (3-5 m). The built-up CO2platform was firstly stabilized for five days.After 5 d of acclimation under the experimental condition, another 48-h incubation was started in triplicates for each set of conditions. To simulate the effects of OA and nutrient deficiency caused by stratification on phytoplankton growth, four treatments were examined in this study: +N,1 000 mg/L; -N, 1 000 mg/L; +N, 380 mg/L; -N,380 mg/L (as control). Two nitrate treatments were created with addition (+N) or without (-N) of 16-μmol/L NaNO3. Two CO2partial pressures (pCO2)were achieved by bubbling ambient air (using an air pump, 380 mg/L) and air/CO2mixture (1 000 mg/L).To eliminate other element limitation on phytoplankton, all other nutrient elements (vitamin,phosphate, and trace metals) (except for N) were uniformly added in terms of f/2 medium (Guillard and Ryther, 1962). For the four treatments, samples were collected every 12 h. The inoculum CO2equilibrium was monitored continuously by a flowmeter and measured by a pH meter. Seawater samples from each treatment were collected for dissolved inorganic carbon (DIC), in the beginning and ending of the incubation system.
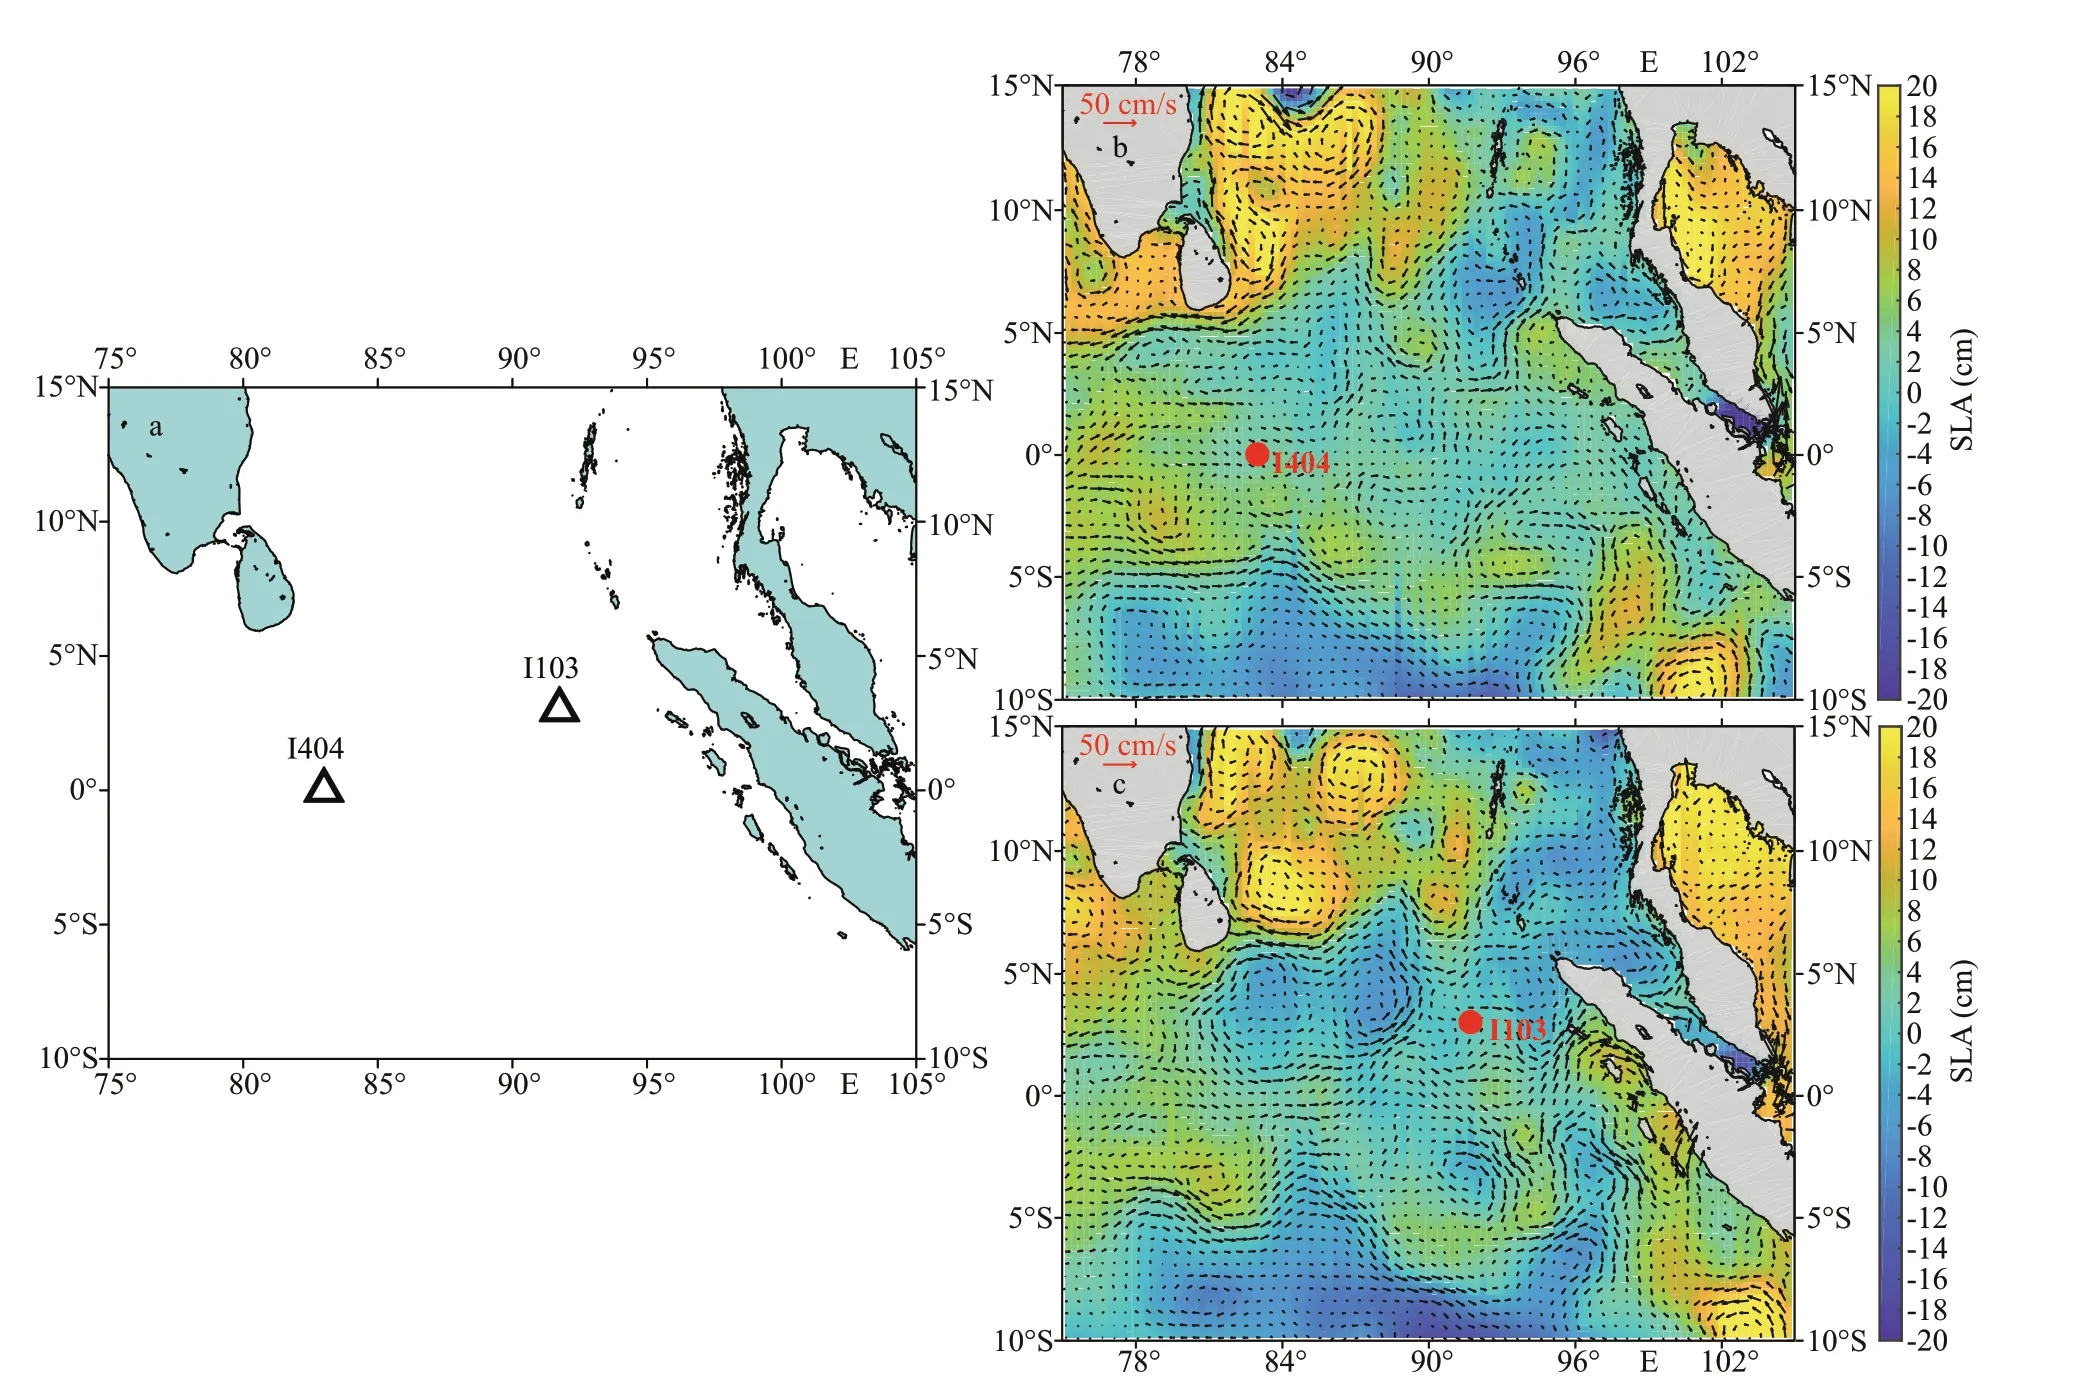
Fig.1 Maps showing the in-situ incubation stations (a) in the context of the daily sea-level anomalies (SLA) (b. St. I404, with sampling date of 2018/4/10; c. St. I103, with sampling date of 2018/3/26) overlaid with geostrophic velocities
2.2 Collection of experimental parameters
The in-situ temperature and salinity were measured from the Seabird Conductivity Temperature Depth(CTD) profiler. Prior to the collection of all parameters,all incubation bottles have been gently shaken. For the nutrient analysis, inoculum of 100 mL was transferred from each experimental treatment and then passed through 0.45-μm cellulose acetate membrane and stored at -20 °C. The in-situ nutrient samples were also collected before the experiment.For pigment analysis, inoculum of 500 mL was collected and filtered through pre-combusted GF/F membrane (2 h, 450 °C) and stored in the liquid nitrogen container until further analysis. DIC samples from all treatments were sampled and stored in brown silicon borate reagent bottles (acid washed). Then the samples were fixed with injecting HgCl2(0.12 mg/L)and refrigerated at 4 °C. The total particulate carbon(TPC) and particulate organic carbon (POC) samples were collected with filtration of inoculum (100 mL)through the pre-combusted Whatman GF/F membranes. For quantification of all experimental parameters, samples were collected in triplicate.
We identified both non-calcifying and calcifying phytoplankton groups. For the quantification of the non-calcifying micro-plankton community (size range: roughly 20-200 μm, here designated to diatoms and dinoflagellates), seawater inoculum from each triplicate were collected and stored in plastic bottles,preserved with formaldehyde solution (with 2% final concentration) and kept in dark condition until further analysis. To analyze the composition of calcifying coccolithophore community (nanoplankton, roughly 2-20 μm), inoculum of 200 mL was sampled and filtered onto polycarbonate membranes (0.6-μm pore size, 25-mm diameter) and immobilized onto the glass slide using neutral balsam.
2.3 Calcification rate and primary productivity
Carbon fixation was traced by using14C (NaHCO3)labelling technique. From each experimental treatment, inoculum of 200 mL was transferred from each triplicate as experimental group (light bottles) to 250-mL Nalgene polycarbonate (PC) bottle (pre acid rinsed). In each triplicate sample, extra bottle was covered with aluminum-foil (dark bottle) and set as the experimental control. Then 10-μCi NaH14CO3was added into each PC bottle (both light and dark bottles).Before the start of14C incubation, every inoculum of 100 μL was transferred from all dark bottles into 20-mL scintillation vials and fixed with 200-μL phenylethylamine solution, this is used for the calculation of total radioactivity in the PC bottles. All the scintillation vials were refrigerated at 4 °C and further used for the determination of total14C radioactivity. All the PC bottles were incubated for 12 h in the same recirculating system with the OA platform. After the incubation, the isotope samples were filtered onto GF/F membrane (25 mm in diameter) and rinsed 4-5 times with GF/F membrane filtered seawater, then chilled in -20-°C refrigerator.
In the laboratory, the membranes were transferred into the bottom of scintillation vials (20 mL). Then 10 mL of cocktail (Ultima Gold) was added into all vials. After 24-h dark processing, the radioactivity from each vial was counted by liquid scintillation counting instrument (PerkinElmer Life and Analytical Sciences Inc., Wellesley, MA, USA). We adopt the micro- diffusion technique (MDT) for inorganic(calcification) and organic carbon (primary production) fixation determination simultaneously(Paasche and Brubak, 1994; Balch et al., 2000). The detailed experimental procedures are relatively mature and omitted here, please refer to the abovecited literatures.
2.4 Measurement of experimental parameters
In the laboratory, the nutrient samples were thawed and analyzed using the Autoanalyzer 3-AA3 (Bran+ Luebbe, Norderstedt, Germany). For the estimation of the phytoplankton pigment concentrations, highperformance liquid chromatography (HPLC) method was adopted. The pigments were identified and quantified using the earlier published protocol(Zapata et al., 2000).
The DIC concentrations were measured using a DIC analyzer (Apollo AS-C3, USA). The principle of operation is based on nondispersive infrared absorption (Li, 2019). Each of 0.6-1.2-mL seawater samples was acidified by adding H3PO4(0.5 mL,10%), and the released gas with N2carrier was detected by the infrared detector. Finally, DIC concentration was quantified according to the peak area. The specific procedure of DIC measurement was described in Li (2019). Results showed that DIC concentration ranged from 1 638 to 2 099 μmol/kg under 380 mg/L, from 1 748 to 2 157 μmol/kg under 1 000 mg/L. For POC analysis, filters were fumed overnight using 10% HCl, then all filters (TPC and POC) were dried in an oven for 48 h and determined using Carbon-Hydrogen-Nitrogen (CHN) analyzer(Costech International S. P. A., Milan, Italy).
TPC and POC (after 4-h HCl-fumed) were measured using a Costech ECS4010 CHNSO analyzer(Costech International S. P. A., Milan, Italy).Particulate inorganic carbon (PIC) was acquired by calculating the difference of TPC and POC. PIC and POC values were used for the normalization of calcification rate and primary production.
2.5 Phytoplankton identification and quantification
For microphytoplankton processing, the Utermöhl method was used. The preserved sample was transferred to 27-mL sedimentation chambers and allowed to settle down over 24 h. Then cells were identified and quantified under an inverted microscope(Motic AE2000) with ×200 and ×400 magnification(Sun et al., 2002). Coccolithophore cells were enumerated and identified under the polarized microscope (Motic, BA300POL) with ×1 000 magnification (Liu et al., 2018).
2.6 Statistical method
Sampling station was conducted by Surfer 11 Golden software. All column graphs regarding the phytoplankton abundance and metabolic rates were plotted by Origin 8.5 PRO software. Significance level was tested using Student’st-statistic under twotailed probability distribution.
2.7 Satellite-derived data
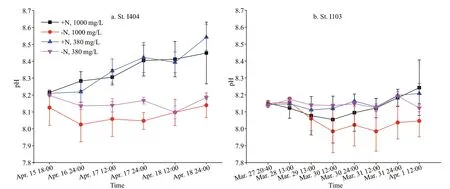
Fig.2 Variation of pH value in the four experimental treatments
The daily gridded SLA and surface geostrophic currents with a spatial resolution of 1/4° were obtained from the merged multi-altimetry products of TOPEX/Poseidon (T/P), Jason-1, Jason-2, ENVISAT,GFO, and ERS-1/2, with tidal corrections [provided by the Archiving, Validation, and Interpretation of Satellite Oceanographic data (AVISO): https://www.aviso.altimetry.fr/en/data.html].
3 RESULT
3.1 Hydrology of the incubation stations
During the premonsoon period, a narrow current called equatorial jets flows from west to east flowed along the equatorial Indian Ocean between 60°E and 90°E. The EJs are characterized as high-salinity and high-temperature waters transported from the eastern Arabian basin. St. I404 was influenced by EJs with surface temperature 30.51 °C, surface salinity 34.68,and Chla0.57 μg/L. In contrast, St. I103 located towards the northwest of Sumatra near 5°N, along the transient area of EIO upwelling and residing highlevel EKE (Chen et al., 2016a, 2018). The surface temperature, salinity, and Chlawere 29.98 °C, 34.77,and 1.10 μg/L respectively. The biological activity gave rise to the pH variations (Fig.2). During the ondeck incubation, the pH value at St. I404 was higher than that at St. I103 (Fig.2). The different CO2(380 mg/L and 1 000 mg/L) treatments did not group as expected in regards to the measured pH (Fig.2), due to the batch culture method. The pH values in +N treatments were significantly (two-tailedt-test,P<0.01) higher than -N treatments at the beginning of the incubation.Later, the pH value of +N treatments was consistently raised during the incubation period (Fig.2).
3.2 Nutrient variations during the incubation period
As seen from nutrient variations during the incubation period, the nutrient concentrations in +N treatments dropped to the initial level (i.e. in-situ condition) due to phytoplankton consumption (see the dashed line with arrow, Fig.3). It showed that average nutrient concentration was higher at St. I404 than at St. I103. Initially, both stations suffered N-deficiency indicated by N/P ratio (St. I404: 1.9, St. I103: 5.4) and Si/N ratio (St. I404: 2.7, St. I103: 5.3) (note: the sum of NO3ˉ and NO2ˉ were used in N/P and Si/N ratio).Phytoplankton groups in +N treatments had a higher absorbing ability for other elements (P and Si) than that in -N treatments.
3.3 Pigment composition and variation
A total of 21 known pigments were identified in both incubation stations. Among them, Chla,peridinin (peri), fucoxanthin (fuco), diadinoxanthin(diadino), diatoxanthin (diato), zeaxanthin (zea),divinyl-chla(dv-chla), and pheophytin (phytin)were the dominant pigments (Fig.4). Overall, at the end of incubation, pigment concentration was higher at St. I103 than St. I404. Although the composition of pigments was different at the two stations, the absolute concentration was mainly influenced by N level rather than CO2level. The pigment concentration in +N treatments was ten times higher than that in -N treatments, while, little variation in CO2treatments.
3.4 Phytoplankton community composition
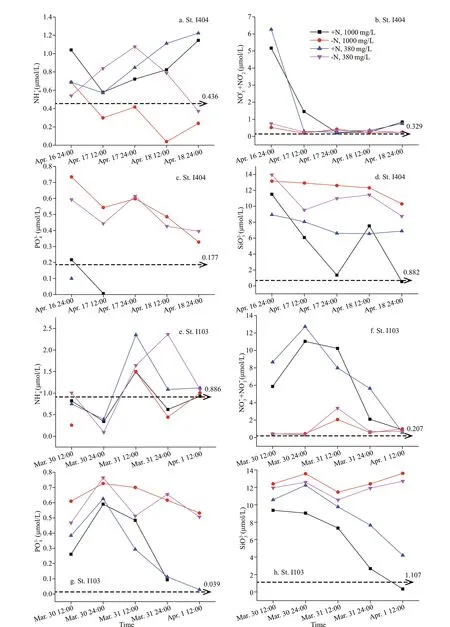
Fig.3 Average nutrient variations during the incubation
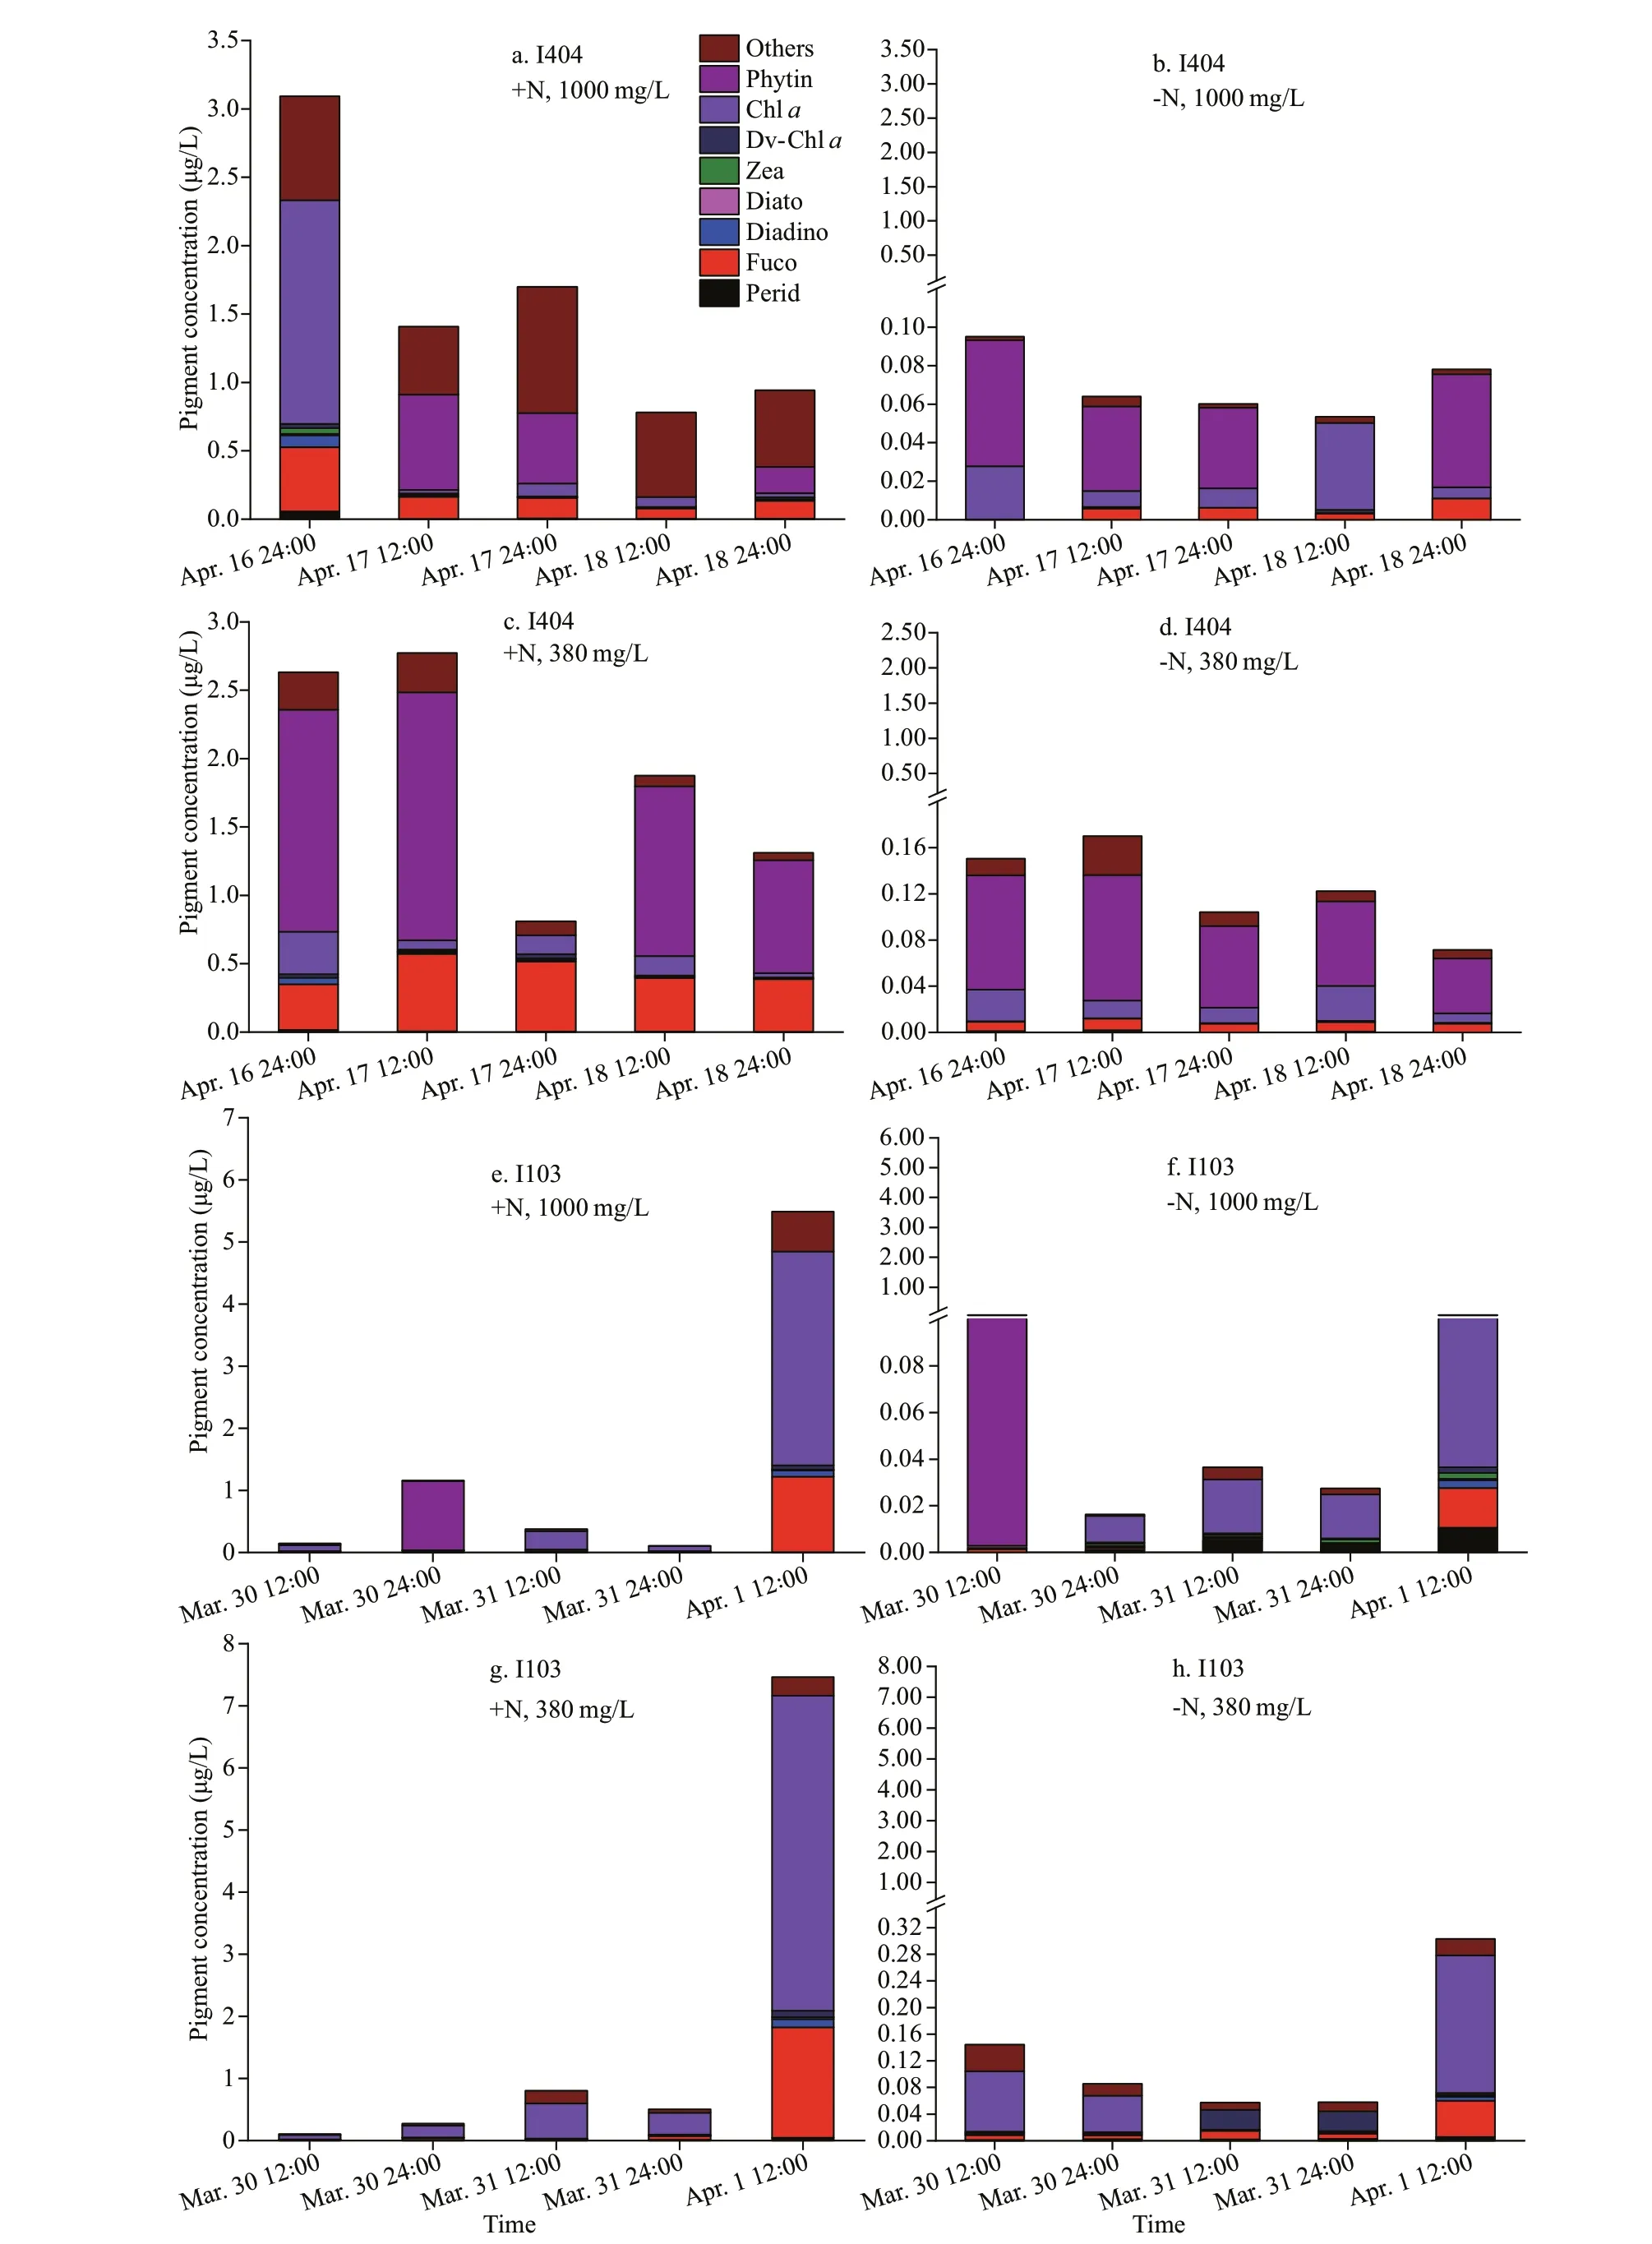
Fig.4 Variations of pigment concentration and composition during incubation
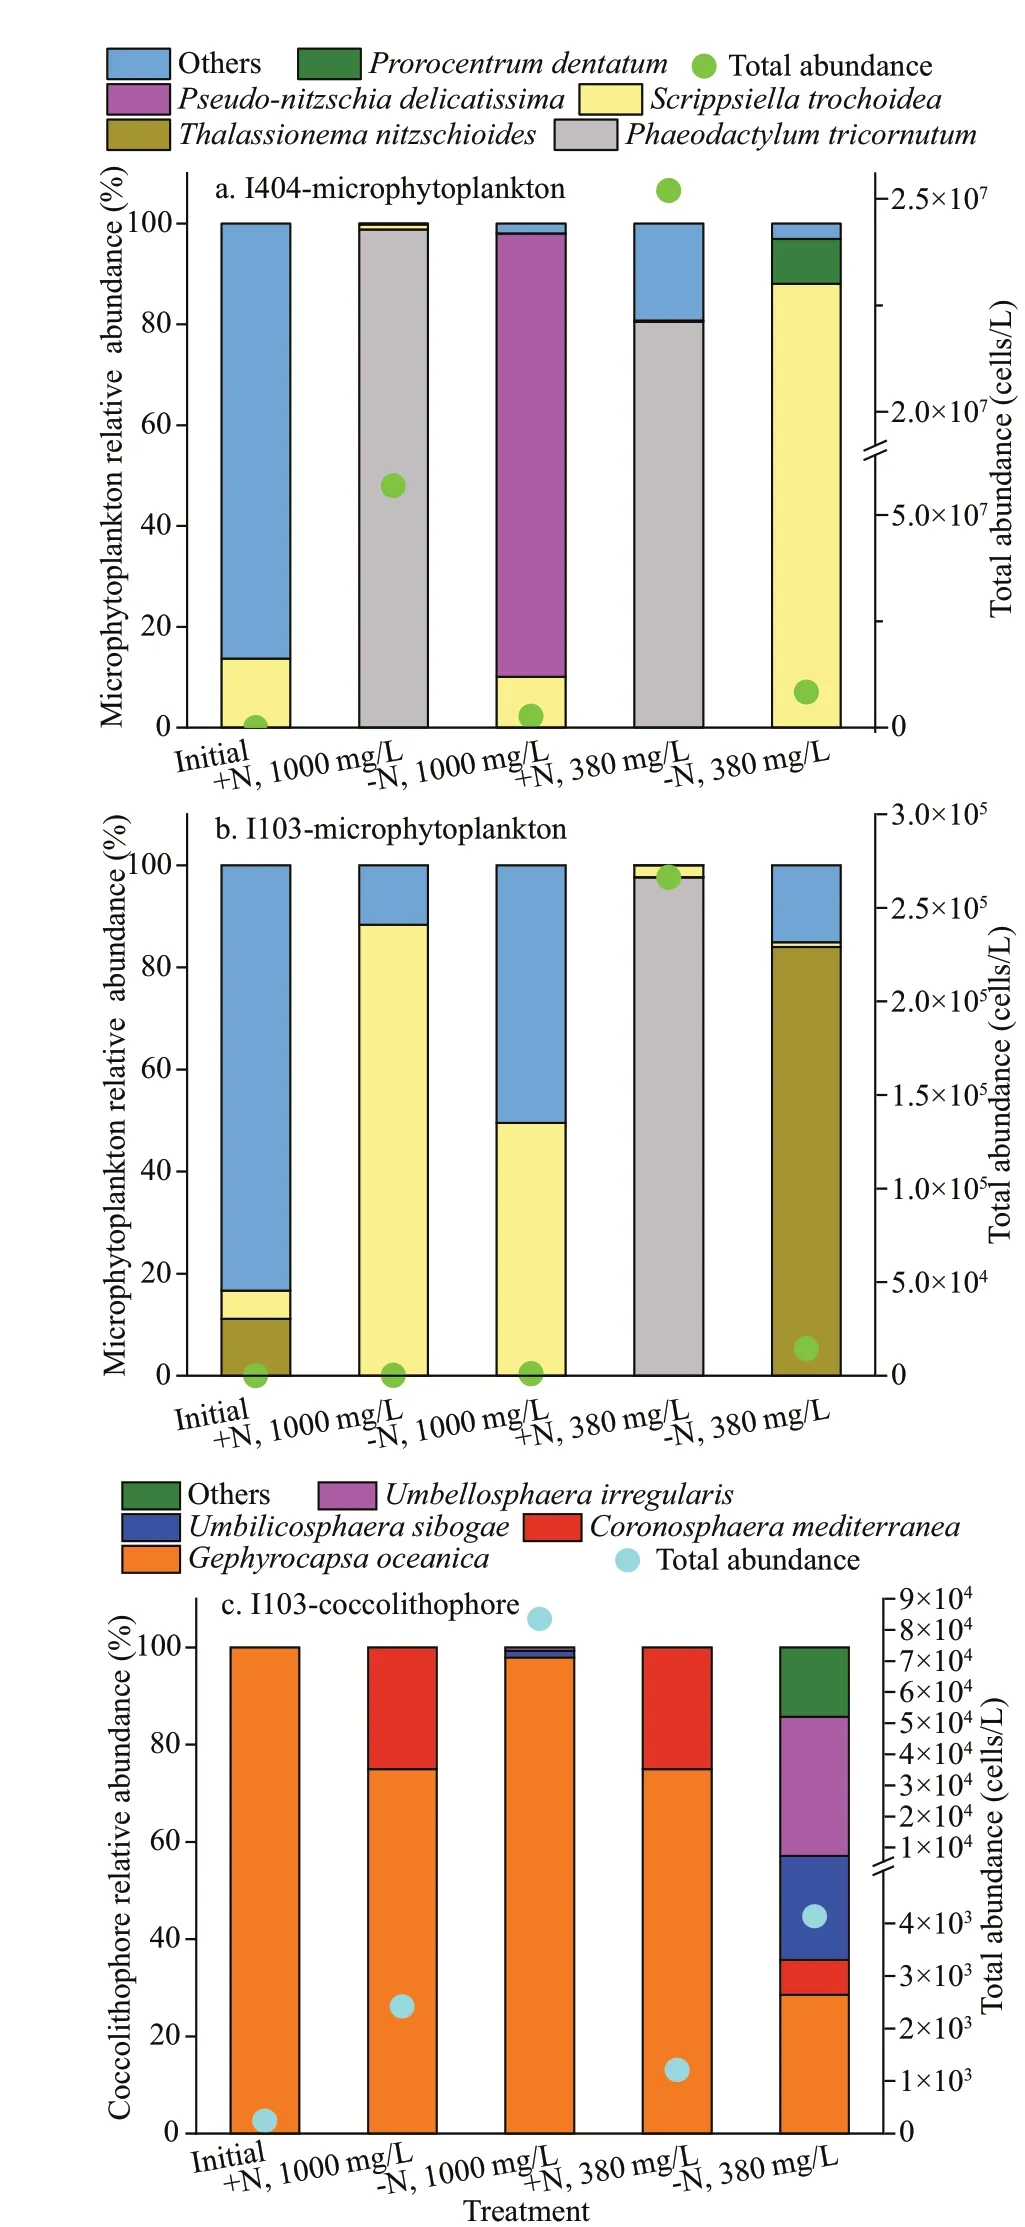
Fig.5 Initial and final phytoplankton community during the incubation
In the natural water samples, total 6 and 13 microphytoplankton taxa were identified at the St.I404 and St. I103, respectively. With respect to the species composition,Trichodesmiumthiebaultii,Thalassiosira,Gymnodinium, andScrippsiellatrochoideawere dominant species at both stations. At St. I404, the microphytoplankton assemblage was mainly dominated by diatom (85%) and cyanobacteria(separately counted). At St. I103, dinoflagellate (67%)and cyanobacteria were dominant. The initial total microphytoplankton abundance at St. I404 was ten times more than St. I103. At the end of the incubation experiment, the microphytoplankton community structure had changed. The species number increased up to 58 taxa with 30 taxa at St. I404 and 37 at St.I103. The species assemblage was mainly dominated by diatoms and dinoflagellates, followed by chrysophytes and cyanobacteria. At St. I404, speciesPhaeodactylumtricornutum,Thalassiosiraangulata,andS.trochoideawere abundant, whereas at St. I103,P.tricornutum,Thalassionemanitzschioides, andS.trochoideadominated the microphytoplankton assemblage (Fig.5a & b). In the +N treatment,P.tricornutumwas dominant at St. I404. However, at St. 1103,P.tricornutumandS.trochoideawas abundant in 380×10-6treatments and 1 000×10-6treatments, respectively. In the -N treatments, total phytoplankton biomass was extremely low.
In contrast to microphytoplankton, coccolithophores showed the reversed trend among all treatments. In the initial natural water sample, we had not observed the presence of coccolithophore cells at St. I404. Only detached coccoliths were observed with an initial density of 4 598 inds./L. At St. I103, only one coccolithophore species (Gephyrocapsaoceanica)was observed initially with cell abundance of 242 cells/L and detached coccoliths of 242 inds./L.However, at the end of the incubation, 6 taxa of coccolithophores were observed, with the preponderance ofG.oceanica. Generally,coccolithophore abundance was higher in -N treatments than in +N treatments, and especially in 1 000×10-6than 380×10-6treatment (Fig.5c).Combining the interactive effect of N and CO2,maximum coccolithophore were observed in -N, with the dominance ofG.oceanicain 1 000×10-6treatment.
3.5 Calcification (calcite production) and primary productivity
Calcite production (CP) and primary productivity(PP) were estimated after PIC and POC normalized,respectively (Fig.6). Some of the PIC values were below the detection limit, thus the curve of normalized CP was not continuous (Fig.6a & b). The CP (P<0.01,F=6.65, DF=87, one-way ANOVA) and PP (P<0.01,F=9.69, DF=113, one-way ANOVA) values varied significantly among different treatments. Generally,high CP value appeared in the treatment of -N,1 000×10-6and then in the treatment of -N, 380×10-6.Differently, PP had a higher value in +N, 380×10-6,followed by +N, 1 000×10-6. The CP and PP variations among treatments were consistent with coccolithophore abundance (at St. I103) and microphytoplankton abundance, respectively (Fig.5).Overall, N treatments had a greater influence on PP than that of CO2treatments.
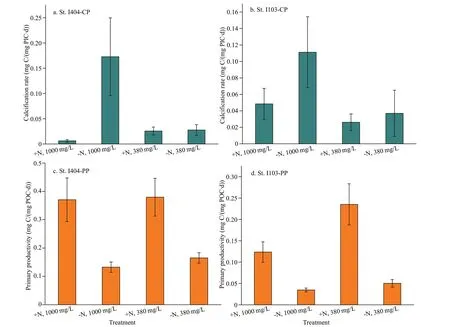
Fig.6 Calcification rate and photosynthetic rate during the incubation
4 DISCUSSION
Unlike the laboratory OA experiments, the effect of OA on natural phytoplankton community did not emphasize species-specific responses due to the complex oceanographic factors and massive species difference. Therefore, our major concern was to evaluate the responses of varied natural phytoplankton groups to the mimic future ocean scenario. Recently,Bach and Taucher (2019) reviewed OA studies over one decade to understand the response of natural diatoms to acidified ocean. Their statistical assessment suggested that 60% of OA experiments would make a response to OA, including 56% of positive and 32%of negative response. Based on previous studies, we evaluated the preliminary responses of natural phytoplankton community and their metabolic rates(i.e. PP and CP) to OA effect.
4.1 Phytoplankton community shifts and nutrient absorption dynamics
The regional differences in the environment variability (mainly influence of EJs at St. I404 and EKE at St. I103) of the sampling area may strongly control the in-situ phytoplankton abundance and structural difference. However, in the closed incubation system, the populations were largely controlled by the culture condition (Boyd et al., 2015).No coccolithophore cells were detected at St. I404 possibly due to insufficient sampling volume, uneven sampling, or filtration problems, but detached coccoliths were detected.
The microphytoplankton assemblage was mainly dominated by diatoms and dinoflagellates and reached peak abundance in the treatment of +N, 380×10-6,whereas the calcifying coccolithophores had maxima in -N, 1 000×10-6. This result was consistent with some previous studies. For example, Tortell et al.(2002, 2008) reported enhanced diatom abundance and primary productivity under the elevated CO2,while non-siliceous phytoplankton was increased;Hare et al. (2007) documented the succession of diatoms by nanoflagellates. While, there were no clear results about which sort of phytoplankton group would be benefited from OA. For instance, some studies indicated OA inhibiting effects on noncalcifying phytoplankton (Yoshimura et al., 2010;Hama et al., 2012). Analyzed from a large dataset, the oceanic diatom population had a higher frequency to negatively respond to OA (Bach and Taucher, 2019).Unlike coastal environments, diatoms in oceanic environments are relatively stable and not adapted well to the upcoming dramatic variations in carbonate chemistry and thus not suited to OA scenario (Duarte et al., 2013). The future OA scenario might be favorable for some phytoplankton species (e.g.,small-sized coccolithophores) which have lower carbon concentrating mechanisms (CCMs) efficiency or directly utilized diffusing CO2and are incapable of transforming HCO3ˉ. In addition to OA effects on phytoplankton physiology, high CO2also can exert indirect influences on phytoplankton via other trophic levels in marine food webs (Bach et al., 2017).Besides, N-enrichment resulted in phytoplankton group shifts, which was related with nutrient uptake,interspecific competition, and ecological niches.Generally, coccolithophores have smaller cell size and larger specific surface area compared to diatoms and dinoflagellates, so they possess a low nutrient saturation degree and typically take advantage in the oligotrophic oceans. Our findings preliminarily proved that future OA and the simulated oligotrophic scenario caused by stratification in tropical oceans would be beneficial to calcifying coccolithophore growth and detrimental to microphytoplankton(designated to diatoms and dinoflagellates) growth. In consideration of marine phytoplankton roles in trophic level transfer and biogeochemical cycling,phytoplankton competitiveness and community shifts in response to OA scenario could bring some changes to some key ecosystem service functions.
4.2 Ocean acidification effect on calcification rate and primary productivity
Ocean acidification supplies more CO2substrate for phytoplankton growth but the consequent low pH could influence some metabolic process associated with cellular homeostasis and eventually counteract the positive effect of OA-carbon source (Bach and Taucher, 2019). There are many arguments about OA effects on natural community study. Some of them suggested that high CO2could provoke phytoplankton primary productivity and growth rates (Kim et al.,2006; Riebesell et al., 2007; Tortell et al., 2008). Hare et al. (2007) reported a constant total primary productivity under high CO2, but diatom contribution to the total community was decreased. Wood et al.(2008) studied the model calcifying organism(Amphiurafiliformis, benthic metazoan), and their results revealed calcification rate would be enhanced to compensate the loss brought by OA. Iglesias-Rodriguez et al. (2008) showed evidence that the calcification rate ofE.huxleyiwould be increased benefiting from increased [HCO3ˉ] by the end of this century. The sensitivity of calcifying organisms exhibited large species (or strain)-specific differences,though many studies revealed OA threatening on marine organisms (Doney et al., 2009). Many reefbuilding corals and phytoplankton will face the risk of 10%-50% reduction of calcification rate with the decreasing of CaCO3saturation state (Kleypas et al.,2006). However, the calcification rate-CO2relation study was surveyed in individual calcifying organisms,there is no consensus on the underlying calcification mechanisms. In the oceanic water, OA in a combination of more oligotrophic condition could largely promote calcification rate as seen from CP value in -N, 1 000×10-6treatment (Fig.6a & b). While this promotion on CP by OA would be disappeared and turned to restriction under the condition of N-enrichment (Fig.6a & b), this scenario might character the coastal ocean (acidified water with severe eutrophication). Based on this finding, coastal water would possibly experience a lower calcification rate in the future scenario. Accompanied by the increasing of oceanic CP rate, PP suffers adverse effects influenced by the oligotrophic acidified water(Fig.6c & d, in -N, 1 000×10-6). However, this inhibition is turned to promotion under N-enrichment.The responding difference in these two major metabolic processes also can be ascribed to species physiological differences (e.g., CCMs) and resource competition factors. Some differential responses in the two stations may be related to the difference of in-situ phytoplankton life stage, while this physiological factor is very general in natural populations.
5 CONCLUSION
Our present investigation simulated the OA effect on natural oceanic phytoplankton community and their metabolic rates (calcification rate and primary productivity) in different environments of EIO.Besides, the underlying response mechanisms of major phytoplankton groups, and their carbon fixation rates to OA and subsequent seawater stratification were discussed. It should be noted that the natural populations and laboratory incubations might generate different responses to OA. In previous study,there were many inconsistencies among various OA experiments regarding phytoplankton ecology and physiology. Among them, few reports were based on the natural phytoplankton community, especially on the tropical oceanic phytoplankton community. Our findings suggest that ocean acidification and the synergetic N-depletion would promote calcifying coccolithophores and calcification rate, whereas inhibit non-calcifying microphytoplankton abundance and primary productivity. However, planktonic calcifying organisms have great species-specific differences in their sensitivity to OA, more field incubation studies on oceanic phytoplankton are greatly needed to verify the above experimental conclusions. In addition, seawater carbonate chemistry is another factor that should be concerned in future studies as it has an important role in phytoplankton physiology.
6 DATA AVAILABILITY STATEMENT
The data used to support the findings of this study are available from the corresponding author upon request.
7 ACKNOWLEDGMENT
We thank Dr. Misun YUN (Tianjin University of Science and Technology, China) and Dr. Dhiraj Dhondiram NARALE (Adani Power, India) for comments on the manuscript. Special thanks to the Open Cruise Project in the eastern Indian Ocean of National Natural Science Foundation of China(NORC2017-10) for sharing their ship time.
 Journal of Oceanology and Limnology2022年3期
- Journal of Oceanology and Limnology的其它文章
- Typhoon-induced wind waves in the northern East China Sea during two typhoon events: the impact of wind field and wave-current interaction*
- Effect of subsea dispersant application on deepwater oil spill in the South China Sea*
- Geochemical characteristics of cold-seep carbonates in Shenhu area, South China Sea*
- Examination of seasonal variation of the equatorial undercurrent termination in the Eastern Pacific diagnosed by ECCO2*
- Deviation of the Lagrangian particle tracing method in the evaluation of the Southern Hemisphere annual subduction rate*
- Immunostimulatory effect of quaternary degree and acetyl group of quaternized chitosan on macrophages RAW 264.7*
