Impact of typhoon Lekima (2019) on material transport in Laizhou Bay using Lagrangian coherent structures*
Qi LOU , Zhengyan LI ,2, Yanwei ZHANG , Yilei FENG , Xueqing ZHANG ,2,**
1 College of Oceanic and Atmospheric Sciences, Ocean University of China, Qingdao 266100, China
2 Key Laboratory of Marine Science and Numerical Modeling, Ministry of Natural Resources (MNR), Qingdao 266061, China
Abstract Typhoon has an impact on an estuary and coastal environment. However, the present research lacks the detailed description of material transport processes during typhoon passage, such as the transport channels and barriers in the course of material transport and material accumulation area, etc. Therefore,Lagrangian coherent structures (a method developed for describing the transport structure of fluids in recent years) was introduced to investigate and predict the floating material and debris transport process in the Laizhou Bay, Bohai Sea, during typhoon Lekima in 2019. Results show that the Lagrangian coherent structure could well explain the complex flow phenomena in the bay. During the typhoon, the general direction of floating material transport in the Laizhou Bay was anticlockwise. There was a channel for material transport in the northwest and south of the bay, and there are transportation obstacles in the northeast-southwest direction in the middle of the bay. Therefore, the typhoon might worsen the water quality. These results provide references for precise countermeasures to control the formulation of pollution in the Laizhou Bay.
Keyword: material transport; typhoon; Lagrangian coherent structures; Laizhou Bay
1 INTRODUCTION
The typhoon (also known as tropical cyclones or hurricane) is one of the most serious natural disasters.It can cause direct effects include storm surges, winds,waves, and precipitation, and indirect effects include changes in ocean dynamics that consequently impact the ocean environment (Ezer, 2018). During the typhoon, the concentration of material in the river,wetland, and estuary changed significantly (Yang et al., 2012; Wang et al., 2016; Lin et al., 2019a, b).Freshwater discharge, depressed salinity, and nutrient enrichment could additionally influence the ecosystem in the estuary (Herbeck et al., 2001; Paerl et al., 2001).A typhoon passing over the ocean can cause strong mixing and upwelling, bringing about the low temperature and nutrient-rich water of bottom layer to the upper layer region (Chen et al., 2012; Jiang et al.,2020), and then invoke a mesopelagic ecosystem response (Zhou et al., 2012; Pedrosa-Pàmies et al.,2019). In addition to the effects of upper ocean,typhoons (hurricanes, tropical cyclones) can cause horizontal material transport, as seen for example of terrestrial material transport to the southern Okinawa during the typhoon Morakot (He et al. 2014), material transport in the coastal northern South China Sea during the typhoon Merbok (Jiang et al., 2020), the Florida current transport and Gulf stream transport during the hurricanes (Ezer, 2018).
The main research methods to study the impact of typhoon on the material transport in the ocean are the sampling and satellite remote sensing (Morimoto et al., 2009; Chen et al., 2012; He et al., 2014). But these two methods are limited by the meteorological condition. Therefore, the numerical model has become a powerful tool for the research of material transport during typhoon passage. In recent years,some research focus on the effects of typhoon on the sea surface temperature, sea surface height, and chlorophyllain the ocean (Chen and Tang, 2011; Sun et al., 2016; Liu et al., 2019b).
We chose the Lagrangian coherent structure (LCS)method, a method under Lagrangian perspective to study on the material transport, by which transport and mixing in fluid flows driven by dynamical systems theory can be described (Aurell et al., 1997;Ser-Giacomi et al., 2015). The LCS method is in the Lagrangian framework. As the hidden skeleton of fluid flows (Peacock and Haller, 2013), LCSs provide direct geometric information about the motion of inertial particles, which is helpful to understand material transport (Peng and Dabiri, 2009; Rypina et al., 2011). LCS is widely used to study the structures of flow field in the ocean, atmosphere, and even human blood (Peacock and Haller, 2013; Garaboa-Paz et al., 2015; May-Newman et al., 2016; Niang et al., 2020), and also the distribution of matters in water bodies (Lehahn et al., 2007; Olascoaga et al.,2008; Maps et al., 2015; Son et al., 2016), and transport and mixing of water masses (Bettencourt et al., 2012; Duran et al., 2018; Wei et al., 2018).Shadden et al. (2009) showed that LCSs remain valid separatrices when the data are subject to large experimental errors. Therefore, there are many scholars who use LCS method for analyzing transport of materials (Ku and Hwang, 2018; Nolan et al.,2020; Suara et al., 2020). However, the LCS method is rarely used to study the impact of short-term extreme wind on material transport.
Laizhou Bay (LZB), located in the south of Bohai Sea, is a traditional spawning, hatching, and feeding ground for many important economic organisms and has been the focus of scholars’ research for a long time (Zhuang and Gao, 2015; Xu et al., 2017; Liu et al., 2019a). Historically, there were a few northward typhoons that affected the Bohai Sea area (Feng et al.,2018). During 1960-2013, there were 88 tropical cyclones that might cause disastrous impacts on Bohai Sea, with an average of 1.63 per year (Wen et al., 2016). The LZB is a semi closed sea area, and the seafloor near the coast is shallow, when a tropical cyclone moves northward, it is easy to cause serious marine meteorological disasters. At present, little attention has been paid to how typhoons affect the material transport in the bay. In this work, LCS were used to describe the transport of floating materials in the Laizhou Bay, Yellow Sea, following the event of typhoon Lekima (2019), to unveil the structures responsible for the tidal and typhoon-induced transports of the upper water, and can be a reference for exploring such an approach for disaster management particularly in the areas of clean-up operation and non-live related asset search after such events.
2 DATA AND METHOD
2.1 Lagrangian coherent structures
An off-line particle tracking model was used to calculate the trajectories of particles on the basis of the flow field data forced by tide and typhoon. The particle motion equation is as follows:
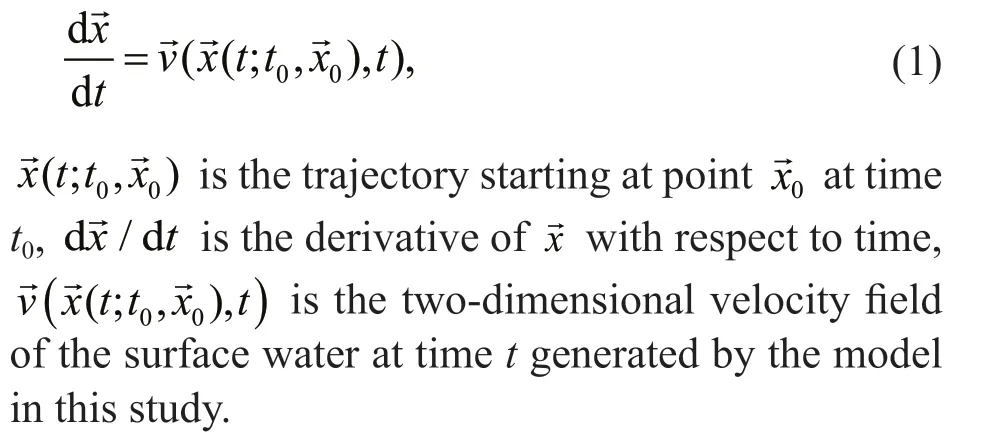
Particles were seeded every 50 m at timet=0. The particle position is updated every hour using the fourth-order Runge-Kutta sub-time stepping scheme.We focused on the horizontal transport of particles.
There are many methods to obtain the LCSs, such as Lagrangian descriptors (Mancho et al., 2013),fuzzy clustering analysis (Froyland and Padberg-Gehle, 2015), Finite-time Lyapunov exponent analysis (Haller, 2011), spectral clustering algorithm(Hadjighasem et al., 2016), and Lagrangian-Averaged Vorticity Deviation (Haller et al., 2016). Among them,the Finite-time Lyapunov exponents (FTLE) is the most popular because ofits simplicity and low computational complexity.
FTLE is a finite time average of the maximum expansion rate for a pair of particles advected in the flow (Shadden et al., 2005) during the period fromttot+T. The FTLE is calculated as:
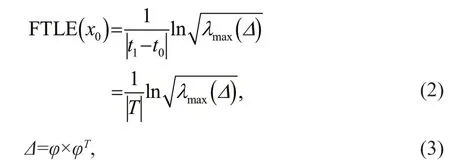
whereTis integration length,λmax(Δ) is the maximum eigenvalue of a symmetric matrixΔ, andφis the spatial deformation gradient tensor of the motion trajectory fromttot+T.
Using finite-differencing with values at the neighboring grid points can obtain the spatial gradient of the flow map at each point in the initial grid (Haller,2001; Lekien et al., 2005; Shadden et al., 2005). The deformation gradient tensorφin a two-dimensional space is calculated by Eq.4:

Fig.1 The forward FTLE field (a) and backward FTLE field (b) of the double gyre with the same parameter values of Jakobsson Johan (2012)
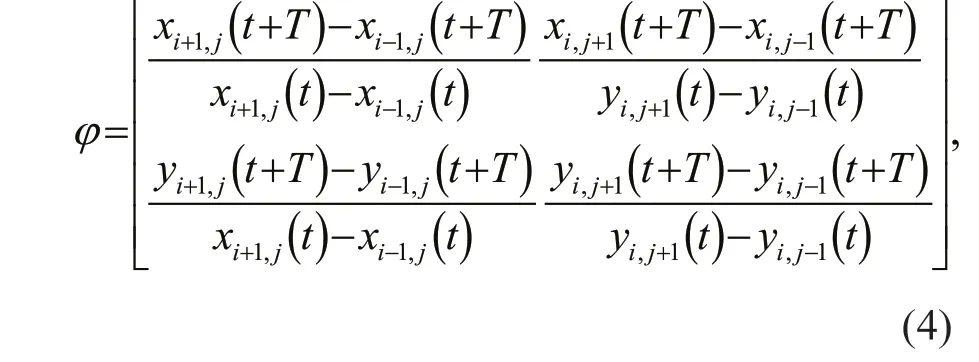
wherexandyare spatial coordinates, andiandjare grid node numbers.
LCS is defined as the ridges of FTLE fields and lines of local maximum with a steep gradient, which can be easily identified in the FTLE fields (Huhn,2012). Although FTLE ridges are not always perfect indicators of the LCSs (Haller, 2002; Shadden et al.,2005), they perform well in a large number of applications (Peacock and Dabiri, 2010).
Equation 2 can be integrated in either forward or backward time. When the time goes fromt0tot1, the forward time integration identifies ridges of repelling LCS (rLCS). This can be understood as material transport line or surface. When the time goes back fromt1tot0, the backward time identifies attracting LCS (aLCS), which can be understood as the accumulation line or the boundary of the accumulation area during the material transportation (Hsu, 2013).In this study, the LCS represents the rLCS and aLCS,we focus on the path of materials transport, which corresponds to the rLCS.
In this study, time variant double gyre flow field is used to prove the feasibility of the program. The calculations of the FTLE field were programmed by MATLAB. The calculation results of the FTLE fields(Fig.1) is consistent with those of Jakobsson (2012),which shows that the calculation program can be used for subsequent calculation.
2.2 The hydrodynamic model
Finite volume community ocean model (FVCOM)is used to simulate the current field of the study area.In the model, coordinate transformation was used to represent the complex bottom slopes and surface elevations. The model area included the entire Bohai Sea (Fig.2a). The open boundary at the eastern edge of the model area extended cross through the Yellow Sea from Chengshantou to Dandong City. The horizontal resolution can vary spatially, and the grid scale ranged from 200 m in coastal areas to 5 000 m near the open boundary. In three dimensional (3D)simulations, the vertical grid is defined following the sigma coordinates approach, divided into five layers.In this study, the surface velocity is used to calculate the FTLE. The water depth data is based on the Electronic Chart (11 011 and 11 800) published by the The Navigation Guarantee Department of the Chinese Navy Headquarters in 2014, combined with the measured data. The water depth of each grid node in the calculation area is obtained by linear interpolation. The bottom roughness value is treated as a constant of 0.001 0 m. The initial water level and velocity of the entire simulated flow field were set to zero, and the boundary forcing conditions are tide and runoff. The runoffdata of the Huanghe (Yellow)River refer to the data of the Huanghe River Network(http://www.yrcc.gov.cn/dt/). The model is forced by four primary tidal constituents (M2, S2, K1, and O1)at the open boundaries. The calculation time of the model is from Jun. 1, 2019 to Aug. 31, 2019. The time step was set to 1 h for all experiments in this study.
The sea surface wind data is obtained from European Centre for Medium-Range Weather Forecasts (ECMWF), and the Fifth-generation Reanalysis (ERA5) dataset is applied in this study.ERA5 provides the higher time resolution (hourly),and the finer spatial resolution (0.25°×0.25°). The dataset covers the time range from August 9 to 13,2019.
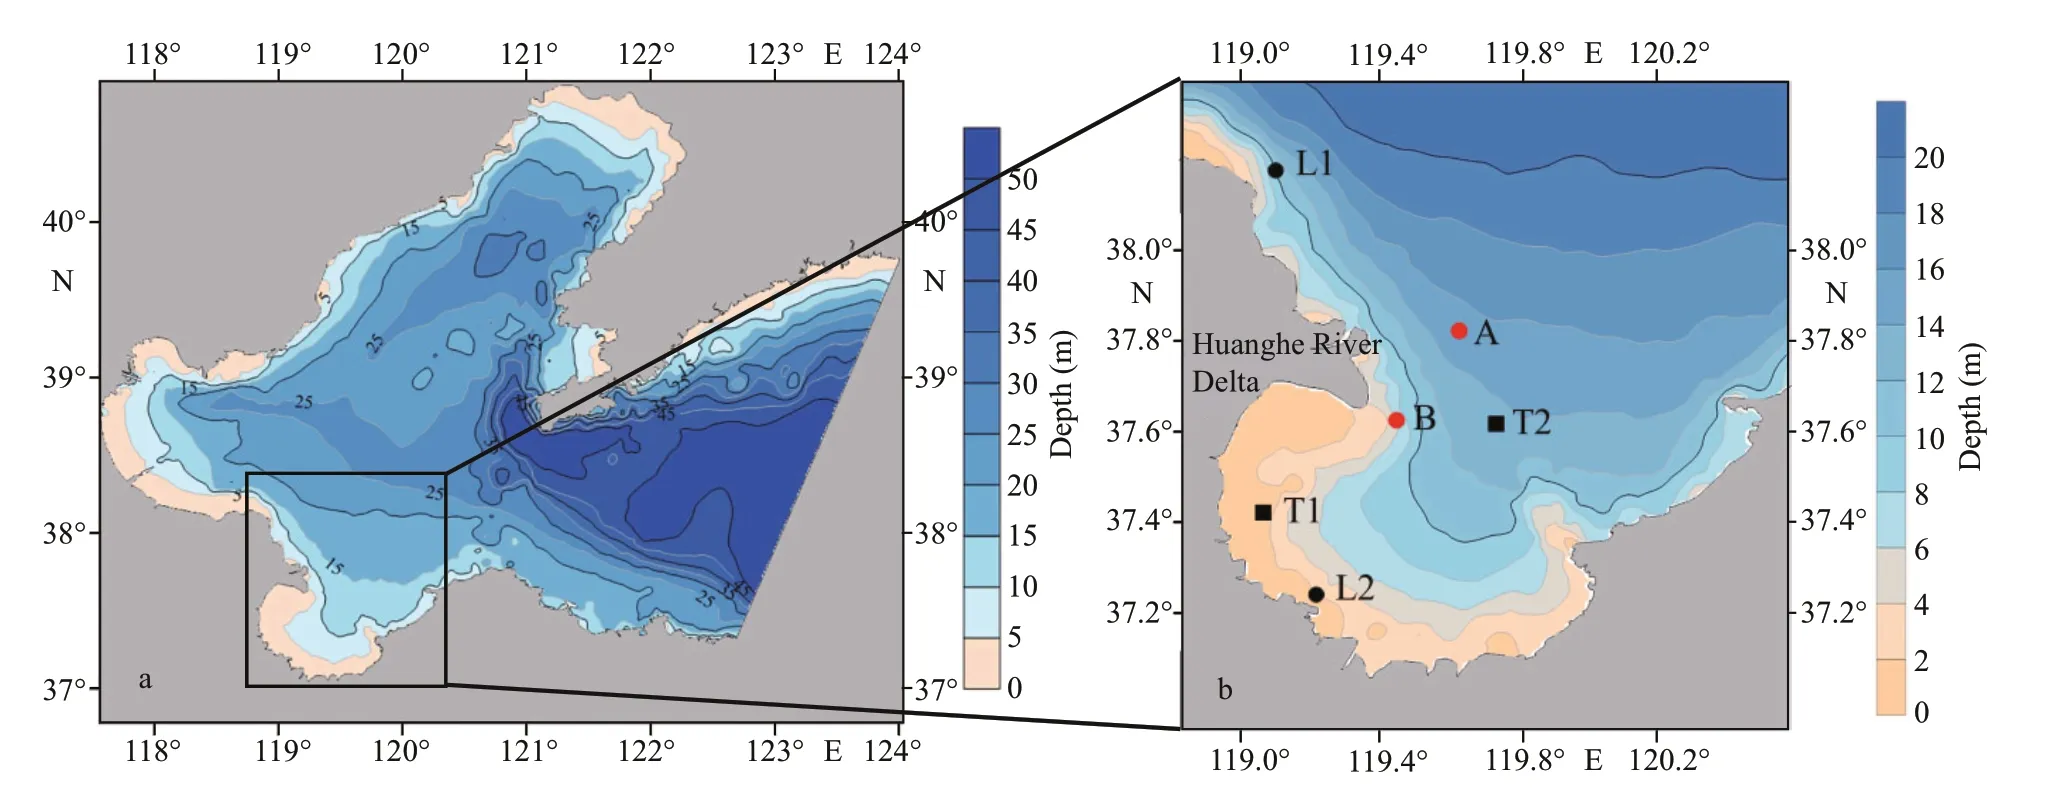
Fig.2 Water depth of hydrodynamic model area (a) and the study area (b)

Fig.3 Comparisons of the data from tide tables and computed water levels during July 1-31, 2019 at L1 and L2
3 RESULT AND DISCUSSION
3.1 Model validation
In order to verify the accuracy of the model, we selected two stations in the LZB from tide tables(NMDIS, 2018), and compared the simulated water lever with the results in the tables (Fig.3). Pearson correlation coefficient between model results and forecast data is 0.921 at L1, and 0.989 at L2. This shows that the tidal simulation results are credible.
The current velocity at the two stations A (37°37′N,119°23′E) and B (37°48′N, 119°32′E) was monitored at 1-h interval from 19∶00 on June 6, 2016 to 19∶00 on June 7, 2016. The time series comparison of surface current speed and direction between model and the observations are shown in Fig.4 (the measured values are in blue and the numerical simulations are in red).The simulated results of the flow direction and current speed fit well with the observation results at station B.Near the station A, it not fit very well, due to the amphidromic points of Lunar Semidiurnal Tide (M2)and Solar Semidiurnal Tide (S2) , where the flow field is complex. The reason also could arise from lower accuracy of the current meter instrument and position errors that are intrinsic to the and GPS-tracked drifters. In general, the model can provide reasonable hydrodynamic driving conditions for particle tracking.
3.2 Tide and tidal currents
Water level and currents in LZB are numerically simulated by FVCOM. The results are shown in Fig.5 at representative stations T1 and T2. From August 10-12, 2019. The wind direction on the sea surface changed from southerly to northerly, and the wind speed increased to the maximum of 17 m/s. The water level change is slightly delayed, and the obvious flood time is about half a day later than that in gale period.The speed of surface currents flow into the LZB increases during the high tide up to more than 1.5 m/s.The current directions of the coastal seawater in LZB have changed from longshore to onshore. For T2 station at the mouth of the bay, the westward component of the velocity increases, which make the velocity slightly decrease at ebb tide and increases slightly at flood tide. However, the overall change is not as obvious as that inside the bay. All the velocity changes mean that pollutants in the Huanghe River estuary are easy to enter and accumulate in LZB. At the same time, the pollutants in LZB are difficult to transport out of the bay.
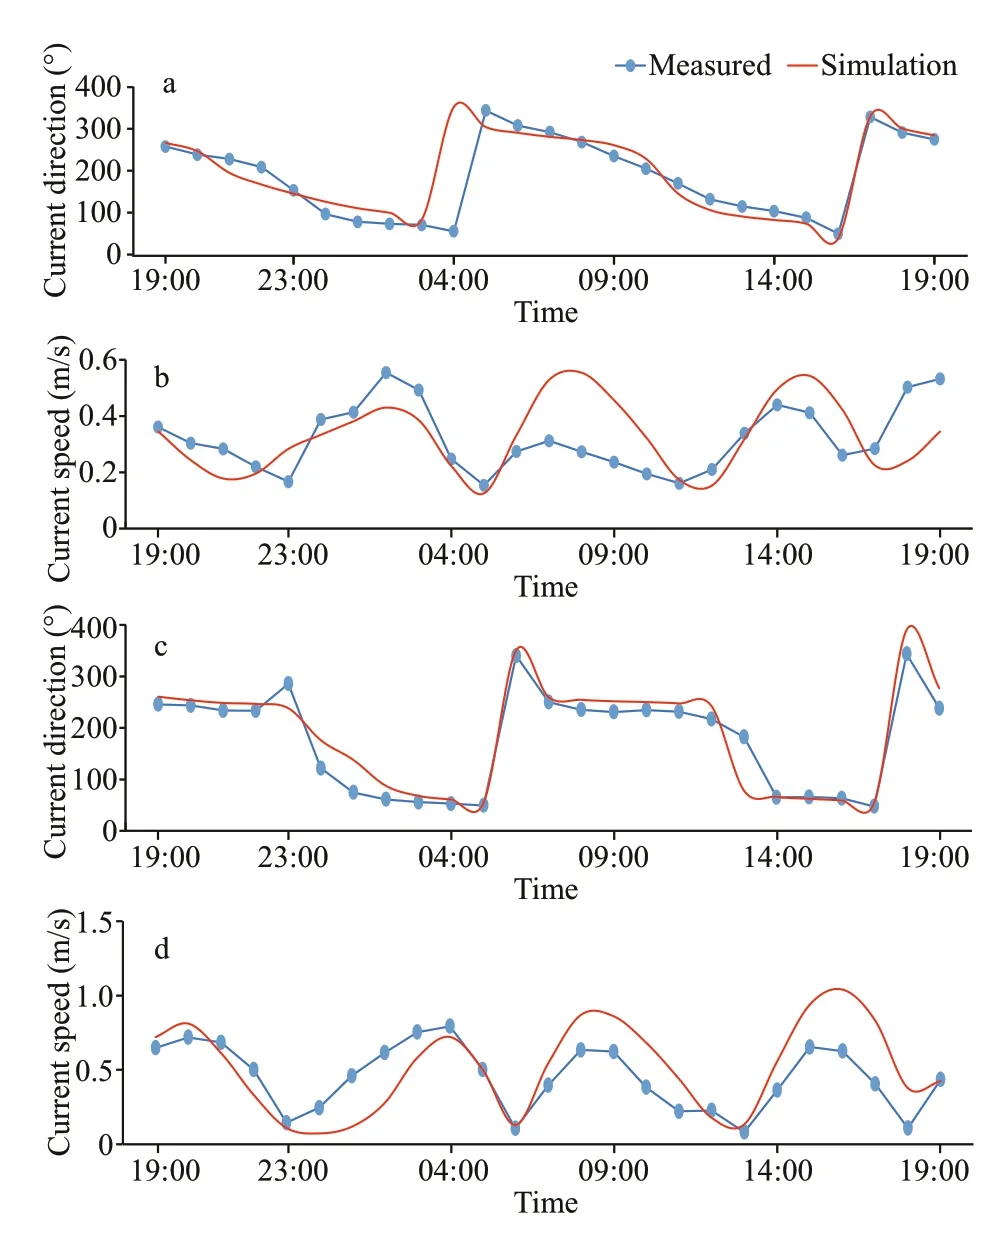
Fig.4 Comparisons of the current direction and speed from the simulation values and measured values at stations A (a and b) and B (c and d)
3.3 Lagrangian residual currents
Lagrangian residual current is defined as the displacement of a water particle divided by the corresponding time interval. The Lagrangian residual current filed can be calculated using the numerical methods based on particle tracking. The results are shown in Fig.6 under tide condition and Fig.7 under the condition of tide and typhoon.
Figure 6 shows that the residual current of the whole LZB is small, the average is 0.01 m/s, and the maximum is ~0.08 m/s. For the different initial moments, the residual current changes greatly. At high tide, water flows into the bay from the east,forming a clockwise vortex in the north of the bay,and an anticlockwise in the middle. However, at the falling and low tide, the water in the Huanghe River estuary flows southward, then anticlockwise circulation northward in LZB, and flows out from the northwest with the current from the East. The results of the two moments are consistent with those of Zou et al. (2018). There is a clockwise residual current vortex at the south of the old Huanghe River estuary in the west of LZB. The direction of residual current in the bay in this study is basically the same as that from observation stations in LZB in Chen et al.(2015). It is also consistent with the conclusion that an anticlockwise circulation is formed in the western part of the bay.
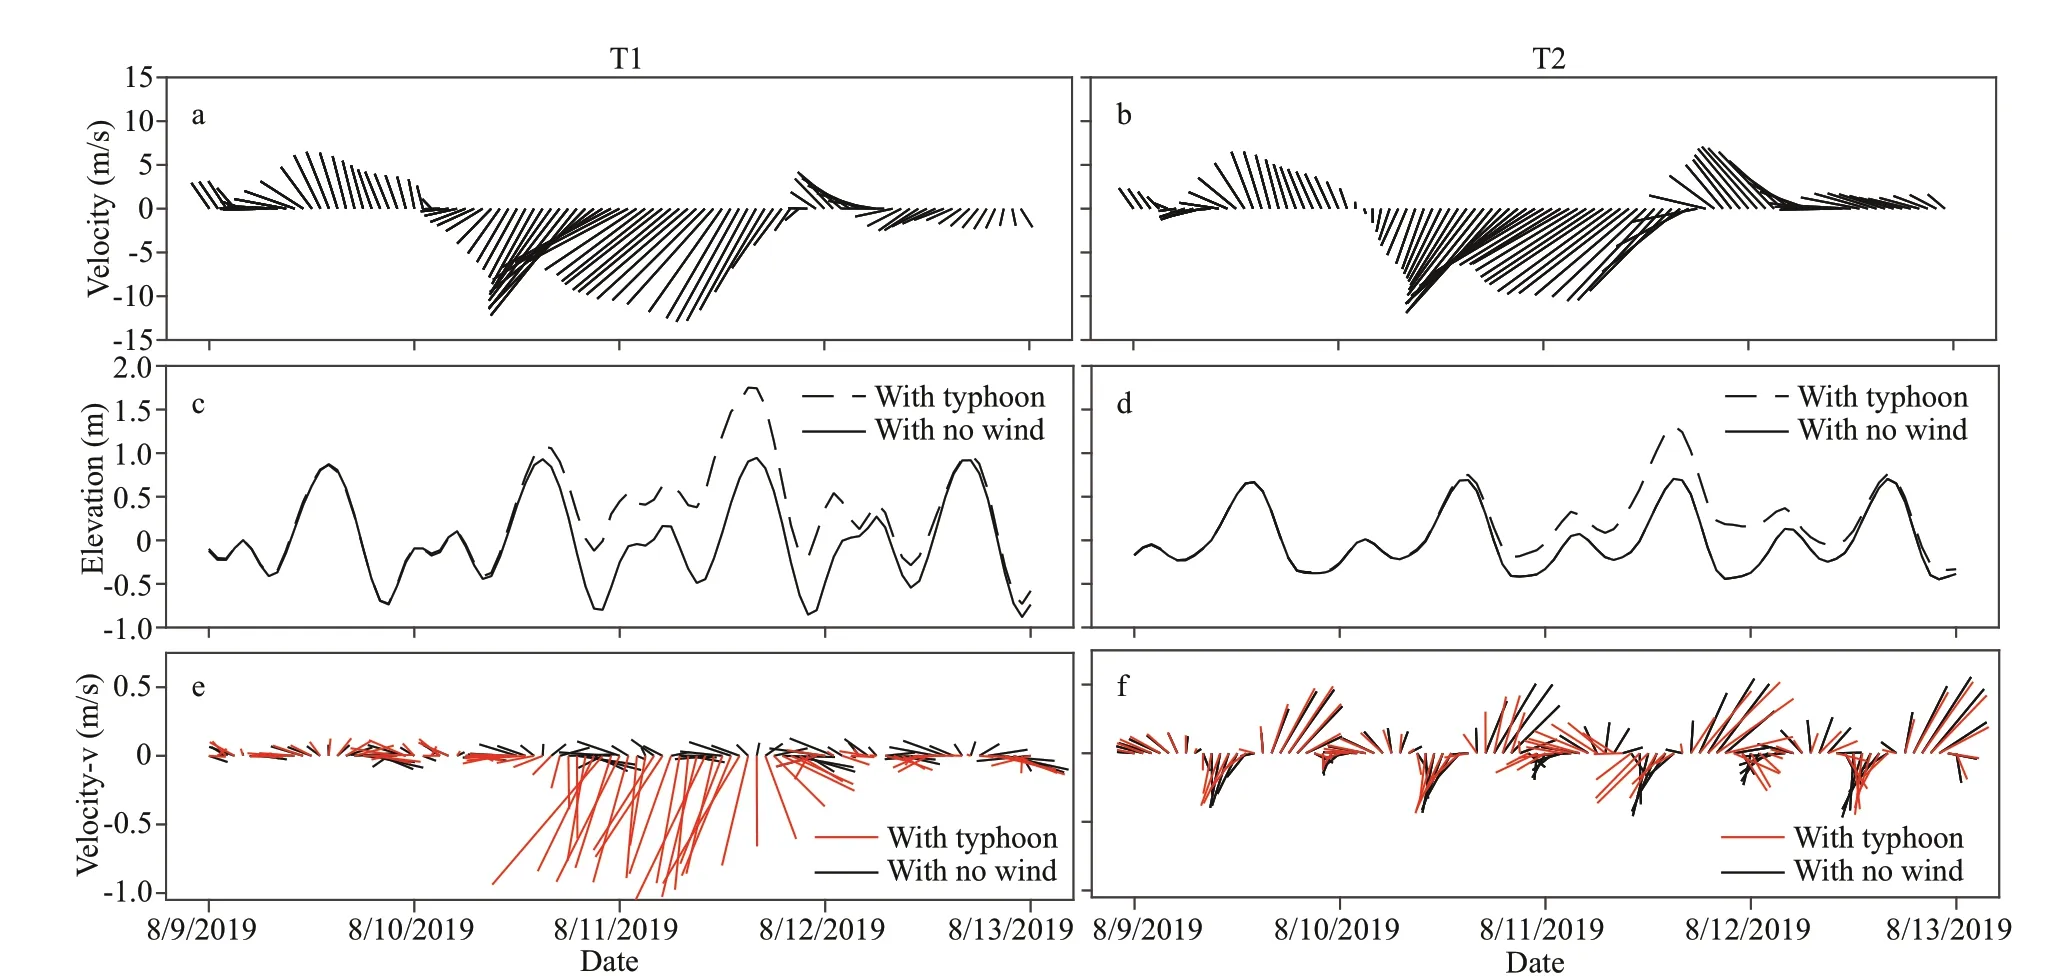
Fig.5 Wind speed and direction (a and b), sea surface tidal elevations (c and d) and currents (e and f) at stations T1 and T2
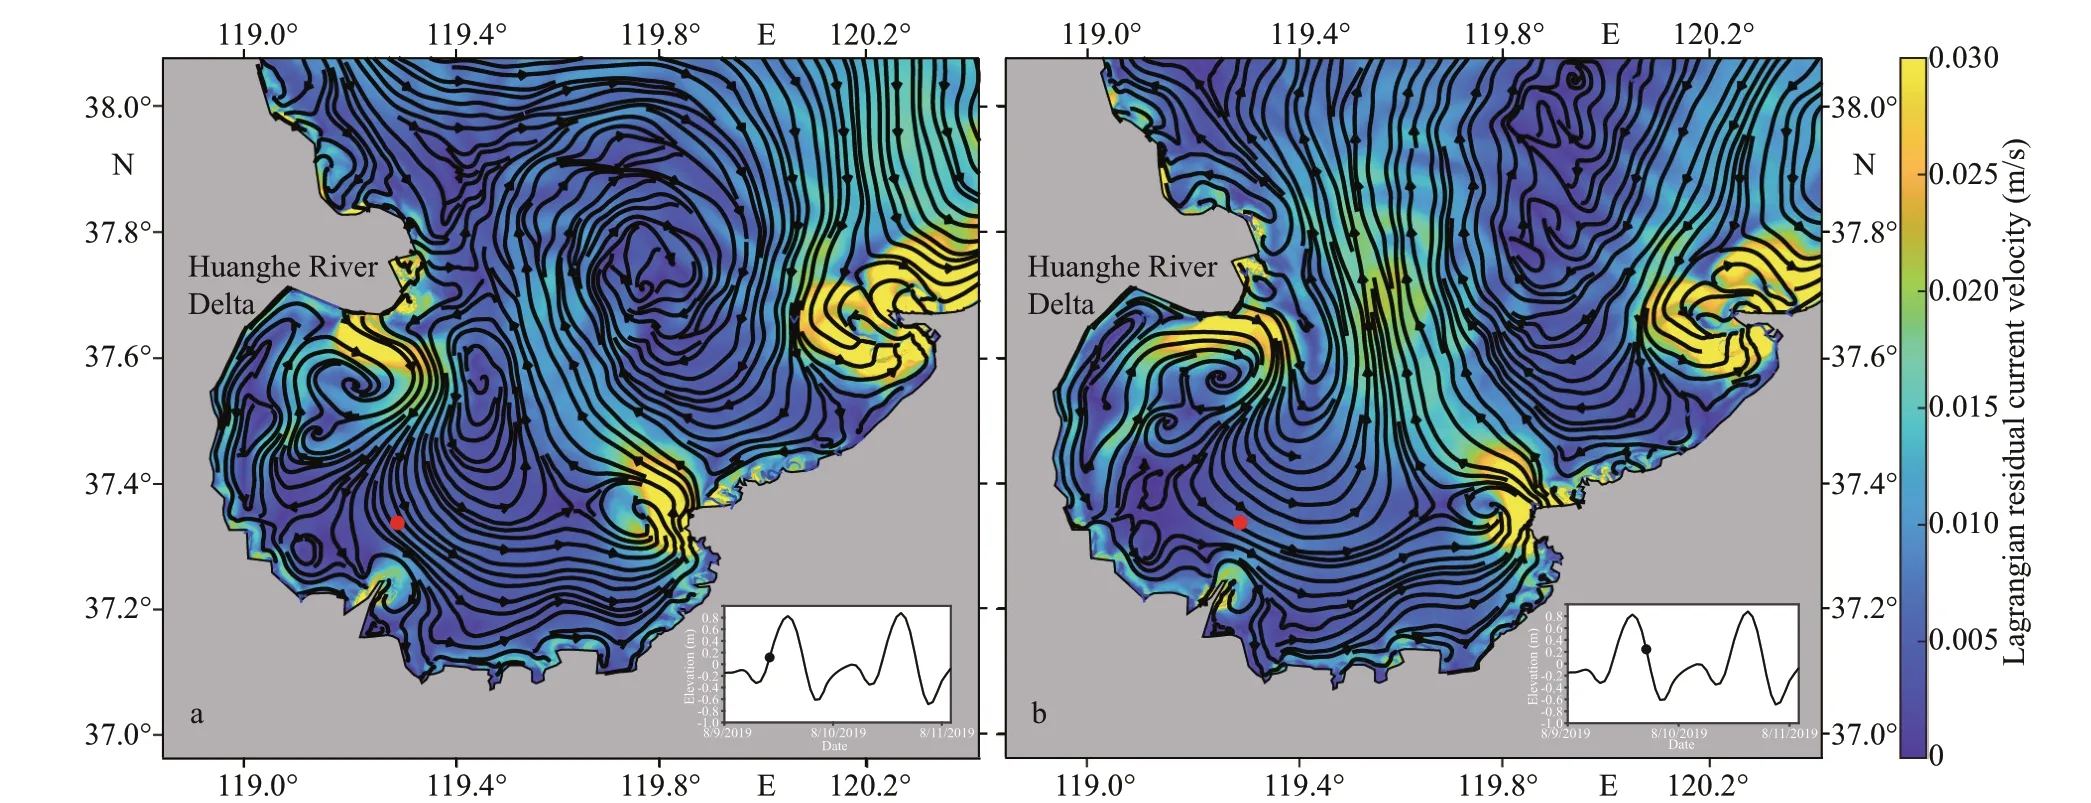
Fig.6 Lagrangian residual current streamline at flood tide (a) and ebb tide (b) for 50 h
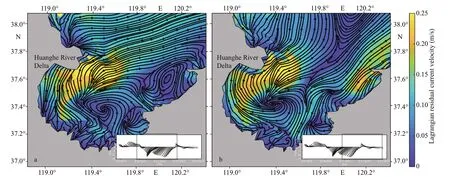
Fig.7 Lagrangian residual current streamline for 50 h shown in the box at the lower right corner, with start time of 20∶00,August 9, 2019 (a) and 21∶00, August 10 (b)
The typhoon has greatly changed the residual current field. Figure 7a covers 50 h of the gale period.The residual currents of the whole LZB flow into the bay, and its direction is basically the same as the wind.Due to the influence of sea surface wind field, the clockwise vortex in the south of the Huanghe River delta disappeared, and an anticlockwise circulation is formed in the middle of the bay. The time period in Fig.7b covers the later period of the gale and the period when the typhoon passes. The water flows from the west of the bay mouth, and then forms an anticlockwise vortex in the middle of LZB. The water in the east of the bay flows out from northward along the coast. The average value of residual current is about 0.098 m/s,and the maximum is greater than 0.3 m/s.
3.4 Tide induced rLCSs
The Lagrangian residual current depends on the time when a particle starts to move. In contrast, LCS is a more robust description. In this study, the effects of particle release time and integral duration on LCSs were analyzed through scenario experiment.
In scenario experiment 1, the effect of integral duration of particle tracking on FTLE field is studied.This study takes forward-time FTLE as an example.In the simulated hydrodynamic field, the particles are uniformly released at a 200-m interval. The FTLE field in LZB is obtained by calculating the FTLE value every 200 m. Figure 8 shows the distribution of FTLE field at different integral duration. The coherent structures were initially formed in 50 h and became stable after 200 h.
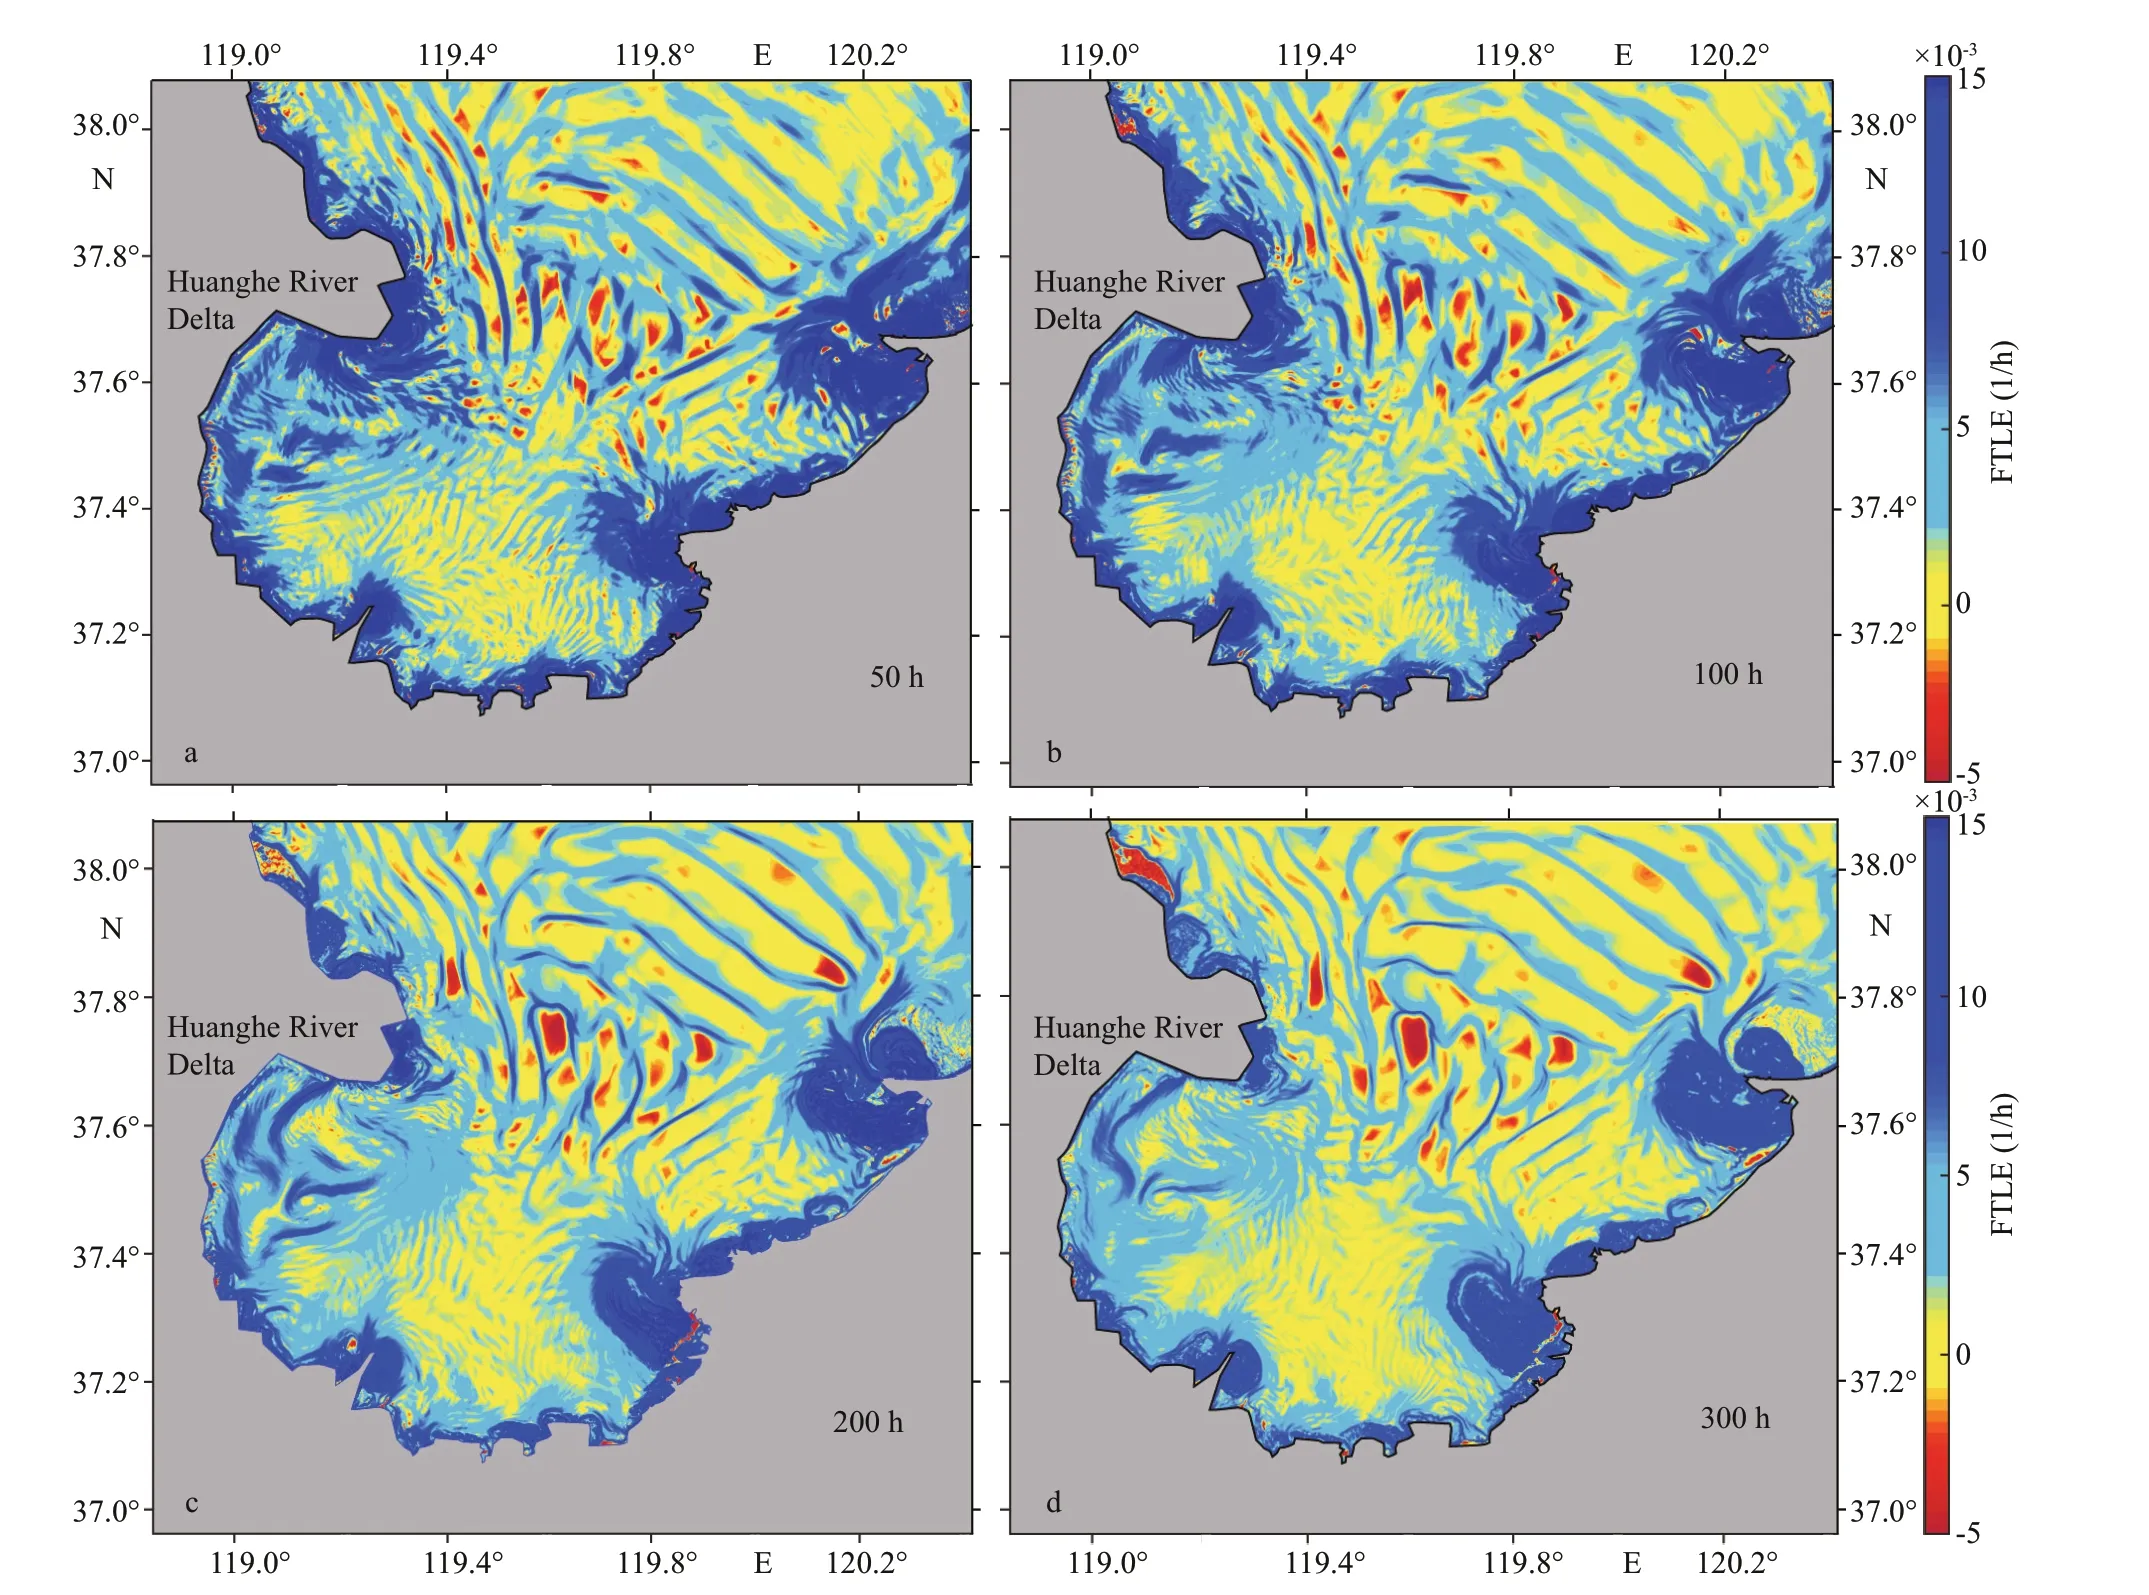
Fig.8 Forward FTLE fields for integration time 50 (a), 100 (b), 200 (c), and 300 (d) h at flood tide (5∶00 on August 9)
The probability statistics of different results are carried out with integral duration of 50, 100, 200, and 300 h. The statistical results are shown in Fig.9. Most values of the FTLE in LZB are from -0.005 to 0.01,and the probability distribution of each group is basically the same. Therefore, when calculating the tidal Lagrangian coherent structure in LZB, the integration time can be selected as 50 h to save calculation time. At the same time, the statistical results show that LCS is not sensitive to the change in integral duration.
Scenario experiment 2, the effect of particle release time on FTLE field is studied. The initial distribution of particles is the same as experiment 1. The results are shown in Fig.10. There is almost no difference in the direction and position of the FTLE values at the four typical particle release moments (high tide, flooding,low tide, and low tide). Results show that when the integral time is 50 h, FTLE field is not sensitive to the particle release time in LZB, because the tide of LZB is a ~25-h cycle of regular semidiurnal tide.
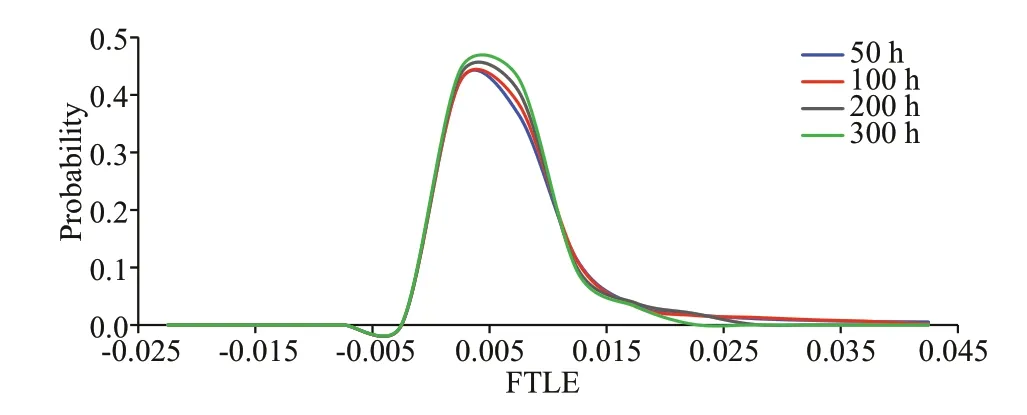
Fig.9 The probability density distribution of FTLE
Taking the integrated 50-h FTLE field as an example, the LCS structure in LZB is analyzed.Figure 9 shows the distribution of forward-time FTLE fields. The ridge of the FTLE is the rLCS, which can be easily detected from the FTLE field.
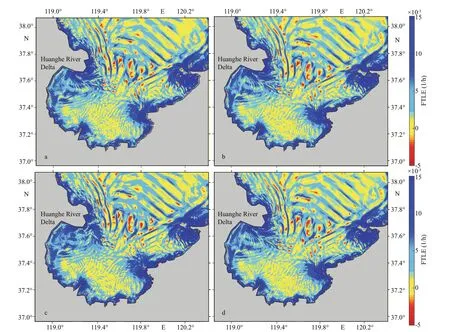
Fig.10 Forward FTLE fields for integration time 50 h at flood tide (a), high tide (b), ebb tide (c), and low tide (d)
The values of FTLE are mainly positive. It shows that there is a high degree of substance separation and a high degree of water mixing on the water surface.The values of FTLE in the middle region of LZB are low (close to zero): these indicate regions with poor exchange of the upper water, and there is a barrier to transport between regions of strong and weak mixing.If pollution is injected in this region of poor mixing, it will remain there for a long time, while pollution injected in a large FTLE region spread rapidly. It indicates that the transportation time of floating pollutants from the bay to the outside is longer.Affected by the topography of the Huanghe River estuary, there are banded rLCSs outside the Huanghe River delta, indicating that the materials from the Huanghe River into the Bohai Sea tend to transport in southeast- northwest direction. Due to the influence of shoal topography in LZB, the obvious rLCSs indicate that the material diffuses strongly in the eastern part of LZB, around Diaolongzui and Longkou headland.
3.5 Tide and typhoon induced rLCSs
Under the combined action of tide and the strong wind during typhoon, the values of forward FTLE in LZB increased. The ridge line moved eastward, and the banded rLCSs disappeared outside the Huanghe River delta in Fig.11a. This indicates that the diffusion ability of material has been strengthened.
Most of the forward FTLE values in the southern coastal area of LZB are negative, which indicates that the material in the coastal area is transported to the shore under the operation of a northward wind field.However, there is a banded channel parallel to the coastline from the outer edge of the Huanghe River estuary, which makes it difficult to transport the coastal materials to the sea. There is a patchy area in the middle of LZB, where material tends to accumulate. The dynamic mechanism can be reflected by the residual current field in Fig.7. There is a strong counterclockwise residual current vortex in this area.
In the latter half time of the typhoon in Fig.11b,the material transport channel along the coast moves towards the shore, and the trend of material transport to the shore decreases. The patchy area in the middle of the bay still exists, indicating that the material accumulated in this area is not easy to diffuse.
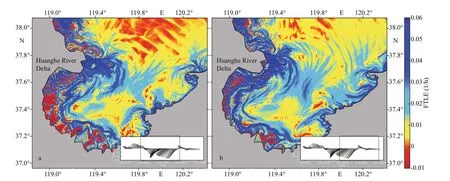
Fig.11 The forward FTLE fields in LZB at mid-range time (a) and the latter half time (b) of typhoon
3.6 Comparison of LCSs and satellite remote sensing results
Since the instantaneous distribution of the floating material approaches to attracting material curves which related to the backward FTLE, we compared structures in the satellite images with the backward FTLE fields.
We collected the Sentinel-2 L1C satellite images before and after the typhoon Lekima in 2019. The different color in satellite images mainly comes from the distribution of suspended particles, which is affected by many processes such as material transportation and bottom resuspension. In this study,we compare the calculated backward FTLE fields with the structures in satellite images. High backward FTLEs show maximum attraction, which act as barriers to transport and mixing. There is no flux across an LCS, and hence LCS can divide a flow into regions with disparate properties (May-Newman et al., 2016).
In the condition of tide, the area with high concentration of suspended solids (region 2 in Fig.12a) near the Huanghe River estuary before typhoon is consistent with the high value region in backward time FTLE field. The region of the low concentration area (region 1 in Fig.12a) is basically consistent with the low value area of aLCSs nearby.After the typhoon, the FTLE values increase in the bay. The material accumulation area around the Huanghe River delta still exists (region 3 in Fig.12b).The banded aLCSs in the middle part of the bay (lines a-c in Fig.12b) prevented the mixing of material on both sides. The material accumulated in the middle of the bay is not easy to spread to the outside of the bay,which is consistent with the results of forward calculation.
It approved that using LCSs to describe the material transport and spatial distribution was reliable.
4 CONCLUSION
Based on FVCOM model, the Lagrangian coherent structure is introduced to study the fluid transport process in the Laizhou Bay under the condition of tides and typhoon. The Lagrangian coherent structure is not sensitive to the initial time and integral time.Our comparison between the numerical results and the satellite images shows that LCSs can well describe the fluid transport under the influence of tides and typhoon.
There are several banded rLCSs outside the Huanghe River estuary under the tidal condition,which led to the material transport around the headland of the Huanghe River estuary, and a typical arc-shaped suspended matter front is formed outside the Huanghe River estuary. However, under the condition of tide and typhoon, the banded rLCSs outside the Huanghe River estuary disappeared, and the suspended solids were transported eastward. The structure of the suspended sediment front is consistent with that of the rLCS during typhoon. A patch area is formed in the middle of Laizhou Bay corresponding to the Lagrangian residual current vortex. In the near shore area, there is a banded rLCSs parallel to the coastline, and the materials tend to transport along the channel to the east and middle of the bay. The banded aLCSs in the middle part of the bay prevented the mixing of material on both sides. The material accumulated in the middle of the bay is not easy to spread outside the bay.
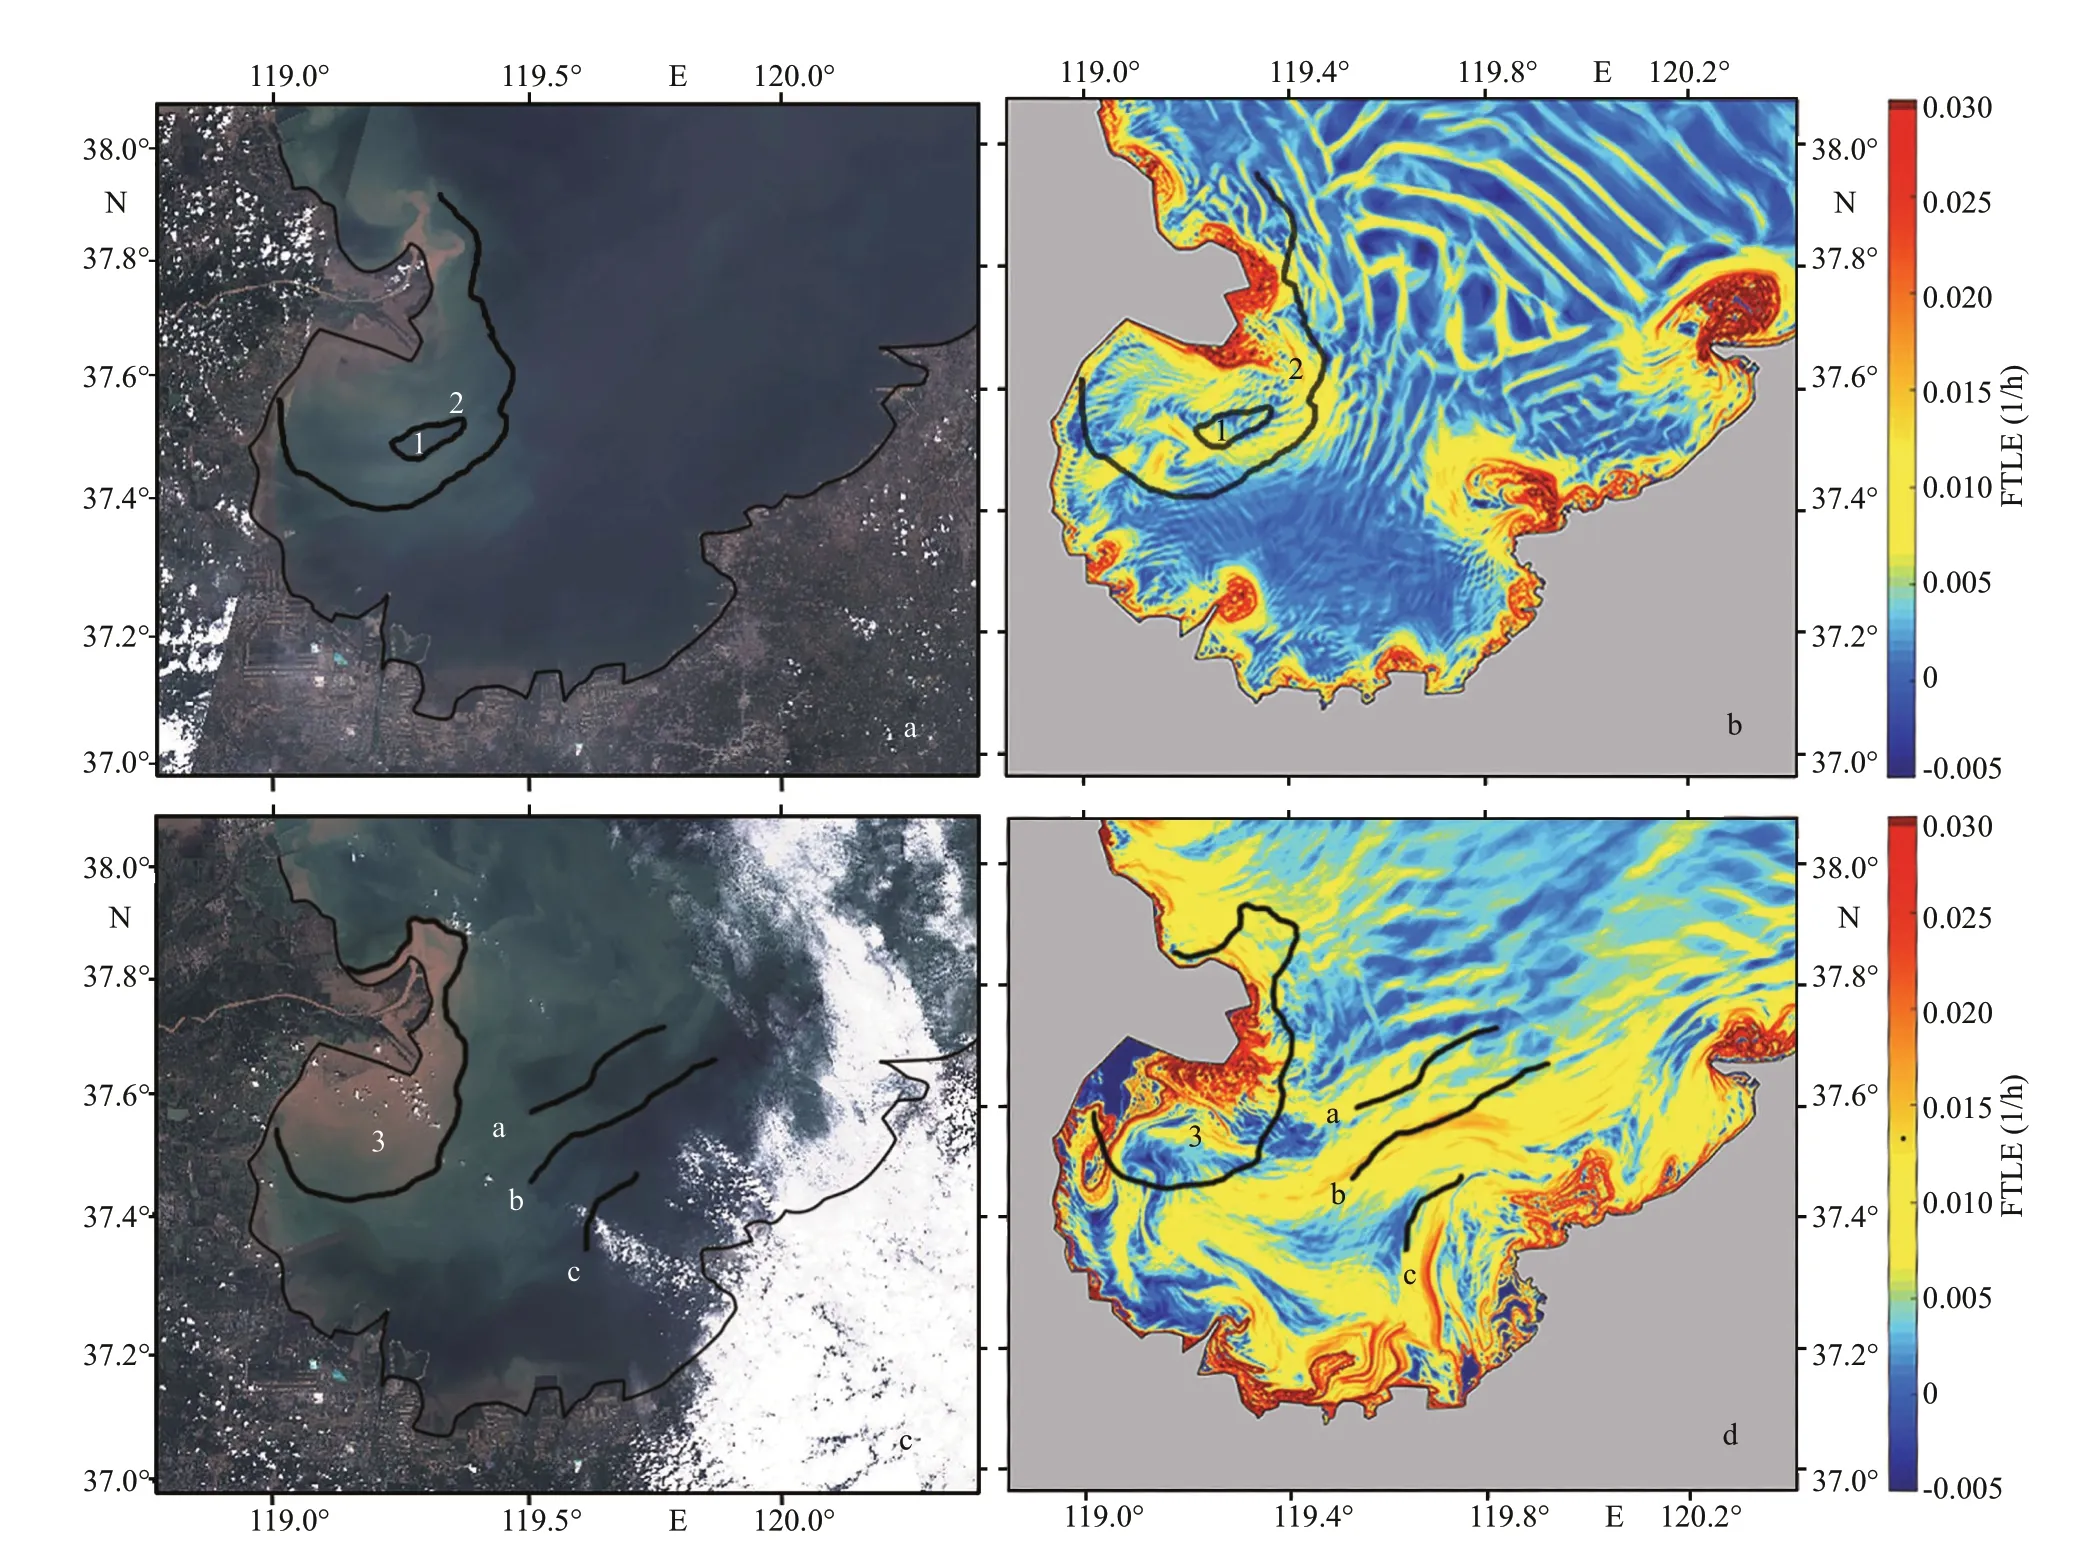
Fig.12 The Sentinel-2 L1C satellite images (a and c) and backward FTLE fields (b and d) before (August 8, 2019) (a and b)and after (August 15, 2019) (c and d) Lekima passing
The LCS method is effective for studying material transportation and distribution during the typhoon in the Laizhou Bay. However, under the strong mixed action of typhoon, the mixing of material in water is a three-dimensional phenomenon. This study is the first step, while full dimensional phenomenon will be captured in the future study.
5 DATA AVAILABILITY STATEMENT
The datasets generated and/or analyzed during the current study are available from the corresponding author on reasonable request.
 Journal of Oceanology and Limnology2022年3期
- Journal of Oceanology and Limnology的其它文章
- Typhoon-induced wind waves in the northern East China Sea during two typhoon events: the impact of wind field and wave-current interaction*
- Effect of subsea dispersant application on deepwater oil spill in the South China Sea*
- Geochemical characteristics of cold-seep carbonates in Shenhu area, South China Sea*
- Examination of seasonal variation of the equatorial undercurrent termination in the Eastern Pacific diagnosed by ECCO2*
- Deviation of the Lagrangian particle tracing method in the evaluation of the Southern Hemisphere annual subduction rate*
- Immunostimulatory effect of quaternary degree and acetyl group of quaternized chitosan on macrophages RAW 264.7*
