Internal solitary wave generation by the tidal flows beneath ice keel in the Arctic Ocean*
Peiwen ZHANG , Qun LI , , Zhenhua XU , , Baoshu YIN
1 CAS Key Laboratory of Ocean Circulation and Waves, Institute of Oceanology Chinese Academy of Sciences, Qingdao 266071,China
2 Pilot National Laboratory for Marine Science and Technology (Qingdao), Qingdao 266237, China
3 Center for Ocean Mega-Science, Chinese Academy of Sciences, Qingdao 266071, China
4 College of Earth and Planetary Sciences, University of Chinese Academy of Sciences, Beijing 100049, China
5 MNR Key Laboratory for Polar Science, Polar Research Institute of China, Shanghai 200136, China
6 CAS Engineering Laboratory for Marine Ranching, Institute of Oceanology, Chinese Academy of Sciences, Qingdao 266071,China
Abstract A series of non-hydrostatic, non-linear numerical simulations were carried out to investigate the generation and evolution of internal solitary waves (ISWs) through the interaction of a barotropic tidal current with an ice keel in the Arctic Ocean. During the interaction process, the internal surge was generated at first, and then the wave gradually steepened due to non-linearity during its propagation away from the ice keel. The internal surge eventually disintegrated into multi-modal and rank-ordered ISW packets with the largest having an amplitude of O(10) m. Sensitivity experiments demonstrated that the ISWs’ amplitudes and energy were proportional to the varying ice keel depths and barotropic tidal flow amplitudes, but were insensitive to the changing ice keel widths. Typical ISWs can enhance the turbulent dissipation rate of O(10-6) W/kg along their propagation path. Further, heat entrainment induced by the wave-ice interaction can reach O(10) MJ/m per tidal cycle. This study reveals a particular ISW generation mechanism and process in the polar ice environment, which could be important in impacting the energy transfer and heat balance in the Arctic Ocean.
Keyword: internal solitary wave (ISW); barotropic tidal flow; ice keel; the Arctic Ocean
1 INTRODUCTION
Internal solitary waves (ISWs) are important in the energy transfer and dissipation in the stratified ocean(Liu et al., 2004; Guo et al., 2011). These energetic waves can propagate far from their source sites (Chen et al., 2011; Liu et al., 2013). The evolution and breaking of ISWs can usually induce significant mixing locally, enabling them to potentially transport nutrients and accelerate vertical heat transportation(Lin and Song, 2014; Carr et al., 2015; Stastna et al.,2015). ISWs have been frequently observed at mid/low latitudes through both in-situ measurements and remote sensing techniques (Duda et al., 2004; Shroyer et al., 2009; Tedford et al., 2009; Alford et al., 2015).Based on these observations and theoretical analyses,the generation and evolution of ISWs have been extensively studied. ISWs can usually be generated in the stratified ocean by the interaction of barotropic tidal currents with the ridges or continental shelves(Nash and Moum, 2005; Xu et al., 2010; Guo and Chen, 2012; Song and Chen, 2020). The dominant generation mechanisms include non-linear disintegration of internal tides (Helfrich and Grimshaw, 2008), interaction of tidal beam with thermocline (Theo, 2001), evolution of lee-wave over topography (Maxworthy, 1979), collapse of a mixed layer (Maxworthy, 1979), frontally forced intrusion(Bourgault et al., 2016), and the gravity collapsing mechanism (Lin and Song, 2012).
The Arctic Ocean was once thought to be quiescence (Rainville and Woodgate, 2009). However,with the rapid decrease of sea ice, enhanced internal wave events have been observed more frequently in the last few decades (Kozlov et al., 2014; Fer et al.,2020). Besides low frequency internal waves such as internal tides and near-inertial waves (Xu et al., 2016;You et al., 2021; Zhao et al., 2021), high frequency ISWs were also hypothesized to play an important role in turbulent mixing and heat entrainment (Kozlov et al., 2017), yet our knowledge of them in the Arctic Ocean remains limited. Therefore, characterization of the evolution mechanism and process of the ISWs could provide potential pathways for the energy transport and redistribution in the Arctic Ocean.
In the Arctic Ocean, the history of internal wave research can be traced back to Viking and Roman times as the phenomenon of “dead water” (Ekman,1904). The Vikings and Romans noticed that it took much more effort to row their vessels at certain conditions, since some of their efforts went into overcoming internal waves. In the last several decades, internal tides, near-inertial internal waves,and lee-waves in the Arctic Ocean have attracted much attention (Fer et al., 2020; Guthrie and Morison,2021). By contrast, the generation and evolution of ISWs in the Arctic Ocean are poorly understood. In comparison with the mid/low latitudes, sea-ice is a significant factor in the polar environment (Robertson et al., 2001). A unique factor in the Arctic Ocean is the ice floe or keel, which provide an additional mechanism for internal wave generation there(Skyllingstad et al., 2003; Lu et al., 2011; Wang et al.,2014).
Recently, due to significant summer ice retreat, the two-dimensional propagation trails of ISWs in the Arctic Ocean have been detected more and more through synthetic aperture radar (SAR) images(Kozlov et al., 2017; Johannessen et al., 2019).Rippeth et al. (2017) showed that interactions of barotropic tides with ridges can induce ISW trains even poleward of the semidiurnal critical latitude(s).In addition, Marsden et al. (1994) captured the presence of ISWs beneath the ice cover downstream of an ice ridge. Combining the historical observations and investigations, a possible mechanism is hypothesized: the interaction of barotropic flows with the ice features, like keels, could generate ISWs. This potential mechanism could connect barotropic tides with turbulent mixing beneath the ice cover (Rippeth et al., 2017; Fer et al., 2020).
Due to the harsh environment and technical difficulties in the Arctic Ocean, direct ISW observations are hard to obtain. Instead, numerical simulations are a promising way to characterize the generation mechanism and evolution process of ISWs under the ice keel. In this study, a series of nonhydrostatic simulations were carried out to investigate ISW generation and evolution induced by barotropic tides flowing beneath ice keels. Sensitivity tests were further carried out to explore how different environmental factors affect the generation, including the ice keel characteristics and barotropic tidal strength. The effects of ISWs on energy transport,turbulent mixing, and heat entrainment were also quantitatively estimated.In Section 2, the detailed model configuration of numerical experiments, background stratification, the ice keel characteristics, and barotropic tidal strengths are provided. Section 3 discusses the generation and evolution of ISWs due to the interaction ofice keel with barotropic tides, as well as the results of sensitivity experiments. In Section 4, the detailed results are examined. The conclusions are summarized in Section 5.
2 MODEL SETUP
2.1 Configuration
The Massachusetts Institute of Technology General Circulation Model (MITgcm, Marshall et al., 1997)was utilized for the simulations. Fully non-hydrostatic and non-linear equations are solved, with the capability to reproduce the generation and evolution of ISWs. The SHELFICE package within the model,which is closely coupled to ocean component, was activated to simulate the ice shelves. With this package, the orography of an ice keel could be represented and embedded in the simulation. To introduce the barotropic tidal currents in the lateral boundaries, the OBCS package was applied, which is commonly set in similar experiments.
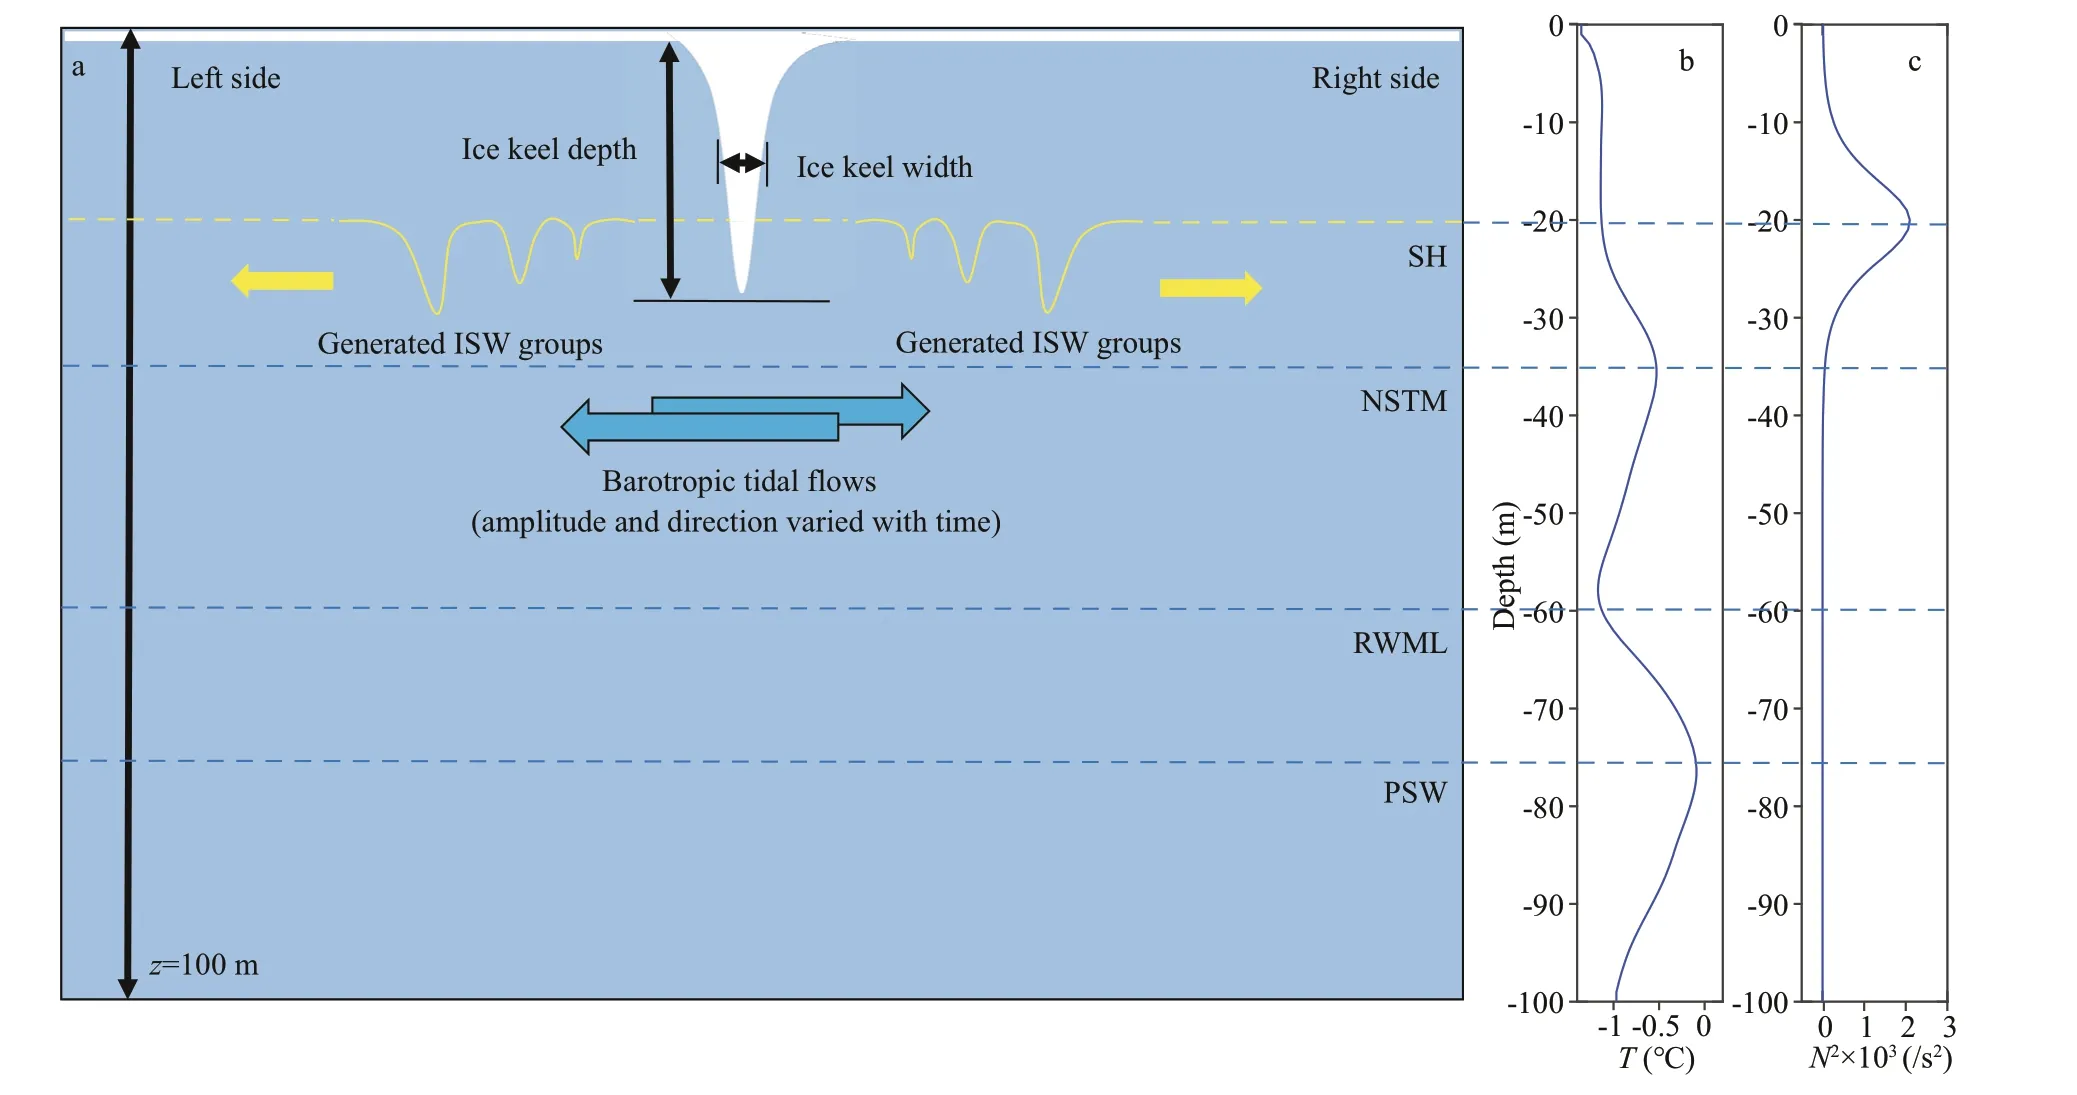
Fig.1 The sketch of numerical experiments (a) and the typical Pacific Arctic Ocean temperature profile (b) and stratification(c) applied in the experiments
A series of experiments were carried out to investigate the generation of ISWs beneath the ice keel with varying environmental factors. The design of experiments is shown in Fig.1. The experimental domain is two dimensional, with a stretched grid used to reduce the effects of reflection and wave-wave interaction. In the analytical domain fromx=-5 km tox=5 km, the horizontal grid resolution was 5 m and the grid aspect ratio was 1/5. Beyond the analytical domain, the grid size gradually coarsened to 105 m towards both lateral boundaries. Therefore, the focused region of the experiments was 10-km long, but the whole experiment region covered 545 km. The vertical grid resolution was 1 m, with 100 layers in all experimental regions without a terrain-following technique. In the simulation, the horizontal and vertical viscosity parameters were set as 1×10⁻³and 1×10⁻⁴m2/s,respectively (Zhang et al., 2018). The background horizontal and vertical eddy diffusivity parameters were set constantly as 1×10⁻⁵m2/s. The Coriolis frequency was set as 1.321 8×10⁻⁴/s, which represents~65 N°. The time step was set as 0.5 s to satisfy the Courant-Friedrichs-Lewy (CFL) criterion. All experiments were run for 4 M2tidal cycles (~50 h) and the M2tidal cycle was marked as “T”.
2.2 The characteristics of stratification and barotropic tidal flows
Typical temperature profile and stratification in the Pacific Arctic region are shown in Fig.1b & c, and were derived from the Ice-Tethered Profiler 18(ITP18) deployed in the Arctic. When the averaged ITP18 results are combined, a typical and smoothed stratification structure resulted and was used for all experiments. The main pycnocline, termed as summer halocline, was set at 20 m (Fig.1). Under the main pycnocline, a relatively high temperature region named Near Surface Temperature Maximum (NSTM)stores the heat absorbed during summer through solar radiation (Jackson et al., 2010). A deeper layer beneath the NSTM with saltier and cooler water, termed as the Remnant Winter Mixed Layer (RWML, Jackson et al., 2010), located within the upper 50-60 m. A warmer and saltier water named Pacific Summer Water (PSW, Timmermans et al., 2014) exists in the deeper water column. Noted that in our work, we mainly focused on the generation of ISWs beneath the ice keel, so the RWML and PSW layers were not of our concerns.
According to previous observations and numerical results, M2is the principal tidal component in the Pacific Arctic region (Rippeth et al., 2015). M2barotropic tidal currents can reach 0.25 m/s there at 100-m depth, based on the Arctic tidal current atlas(Baumann et al., 2020). The M2barotropic tidal period is 12.42 h, which is denoted as “T”. A set of simulations termed as B1-B4 were carried out to investigate the impacts of the barotropic tidal current amplitude on ISW generation. The detailed configuration of simulations is shown in Table 1.
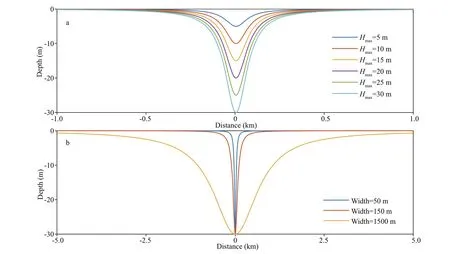
Fig.2 The widths and depths ofice keels used in the sensitivity experiments
2.3 The characteristics ofice keel
The ice keel was a reversed ridge-like underwater structure, and is formed by the compressed broken ice beneath the ice cover (Marchenko, 2008). Its depth can reach 30 m and pierce into the water column. An ice keel is usually depicted by the Versoria function(Skyllingstad et al., 2003):

wherehmaxis a maximum keel depth,ais a parameter to determine the keel width, which is termed as the horizontal extension in halved-depth ofice keel, andxrepresents horizontal distance. The depths of first year(FY) ice keels range from 3 to 30 m, and the widths range from 3 to 200 m (Strub-Klein and Sudom, 2012).For multi-year (MY) ice keels, their width can reach 1-2 km (Wadhams and Toberg, 2012). To investigate the effects of the varying depths and widths ofice keels, two sets of experiments marked as H1-H6 and W1-W3 were carried out, respectively. In H1-H6, the ice keel depth increased from 5 to 30 m, and the width ofice keel was set as 150 m (Fig.2a). Case H6 was the control case (termed as CTRL case). In W1-W3, the ice keel widths were set as 50, 150, and 1 500 m with the depth fixed at 30 m (Fig.2b).
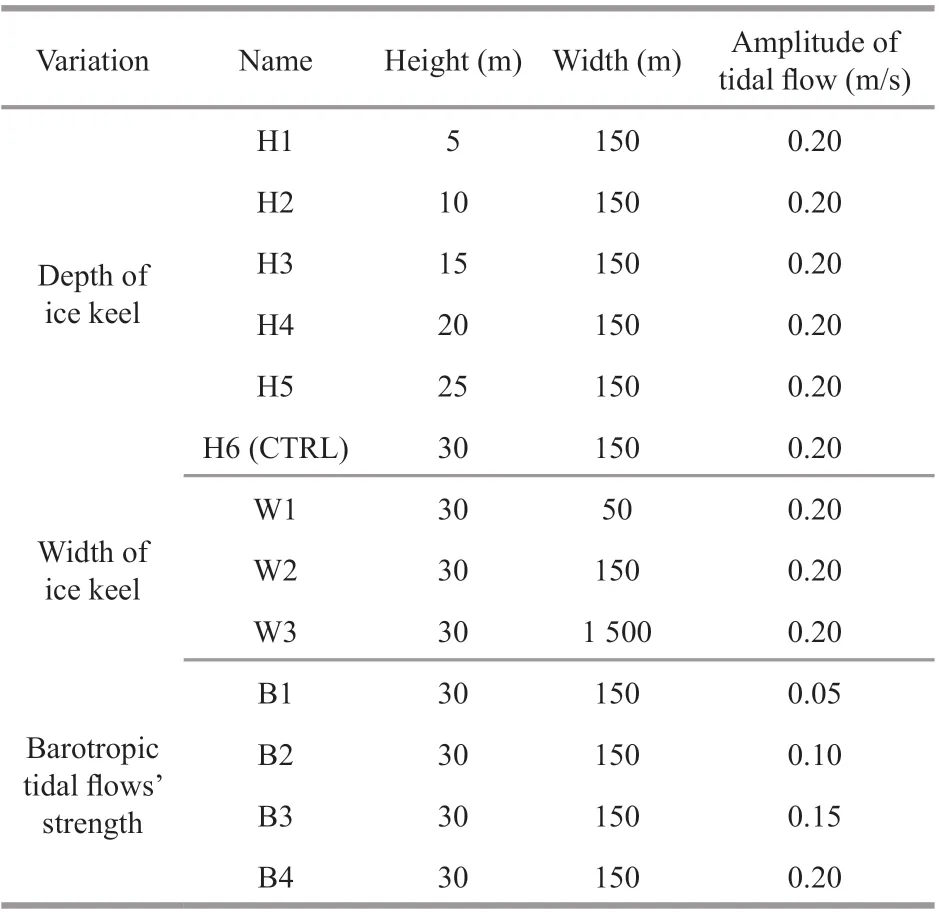
Table 1 The experimental configuration
3 RESULT
3.1 The ISW generation process beneath an ice keel
A series of zoom-in plots for density contours and baroclinic velocity fields demonstrate the generation process of ISWs by a barotropic tidal flow affecting an ice keel (Fig.3). Multiple parameters were examined to investigate the generation process of ISWs and reveal the mechanism. To capture the characteristics of ISWs, the horizontal baroclinic velocity was calculated as follow,
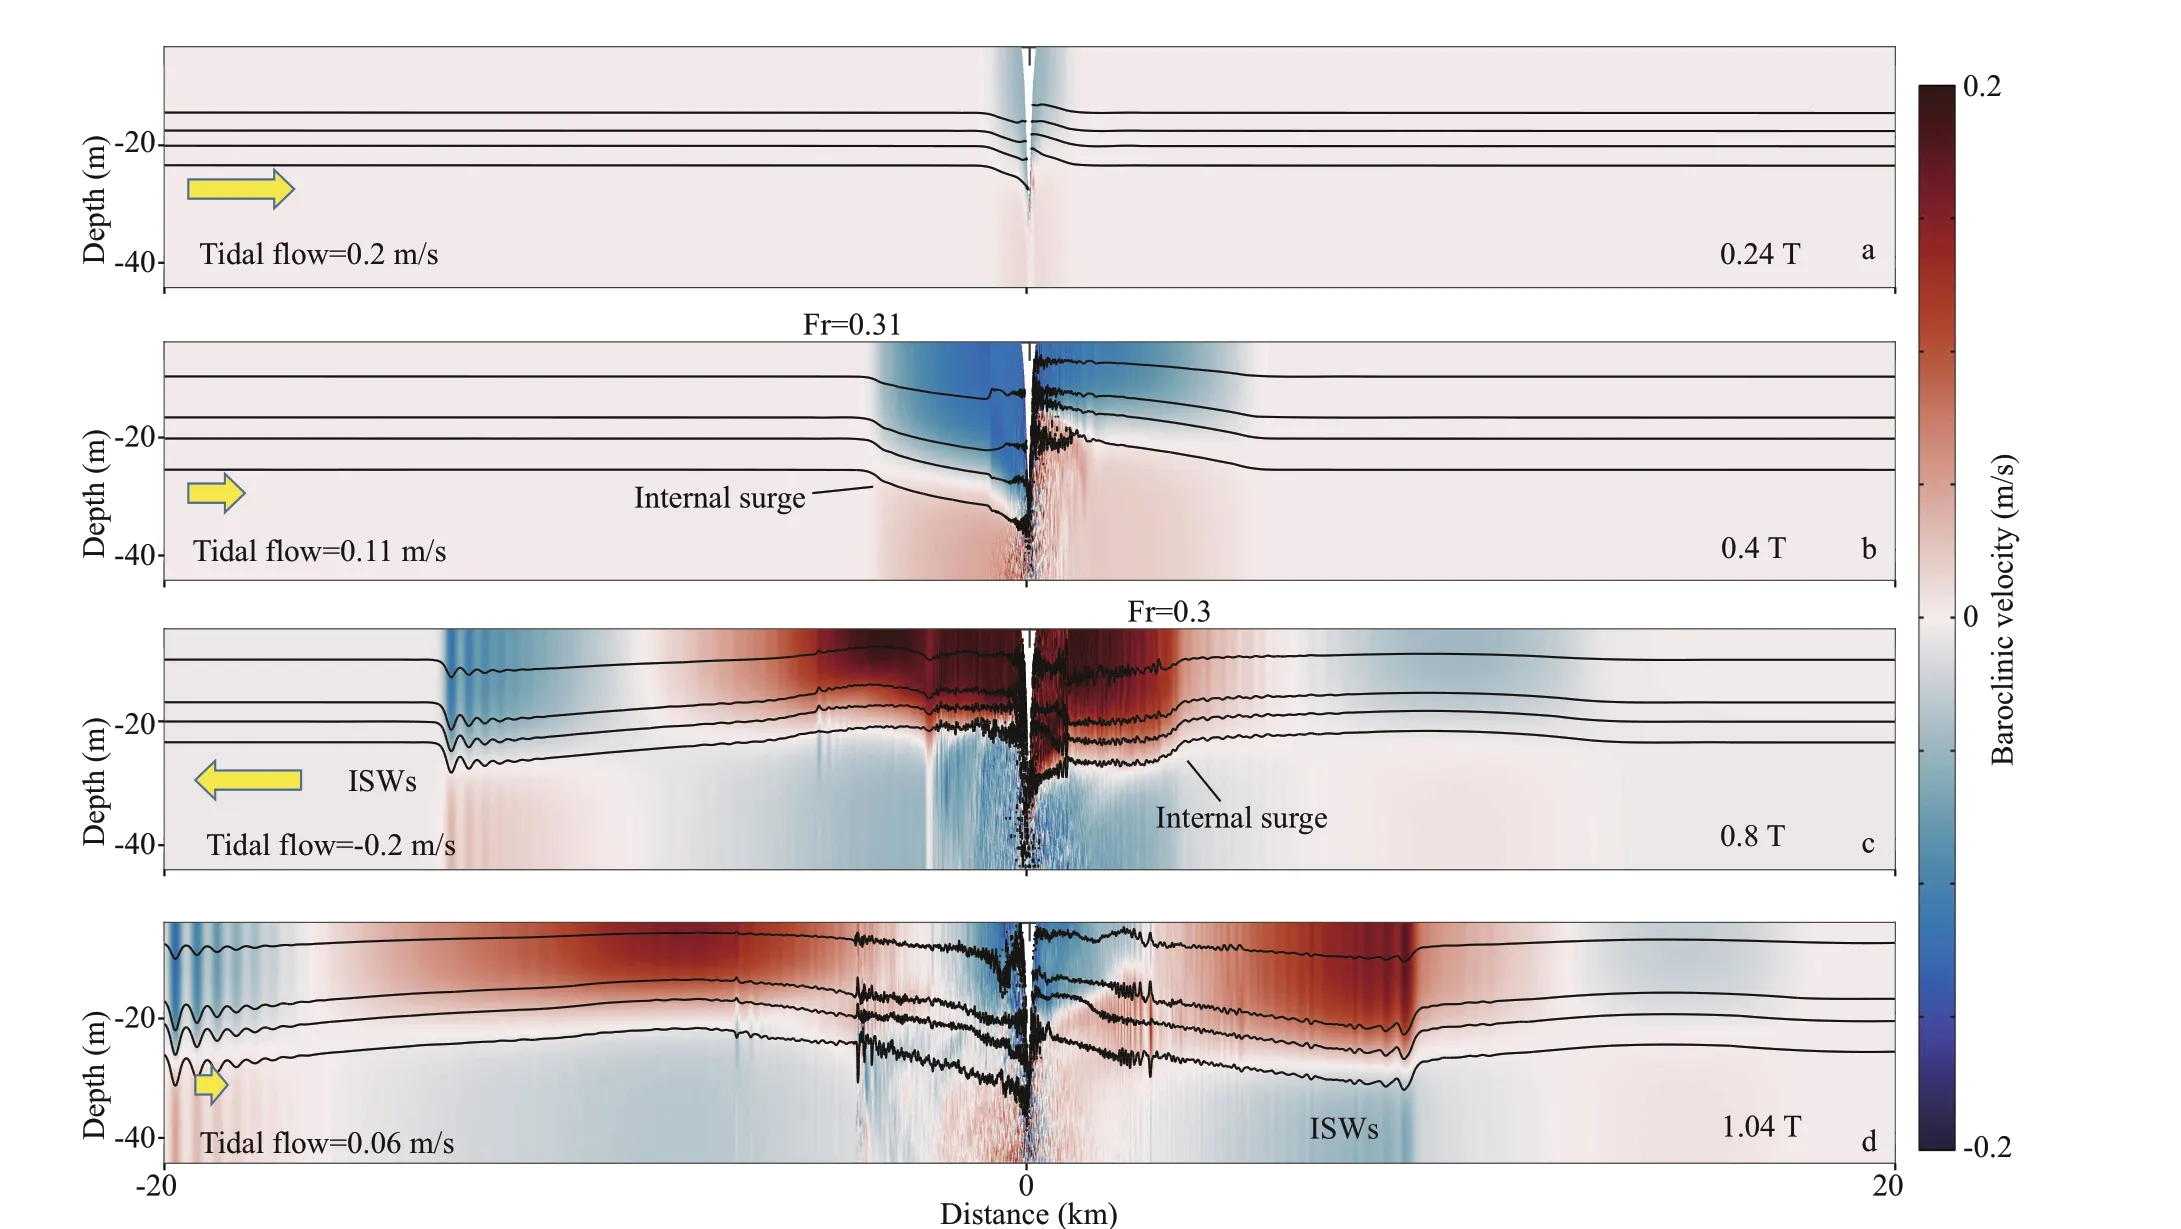
Fig.3 Snapshots of horizontal baroclinic velocity and density contours for the generation of ISWs at different T values

whereubc,ubt, anduare baroclinic horizontal velocity,barotropic horizontal velocity (m/s), and raw horizontal velocity (m/s), respectively.Handh(x) are the depth (m) of water column and the ice, respectively.
At 0.24 T, with the increasing tidal flow toward the right side, a depression and an elevation could be observed on the left and right keel sides, respectively(Fig.3a). The depression was termed as an internal surge, which has the potential to disintegrate into the ISWs in a background flow (Vlasenko et al., 2010).Then at 0.4 T, with the slackened barotropic tidal flow, the front of the internal surge on the left side started to steepen (Fig.3b).
The Froude number (Fr) was introduced to assess the development of non-linear processes and to distinguish the generation mechanism of ISWs. It was defined as:

whereumaxis a typical value of maximum flow velocity. The phase speedcwas calculated from the Strum-Liouville equation:

whereWnis the structure for thenthmode,Nis the buoyancy frequency. As introduced by Vlasenko et al.(2005), when the Fr is smaller than 1, the steepening and disintegration could occur on the front of the internal surge. When the Fr falls to 0.2, it is the best condition for the excitation of ISWs (Vlasenko et al.,2005). The Fr was 0.31 on the surge front as we calculated.
Consequently, with the disintegration of internal surges, an ISW packet with rank-ordered amplitudes could be observed at 0.8 T (Fig.3c). As the evolution proceeded, at 1.04 T (Fig.3d), the leading ISW packet stretched horizontally and the mode-2 ISWs emerged.On the right side, the Fr was 0.3 around the surge front at 0.8 T. When the tidal flow slackened, the surge front steepened and disintegrated into ISWs at 1.04 T. The generated ISW packets were visible on two sides of the ice keel and the mode-1 ISW packet was trailed by mode-2 ISW packet with slower propagation speed. The above results demonstrated the generation mechanism and multimodal structure of ISWs by barotropic tidal flows beneath the ice keel.
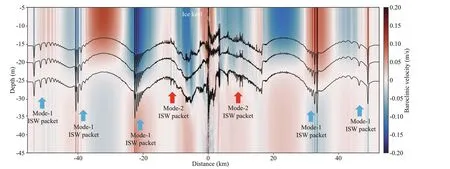
Fig.4 The density contours and baroclinic velocity field at 2.4 T

Two flow parameters were examined to distinguish the characteristics of generation. The vertical Froude number (Frh) and lateral Froude number (Frl) were introduced and calculated as follows (Dossmann et al., 2016):wherelis the horizontal scale of turbulent structure,theN0is the maximum buoyancy frequency at the pycnocline andUis flow speed. When Frh<1 it means the upper layer of fluid was blocked on the upstream side by the upper part of the ice keel during the interaction (Dossmann et al., 2016). When Frl<1, it means the generated waves would radiate from the source (Dossmann et al., 2016). In CTRL case, Frhand Frlare 0.02 and 0.005, respectively. Therefore,the flow could be blocked and induce an elevation and depression on both sides of the ice keel (Winters and Armi, 2014; Raju et al., 2021). It also indicates that the generated ISWs could radiate baroclinic energy on both sides ofice keel. We also noticed that the generation of ISWs on the left side was not synchronized with those on the right side. This means that periodic variation of barotropic tidal flows can modulate the timing of ISW generation around the ice keel.
3.2 The evolution of multimodal ISWs
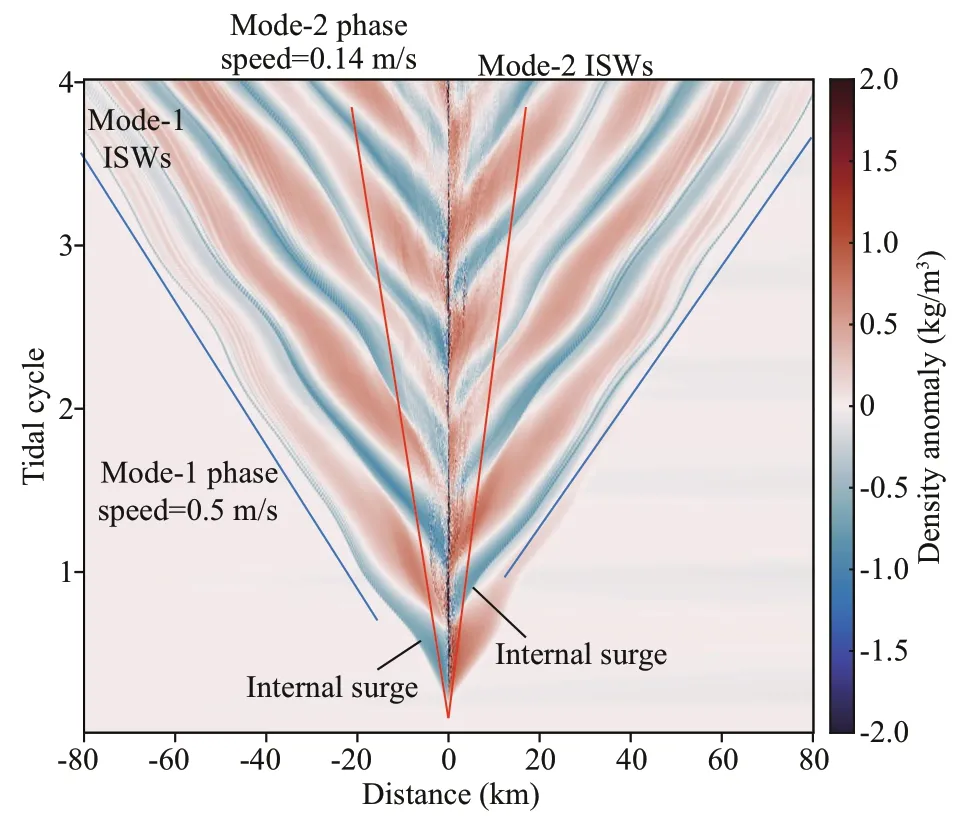
Fig.5 The Hovmüller diagram of density anomaly at 30-m depth during 4 T
The density contours and horizontal baroclinic velocity around the ice keel at 2.4 T are shown in Fig.4. Mode-1 ISW packets (blue arrows in Fig.4)and mode-2 ISW packets (red arrows in Fig.4) are visible on both sides of the ice keel. With the amplitude of ISW defined as the maximum deviation of the isopycnal relative to the non-disturbed isopycnal(Terletska et al., 2016), the maximum amplitude of mode-1 ISWs was about 8.5 m (O(10) m) on the left side of the ice keel. The mode-1 ISWs in the packets with rank-ordered amplitudes propagated away from the ice keel at a speed of 0.51 m/s. For the mode-2 ISWs, their maximum amplitude was 2 m and they also propagated with rank-ordered amplitudes at a speed of 0.15 m/s. The theoretical phase speed was 0.5 m/s and 0.14 m/s for mode-1 and mode-2 ISW,respectively (Fig.5). The propagation speed of mode-1 and mode-2 ISW were slightly larger than the theoretical phase speeds. The amplitudes and propagation speeds of mode-1 ISWs were also comparable to the typical observations in the Arctic Ocean (Kozlov et al., 2014; Stranne et al., 2017).Based on the observations by Yang et al. (2010), this type of mode-2 ISWs were categorized as convex type, which has the potential to transport mass and energy for a relative distance. We also know that it was sensitive to the background environment, such as shear currents, which can destabilize the waves and lead to local mixing (Zhang et al., 2018).
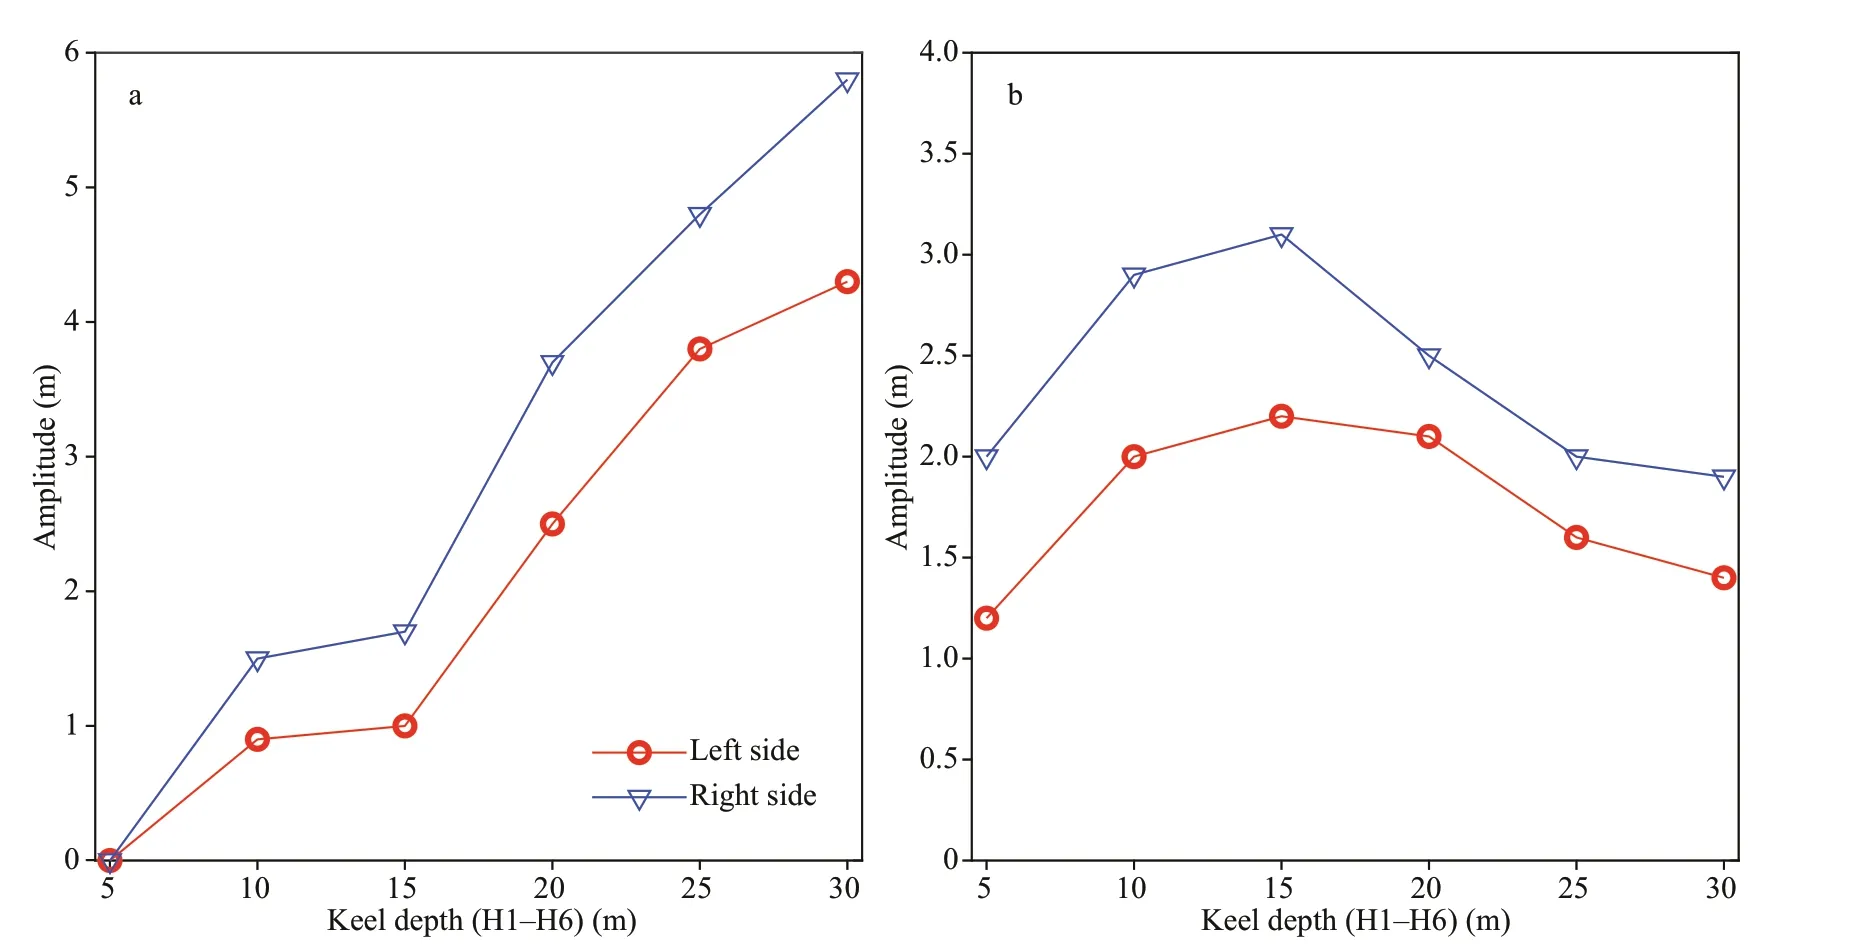
Fig.6 Amplitudes of ISWs in different modes under varying depth ice keels for cases H1-H6
On the right side, the maximum amplitude of mode-1 ISWs was 8.7 m, and the maximum amplitude of mode-2 ISWs was 2.8 m (Fig.4). The maximum propagation speed of mode-1 and mode-2 ISWs were 0.54 and 0.17 m/s, respectively, which are close to the theoretical phase speeds (0.5 m/s for mode-1 and 0.14 m/s for mode-2). In Fig.5, the Hovmüller diagram of density anomalies at 20-m depth (center of the pycnocline) during the experiment indicated the propagation of mode-1 and mode-2 ISWs. It should be noted that due to the presence of barotropic tidal flow, the propagation speeds of ISWs are modulated(Fig.5), so the trails of mode-1 ISWs and mode-2 ISWs are distorted. When the ISWs propagated with(against) the direction of barotropic tidal flow, their propagation speeds increased (decreased). Within the propagation trails of internal surges, we can also observe the dispersion of ISWs, which was indicated by the filaments behind the front of internal surges.The trails of mode-2 ISWs fall far behind the mode-1 ISWs due to the difference in propagation speeds. In summary, the simulation results show that the ISWs generated by barotropic tidal flows beneath the ice keel were multimodal. The ISWs were categorized as mode-1 and mode-2 waves and they can stably propagate a distance away from the ice keel.
3.3 Sensitivity experiment
3.3.1 The impact ofice keel depth
Based on the sensitivity experiments H1-H6, we explored the impact ofice keel depth on the generation of ISWs. The depth ofice keel was increased from 5 m to 30 m. In case H1, when the depth of the ice keel was only 5 m, no internal surge was observed (Figure not shown). Only mode-2 ISWs were generated during this interaction. The amplitudes of leading mode-2 ISWs were 1.2 m and 2 m in the left and right sides,respectively. When the depth ofice keel varied from 10 m to 30 m, multimodal ISWs were generated and radiated on both sides of the ice keel.
The amplitudes of leading mode-1 and mode-2 ISWs in cases H1-H6 are characterized in Fig.6. With the increasing ice keel depth, the amplitudes of leading mode-1 ISWs on both sides ofice keel monotonically increased. For mode-2 ISWs, the amplitudes show a trend of increasing first and then decreasing. The amplitudes of mode-2 ISWs decreased for ice keel depths larger than 15 m. With increasing of the ice keel depth, the interaction between the barotropic tide and ice keel strengthened.Enhanced turbulent dissipation near the ice keel was found with increasing ice keel depth. This indicated the breaking effect of high-mode ISWs near the ice keel. Due to the dissipation of the energy during the breaking, the amplitudes of mode-2 ISWs decreased.From cases H3 to H4, we can find the amplitude of mode-2 ISWs decreased, but at the same time, the amplitudes of mode-1 ISWs sharply increased.Therefore, we concluded that the amplitudes of generated mode-1 ISWs were proportional to the depths ofice keels, while amplitudes of generated mode-2 ISWs increased first and then decreased with the keel depth.
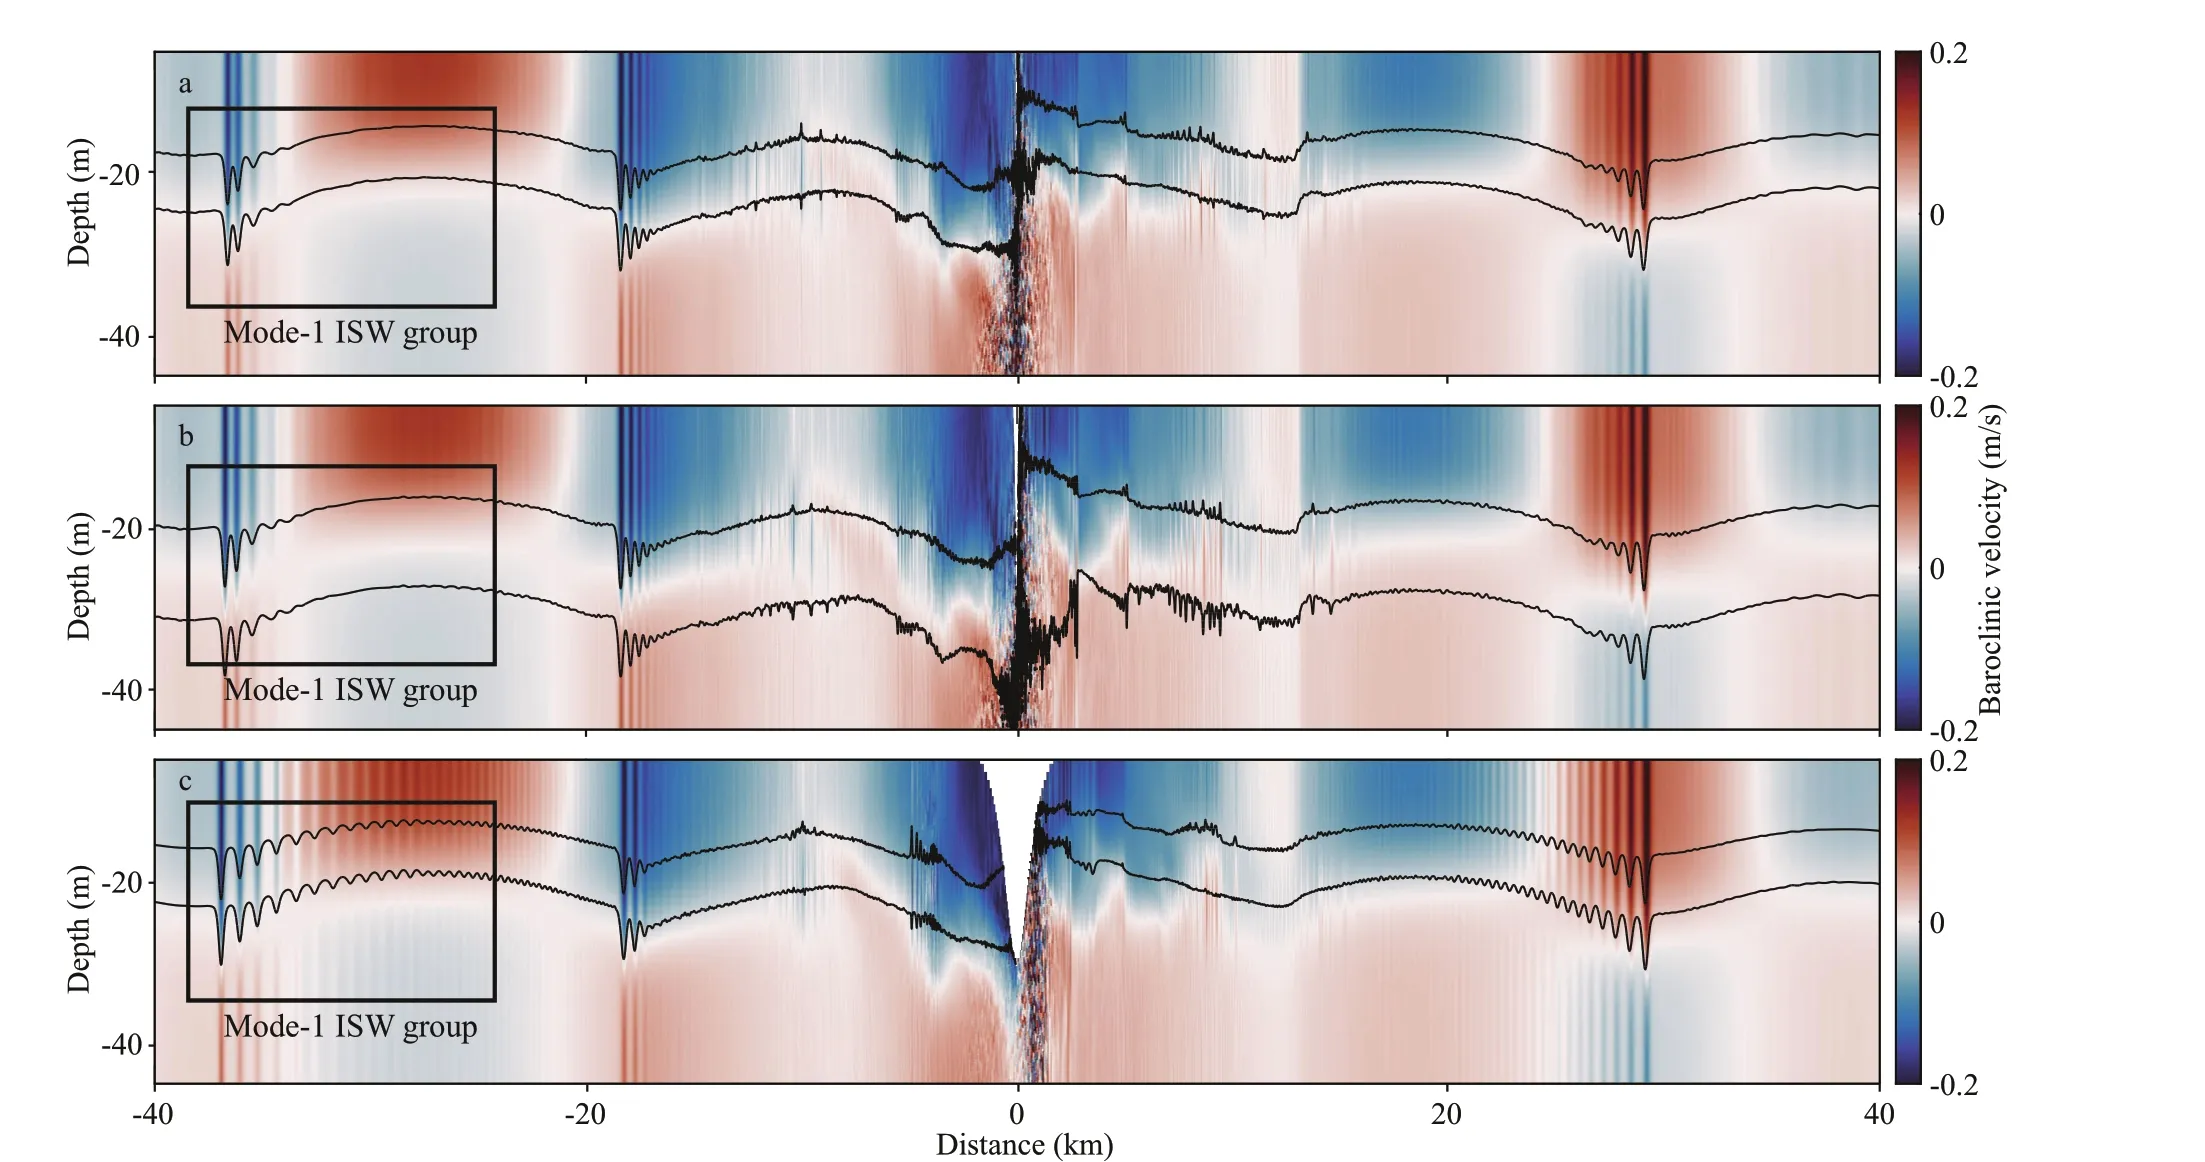
Fig.7 The density contours and baroclinic velocity fields at 2.4 M 2 tidal cycles for sensitivity experiments
3.3.2 The impact ofice keel width
The sensitivity experiments W1-W3 show the impact of varied ice keel width on the generation process. In W1 and W2, the ice keel width was respectively set as 50 m and 150 m. We found the wave pattern, amplitudes of mode-1 ISWs, and horizontal extension (about 4.7 km) for mode-1 ISW packets were nearly the same (Fig.7a-b). In W2 and W3, the ice keel widths were 150 m and 1 500 m,respectively. The horizontal extension for mode-1 ISW packets in case W3 was 10.6 km, and was significantly larger than that in case W2 (Fig.7c). The amplitudes of generated ISWs in W1-W3 were nearly the same (~8.4 m) (marked by rectangle in Fig.7a-c).This means the wider ice keels facilitated the disintegration of generated mode-1 ISWs. For the generated mode-2 ISWs, in cases W1 and W2, the amplitudes of leading mode-2 ISWs on the right side were the same, about 2 m. In case W3, the amplitude of leading mode-2 ISW on the right side was 1.6 m,slightly smaller than that in case W2. We conclude that the amplitudes of generated mode-1 and mode-2 ISWs were insensitive to the varying ice keel widths,while the disintegration of mode-1 ISWs could be facilitated by a wider ice keel.
3.3.3 The impact of barotropic tidal strength
The barotropic tidal currents provide the energy source for the generated ISWs. In cases B1-B4, the amplitudes of barotropic tidal flows varied from 0.05 to 0.20 m/s. In case B1, the internal surge was very weak and no sign of ISW packets was observed(Fig.8a). In case B2, the internal surges were steepening but only the leading ISW packets were observed (Fig.8b). However, in cases B3 and B4, with stronger barotropic tidal flows, the ISW packets fully evolved and radiated away from the ice keel (Fig.8c& d). This means for the generation of ISWs via the interaction, a sufficiently strong barotropic tidal flow is required. The amplitudes of leading mode-1 ISWs were 5.1 m and 8.5 m in cases B3 and B4, respectively.For the leading mode-2 ISWs, their amplitudes increased from 1.8 to 2 m. The results showed the amplitudes of generated ISWs were sensitive to the strength of barotropic tidal flow, and larger amplitude ISWs are expected in stronger barotropic tidal flows.
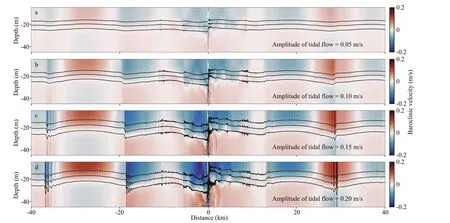
Fig.8 The density contours and baroclinic velocity fields at 2.4 M 2 tidal cycle for sensitivity experiments
4 DISCUSSION
4.1 The baroclinic energy conversion
During the interaction, the energy carried by the ISWs radiated on both sides ofice keel. Two sections located at margins of the widest ice keel (5 km from the vertex of the ice keel) were selected to quantitatively assess the baroclinic energy transport.The time-averaged total energy included the available potential energy (APE) and kinetic energy (KE). The period for calculating the time-averaged total energy was M2tidal cycle. The total time-averaged energy(E) was calculated as (Lamb, 2010; Zhang et al.,2018):
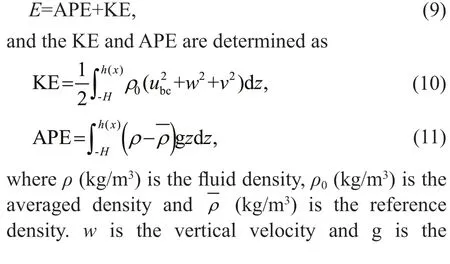
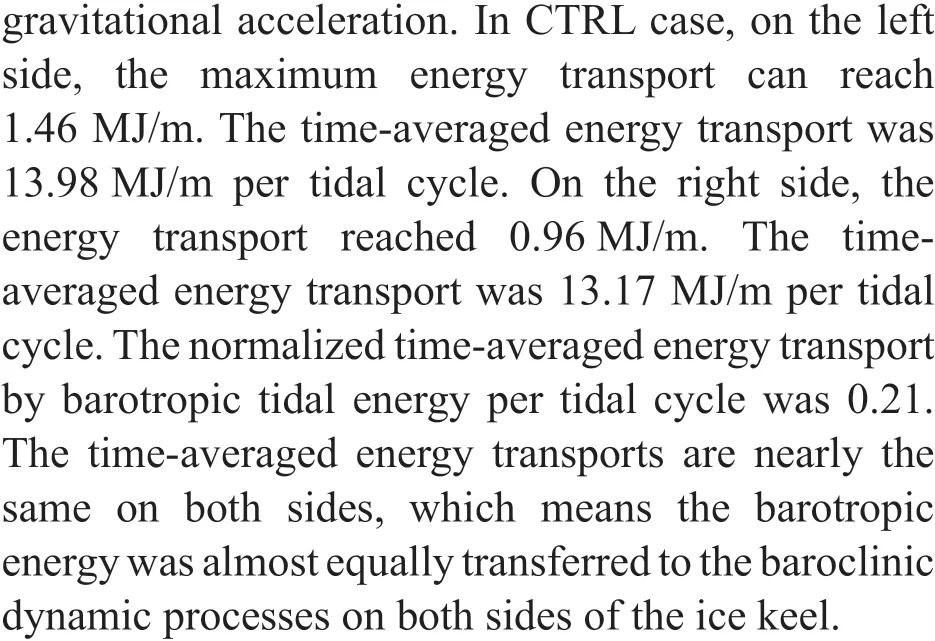
The results for the sensitivity experiments were provided in Fig.9. The time-averaged energy transport on both sides of the ice keel monotonically increased with ice keel depth. From H1-H6, the time-averaged energy transport on the left side increased from 0.64 MJ/m to 13.98 MJ/m per tidal cycle (the normalized value were increased from 0.01 to 0.23).The energy transport sharply increased when the ice keel reached deeper. From cases W1-W3, the energy transport also increased slightly with the ice keel width. Comparing cases W1 and W3, the energy transport increased from 13.56 to 14.42 MJ/m per tidal cycle (the normalized value increased from 0.22 to 0.23), only 6%, while the width ofice keel extended from 50 to 1 500 m. For cases B1-B4, on the left side,the energy transport increased from 1.11 to 13.98 MJ/m per tidal cycle (the normalized value increased from 0.02 to 0.23), when the amplitude of barotropic tidal currents increased from 0.05 to 0.2 m/s. In summary, the energy transport increased sharply with increasing ice keel depth and barotropic tidal current amplitude. However, the varying ice keel width had little impact on the energy transport variability.
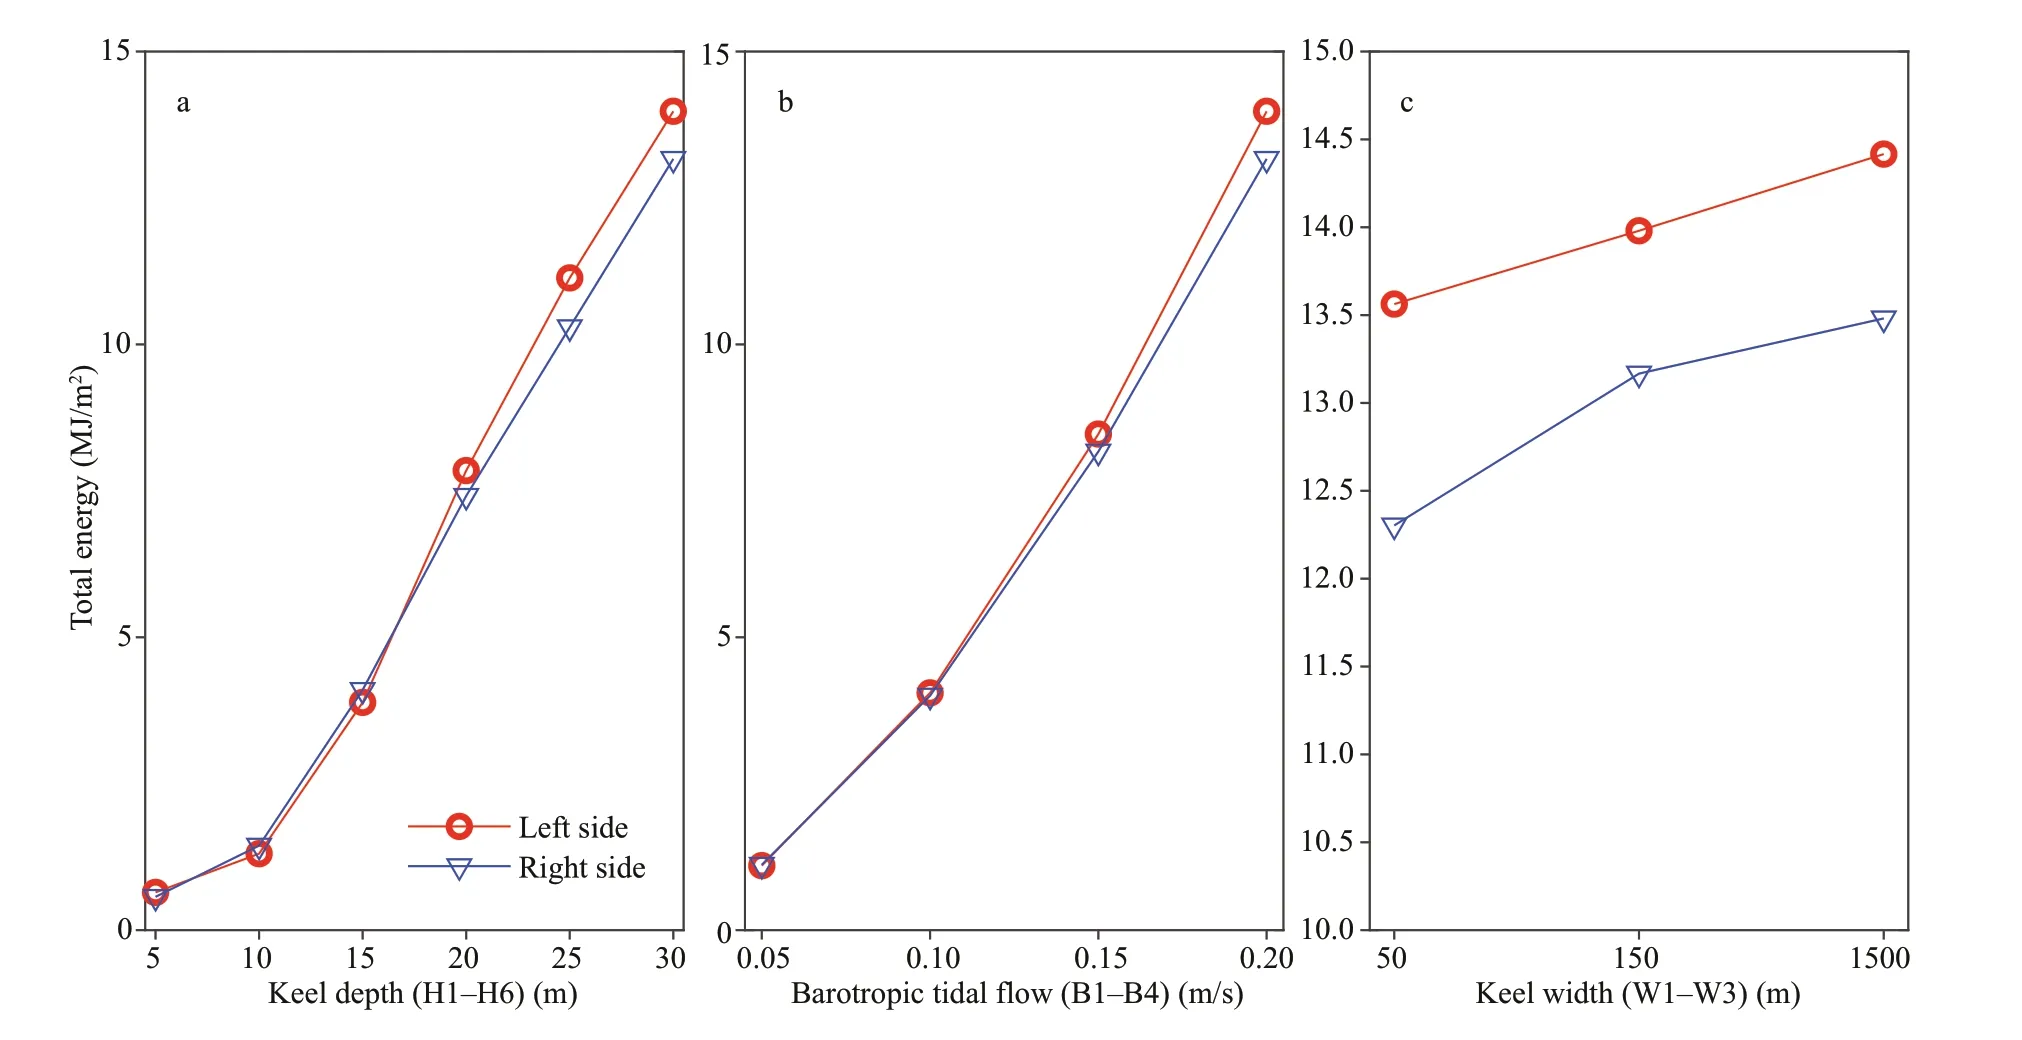
Fig.9 The total energy transport at the both sides ofice keel (5 km from the vertex ofice keels) for sensitivity experiments
4.2 The enhancement of turbulent mixing
The turbulent dissipation rate was calculated following (Nagai and Hibiya, 2015; Zhao et al.,2021):
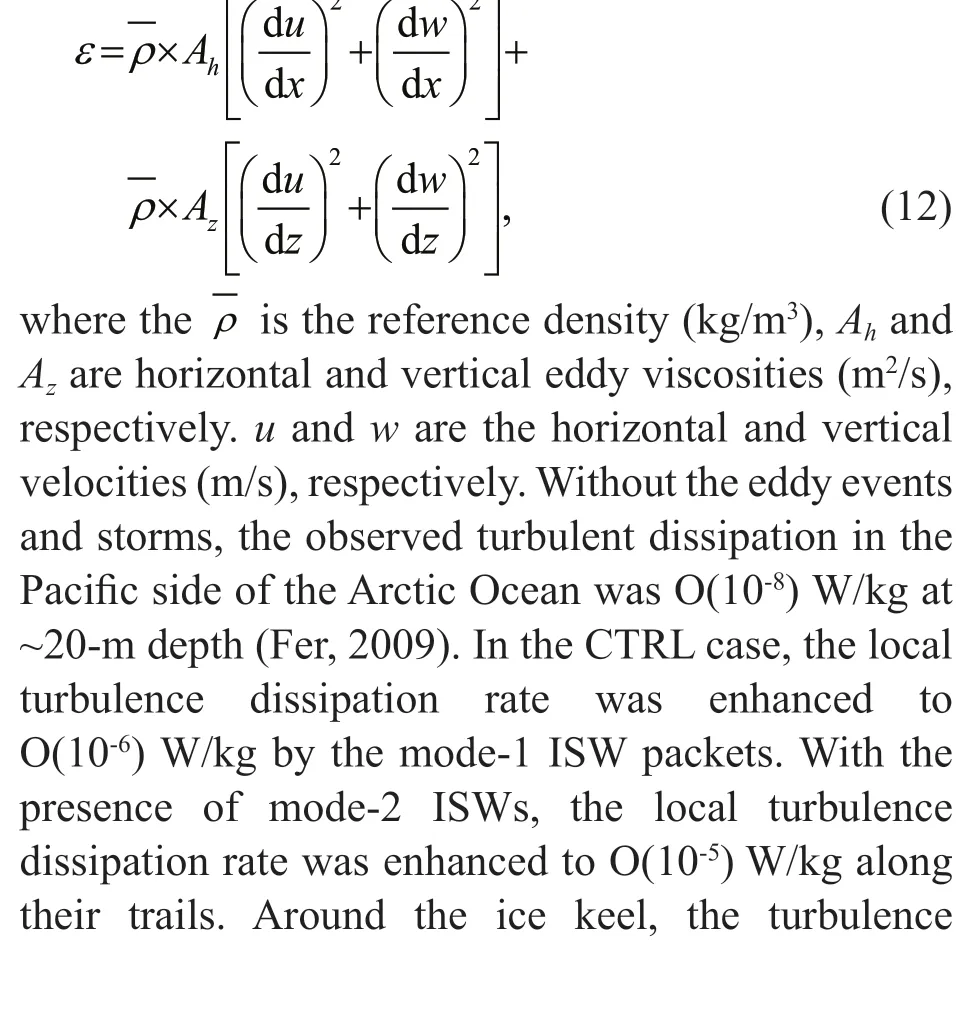
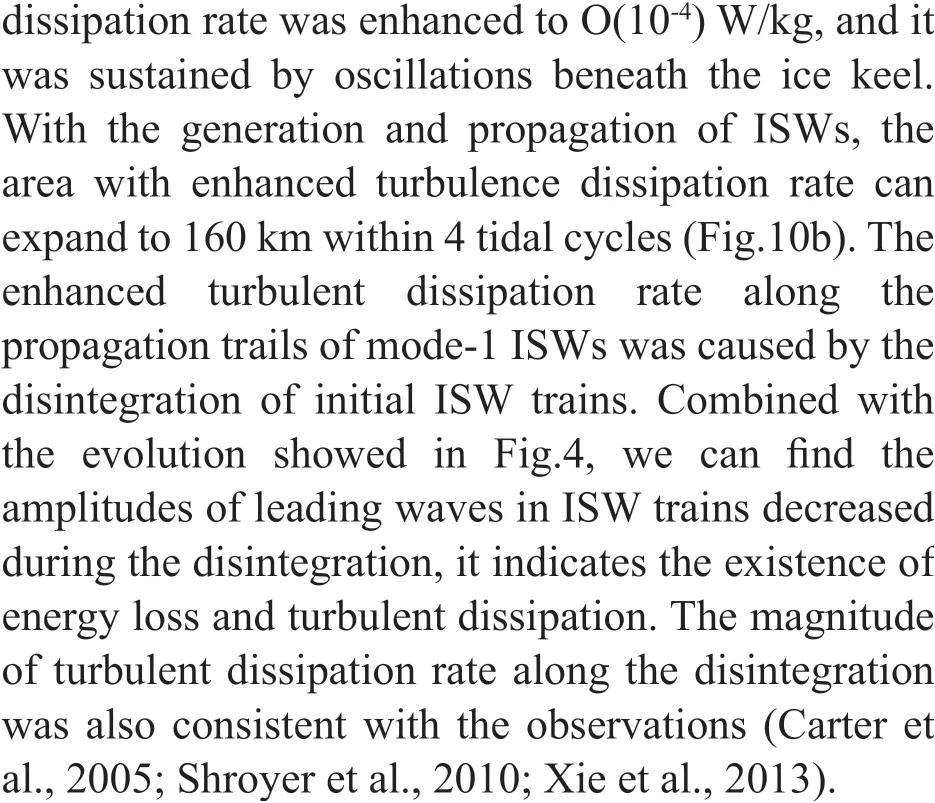
The turbulent dissipation rate at 20-m depth in sensitivity experiments are illustrated in Fig.10.Comparing case H2 with the CTRL case, it can be seen that with increasing ice keel depth, the turbulent dissipation rate was significantly enhanced. However,for the changed widths ofice keel, the variation of turbulent dissipation rate was negligible (Fig.10b &c). When the amplitude of barotropic tidal flows strengthened, the turbulent dissipation rate was also enhanced. Therefore, turbulent dissipation could be significantly enhanced by the increasing depths ofice keels and amplitudes of barotropic tidal flows, while the increasing widths ofice keels have little contribution to enhanced turbulent mixing beneath the ice cover.
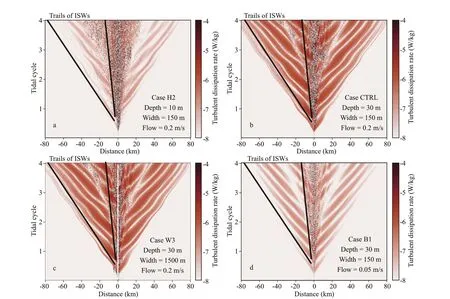
Fig.10 The Hovmüller diagram of turbulence dissipation rate (log ( ε)) for sensitivity experiments at the center of pycnocline(20-m depth)
4.3 Heat entrainment induced by the generated ISWs
The elevating turbulent dissipation can enhance vertical heat flux, which is important to the changes in heat content (Rippeth et al., 2015). The vertical heat flux was calculated following (Lenn et al., 2011),

whereρ0is the reference density,Cp=3 986 J/(kg·K) is the specific heat capacity of seawater,Tzis the temperature gradient (℃/m) andKzis the vertical eddy diffusivity (m2/s). With the velocity field acquired from the high-resolution simulation, more accurate vertical eddy diffusivity could be further estimated following Osborn’s relationship (Klymak and Legg, 2010; Nagai and Hibiya, 2015; Xu et al.,2021; Zhao et al., 2021),

whereεis the turbulence dissipation rate andN2is the buoyancy frequency squared. We focused on the heat flux at the pycnocline center (20-m depth) beneath the ice keel. The averaged heat flux at the center of pycnocline can reach 3.77 W/m, and the averaged heat flux per tidal cycle was 2.12 W/m. This result was comparable to the observations given by Shaw et al. (2009). They observed the heat flux in pycnocline could reach 2.1-3.7 W/m when the presence of warm and salty Pacific origin water increased upper pycnocline heat content. It showed during the interaction, the heat was transport vertically towards the basal surface of the ice cover.
Mixing enhanced by the ISWs can intensify the vertical heat entrainment (Carr et al., 2015). The changes in heat content contributed by interactions at specific depth beneath the ice keel was estimated as follow (Ramudu et al., 2018):

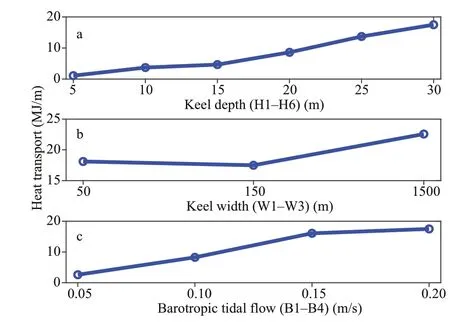
Fig.11 The heat transport per tidal cycle at 20-m depth layer around the ice keel (the area was 2-km long and centered on the ice keel) for sensitivity experiments
whereρ(x,t) andT(x,t) are the respectively density and temperature at momentt,x1, andx2are the horizontal extents of the integration area. In CTRL case, we focused on the 20-m depth layer and its horizontal extent was confined to 2 km centered on the ice keel. With the generation of ISWs, wave motion can reach the NSTM layer. The relatively warmer water could be transported upward, so the heat entrainment was also enhanced. The time-averaged heat content per tidal cycle was about 17.49 MJ/m(O(10) MJ/m), which is comparable to the estimation by Smith et al. (2018). As they suggested, an ocean heat loss about 10 MJ/m was induced by wind-driven mixing, which can cause observable ice melting. After enough time, the accumulated heat has the ability to slow the formation of new ice and accelerate the melting of existing sea ice. From sensitivity results,we found the increasing ice keel depths and barotropic tidal flow amplitudes could further enhance heat transport beneath the ice cover. For the ice keel width,a distinct impact only occurred when the width was massively extended (Fig.11).
4.4 The difference between the ISWs’ generations induced by topography vs. ice keel
The interaction of barotropic tidal currents with an ice keel is similar to the barotropic tides - topography interaction, compared with the process shown by Grimshaw and Helfrich (2018), but there are also differences. In their work, they showed the theoretical interaction of barotropic tides and topographies based onKdVframework. However, in the field, different types of topographies could modulate the generation and resultant turbulent dissipation of ISWs.
Ice keels are commonly observed underwater structures in the Arctic Ocean. The typical vertical and horizontal scales ofice keels are tens of meters and hundreds of meters, respectively (Strub-Klein and Sudom, 2012). They were significantly smaller than the topography. However, the aspect ratio ofice keel makes it very steeper than the bottom topography.It means the turbulent dissipation caused by the barotropic tide-ice keel interaction could be significant, and it is very important to the vertical transport of nutrients and heat in upper layer of the Arctic Ocean. The nondimensional parameters tidal excursionεand relative steepnessγwere usually applied in the barotropic tides - topography interaction to assess the generation of non-linear internal waves(Legg and Huijts, 2006; Chen et al., 2013). These parameters were calculated as follow:
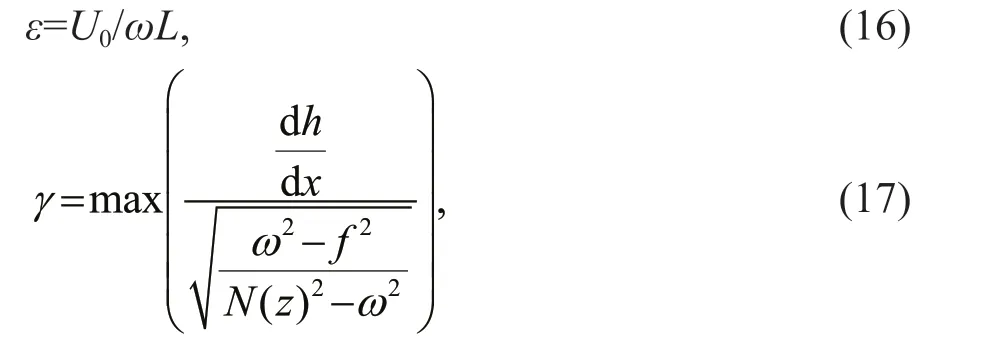
where theU0andLare amplitude of barotropic tidal flow (m/s) and the scale of underwater structure (m),respectively.ωandfare the barotropic tidal frequency(/s) and Coriolis frequency (/s), respectively. When the tidal excursion is small relative to the scale of topography, it indicates internal tides dominate(Garrett and Kunze, 2007). Higher relative steepness indicates a supercritical topography, which is more suitable for the energy transfer from barotropic to baroclinic (Chen et al., 2013).In our CTRL case, the tidal excursion and relative steepness were 9.5 and 242, respectively. Compared with the scale of the ice keel (150 m), the tidal excursion was relative small and we can find the generation and disintegration of internal surge.However, the ice keel steepness was larger than that of the underwater ridge of a similar scale as the keel.Such a high relative steepness implies that the energy conversion in barotropic tides-ice keel interaction may be more efficient than barotropic tidestopography interaction. It shows the tide-ice keel interaction can be an important source for the ISWs and mixing in the Arctic Ocean.
5 CONCLUSION
Using 2-D non-hydrostatic, non-linear numerical simulations, we examined the generation and propagation of ISWs by the barotropic tidal currents flowing beneath ice keels. With the presence of barotropic tidal flows, internal surges are first triggered around the ice keel, then steepened non-linearly and disintegrated into multimodal ISWs with rank-ordered amplitudes. From the sensitivity experiments, we demonstrated that the varying ice keel depths and barotropic tidal flow amplitudes significantly affected the generation of ISWs, while the changing ice keel width had little effect. Quantitative estimation showed that the generation of ISWs beneath the ice keel might play an important role in driving mixing and sustaining the thermal balance on the basal surface ofice cover in the Arctic Ocean.In future work, a 3-D structure ofice keel should be considered, so a continuous interaction of barotropic tidal flows with ice keels in different directions can be revealed. The other possible avenue is the consideration of the impact ofice melting on the stratification. With the ice melting, the depth and thickness of stratification also changes, which can affect the interaction process. On the other hand, the rotational effect on the generation of ISW beneath the ice floe requires further investigation. More in-situ observations are required to reveal the generation of ISWs beneath ice cover in other regions, where an ice floe is present. ISWs could be triggered under sea ice when the condition is favorable.
6 DATA AVAILABILITY STATEMENT
The datasets generated and analyzed during the current study are available in the Marine Science Data Center (http://msdc.qdio.ac.cn/index.php?s=Info/apply) of IOCAS. The MITgcm can be downloaded from http://mitgcm.org. The stratification data can be acquired from National Snow and Ice Data Center(NSDIC, https://nsidc.org/).
 Journal of Oceanology and Limnology2022年3期
- Journal of Oceanology and Limnology的其它文章
- Typhoon-induced wind waves in the northern East China Sea during two typhoon events: the impact of wind field and wave-current interaction*
- Effect of subsea dispersant application on deepwater oil spill in the South China Sea*
- Geochemical characteristics of cold-seep carbonates in Shenhu area, South China Sea*
- Examination of seasonal variation of the equatorial undercurrent termination in the Eastern Pacific diagnosed by ECCO2*
- Deviation of the Lagrangian particle tracing method in the evaluation of the Southern Hemisphere annual subduction rate*
- Immunostimulatory effect of quaternary degree and acetyl group of quaternized chitosan on macrophages RAW 264.7*
