复杂DNAPL污染源区溶解相污染通量的升尺度计算
宋美钰,施小清,马春龙,康学远,杜方舟
复杂DNAPL污染源区溶解相污染通量的升尺度计算
宋美钰,施小清*,马春龙,康学远,杜方舟
(南京大学地球科学与工程学院,表生地球化学教育部重点试验室,江苏 南京 210023)
重非水相液体(DNAPL)污染场地中NAPL相污染物会持续溶解于地下水中,释放出溶解相污染羽,对人体健康产生威胁.准确评估DNAPL污染场地源区下游的溶解相污染通量至关重要.由于介质的非均质性常形成复杂DNAPL污染源区,其溶解相污染通量往往呈现出阶段性变化.目前溶解相污染通量计算普遍采用Christ等提出的双域升尺度模型,但该模型仅适用于弱非均质性的污染源区.本文基于大量强非均质性条件下的污染源区数值算例,修正了Christ双域模型中污染源区衰减指数的经验公式,将该模型的适用范围推广至强非均质性的复杂污染源区.通过蒙特卡罗数值算例及两个二维砂箱试验数据验证了修正模型的适用性和精度.对比结果表明:修正模型可广泛适用于不同结构的复杂DNAPL污染源区,与以往的计算方法相比,修正模型计算的溶解相污染通量精度提高了约35%.
重非水相液体;溶解相污染通量;离散状和池状结构的质量比;污染源区衰减;升尺度模型
随着有机化工业的不断发展,重非水相液体(DNAPL)污染问题日趋严重[1-2].由于具有密度大、粘滞度低、溶解度低等特点,从地表泄漏的DNAPL在重力和毛细管力的共同作用下,穿过包气带向含水层底部迁移,最终以连续的池状结构在低渗透地层上聚集[3].在此过程中,部分DNAPL残留在多孔介质的孔隙中,呈现不连续的离散状结构[4].池状和离散状结构的DNAPL均以自由非水相的形式存在,其所在区域被定义为DNAPL污染源区[5].为了表征DNAPL污染源区常常采用离散状和池状DNAPL的质量比(GTP)来刻画污染源区的结构,因此可将DNAPL污染源区划分为离散状污染源区(GTP>1)和池状污染源区(GTP<1)[6-8].随着地下水的流动,不同结构的污染源区缓慢地溶解于水中,沿地下水流方向形成溶解羽,长期威胁人类的健康.
近年来,DNAPL污染源区的复杂溶解行为吸引了越来越多的学者关注[9-10].目前地下水环境管理一般采用污染物浓度限值标准[11],但由于DNAPL在地下不同区域的分布并不均匀,仅用浓度标准无法准确评估污染源区的风险并制定合理的修复方案[12].因此,有学者提出了污染通量概念,即地下水下游某监测断面单位时间单位面积的污染物质量.近些年来,管理机构逐渐达成共识,认为污染通量比浓度能提供更准确的场地污染情况,从而帮助管理者合理评估污染源区的自然衰减程度并制定修复方案[13-14].溶解相污染通量的常用计算方法包括:断面监测法、井捕获法、被动式通量计法、等值线估测法以及溶质运移模型法[12],其中前三类方法因为需要采用侵入性手段进行辅助,因此具有实施难度大、周期长、成本高等问题,而等值线估测法的适用范围有限.因此溶质运移模型以非侵入性、适用范围广、可预测等特点得到了越来越多的关注.采用该方法计算溶解相污染通量时,需要精细刻画污染源区的结构作为驱动数据,进而基于多相流模型求解[15-16].但实际场地的污染源区精细刻画难度很大,需要布设很多监测点,因此耗费大量的人力、物力、财力,并且多相流模型计算成本较高,所以导致该方法的工作量较大.
除此之外,精细刻画含水层非均质性以及复杂污染源区的方法仅在小尺度范围内有效,对于大多数中等尺度(上百米)场地的羽状污染都不可行,由于参数测量尺度和研究区域尺度之间的巨大差异以及含水层的空间非均质性,有必要对参数进行升尺度转换,将精细测量尺度内收集的数据信息转换为较粗计算尺度下的相关信息,以满足大尺度建模要求[17].因此在估算溶解相污染通量时,为了解决上述问题并减少工作量,升尺度计算方法得到不断发展,学者们重点关注溶解相污染通量随污染源区衰减过程的变化,尝试用少量的等效参数来刻画污染源区和含水层的非均质性,以期在较粗的尺度上准确计算污染通量,由此建立以下两类模型.


在上述两类模型中,溶解相污染通量随污染源区衰减过程的变化均是通过一个常数参数表征.然而对于实际的场地,污染源区结构往往较为复杂,随着溶解的不断进行,溶解相污染通量呈现明显的阶段性变化,往往难以用一个常数来刻画[24].

1 研究方法
1.1 控制方程
假定在饱和含水层中存在一个复杂的DNAPL污染源区(图1),该源区由多个离散状污染源区和池状污染源区共同构成.污染源区内污染物的饱和度均大于零.连续的池状DNAPL和不连续的离散状DNAPL在地下水中缓慢地溶解,在水流方向形成溶解羽.假设忽略生物降解、挥发及吸附带来的影响,基于溶质运移模型,DNAPL的溶解过程可以通过式(1)表示.求解式(1)可量化在地下水中溶解相DNAPL的浓度,将其与地下水流速相乘,计算DNAPL污染源区的溶解相污染通量.


图1 DNAPL污染源区示意
1.2 升尺度模型
升尺度计算方法对于观测数据需求少、计算效率高,其基本思路是通过采用少量的等效参数来刻画污染源区和含水层的非均质性,在较粗的尺度上计算污染通量.升尺度模型的建立一般需基于下述假设[21]:

(2)忽略横向弥散和分子扩散的影响.
(4)污染物饱和度发生变化的时间极短,且地下水的流速基本保持不变,溶解动力学极为接近稳定状态,因此将溶解过程视为拟稳态的.
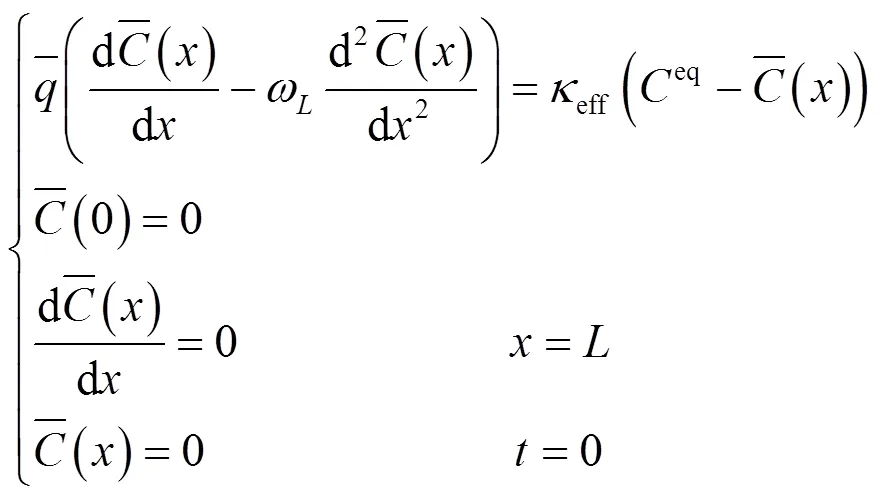
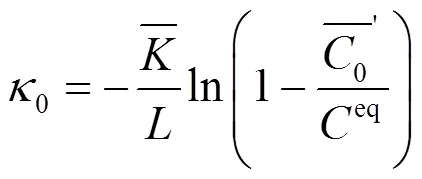
由此可将式(1)简化为以下的升尺度计算模型[19]:




1.3 升尺度模型参数的拟合
数值计算过程中对空间和时间变量分别进行离散.在空间上,将污染源区离散为个单元(为整数且³1),其衰减过程的计算从污染源区上游单元向下游单元过渡;在时间上,将污染源区的总时长离散为个相等步长(为整数且³1,>0),且假设在每个步长内,溶解过程均处于稳定状态,饱和度和等效渗透系数等污染源区相关参数保持不变.在此基础上,基于以下步骤模拟污染源区的衰减:


(4)重复步骤(2)、(3)直至污染源区耗竭.


表1 模型参数设置

图2 GTP =6.6时DNAPL的初始饱和度
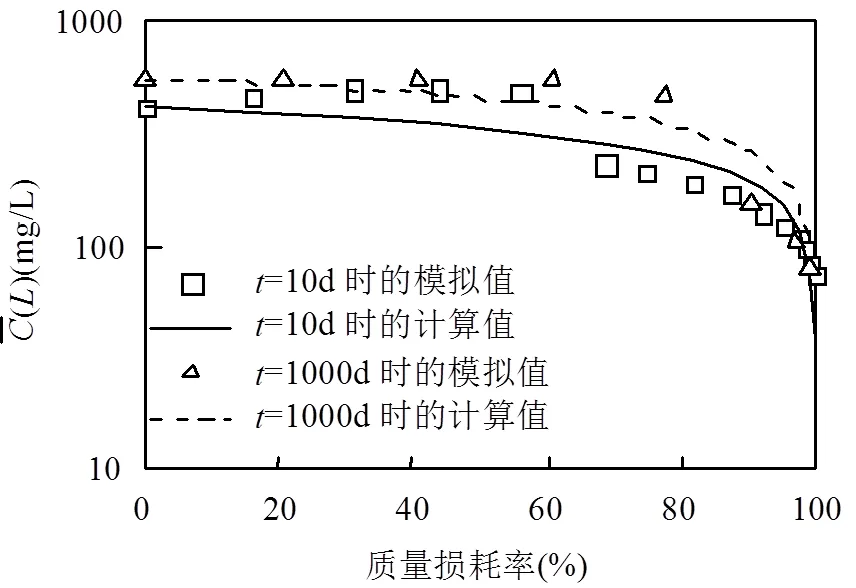
图3 GTP =6.6时污染源区通量加权浓度拟合情况
对比不同的时间步长离散


图4 β和GTP的拟合情况
Fig.4 Fitting results of β and GTP

图5 GF和1-M/M0的拟合情况


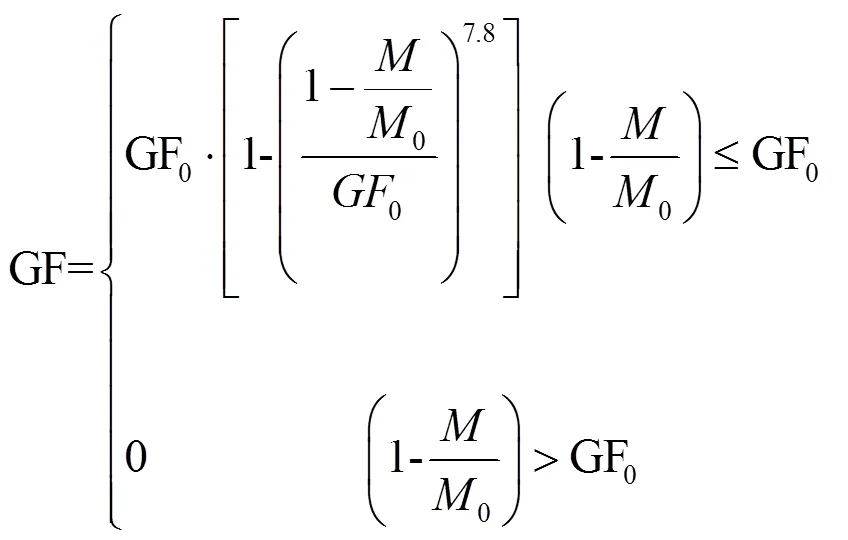
其中
2 验证
2.1 采用蒙特卡洛数值试验验证

由于单个实现需耗时1~3h,为避免过大的计算量,本文仅选取100个污染源区,分别采用式(15)中的解析解和数值计算方法对通量加权浓度进行计算,并统计二者间的RMSE.由图6可知,对于84%的污染源区,通量加权浓度的RMSE分布在160mg/L以内,RMSE的最大值为208.05mg/L.与此同时,分别采用Zhu-Sykes模型、Parker-Park模型以及Christ双域模型计算上述100个污染源区的通量加权浓度[18,21,29].经过与数值计算方法所得结果对比发现,前两类模型计算得到的RMSE的平均值分别为201.37和492.41mg/L.与这两类模型相比,本文拓展的解析解计算精度平均提高了约10%和35%.而与Christ双域模型相比,本文拓展的解析解在大约前40%~60%衰减过程中可以更准确地推估溶解相污染通量,其精度平均提高了约4%.
为了更直观地验证解析解对于污染源区衰减过程中多阶段溶解相污染通量的计算能力,本文展示了其中9个污染源区通量加权浓度的拟合情况.由图7可知,采用式(15)解析解计算的结果与数值计算的结果在不同结构的复杂污染源区的算例中均能较好地拟合,相比于Zhu-Sykes模型、Parker-Park模型以及Christ双域模型[18,21,29],可以更准确地刻画溶解相污染通量的阶段变化.由上述结果可见本文拓展的解析解可以广泛适用于强非均质性的复杂DNAPL污染源区的阶段变化的溶解过程.
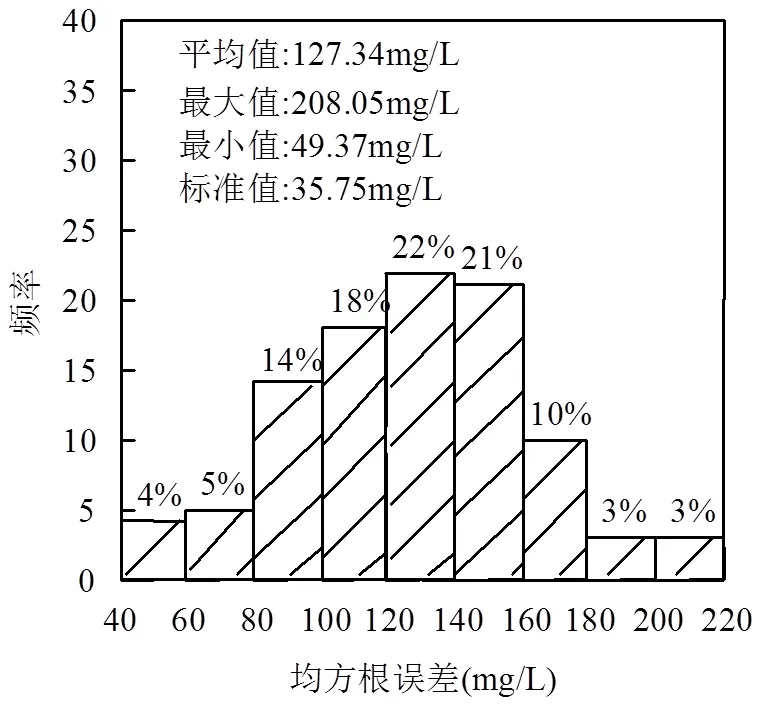
图6 通量加权浓度均方根误差的频率直方图

图7 污染源区衰减过程中通量加权浓度的拟合情况

2.2 采用砂箱试验验证

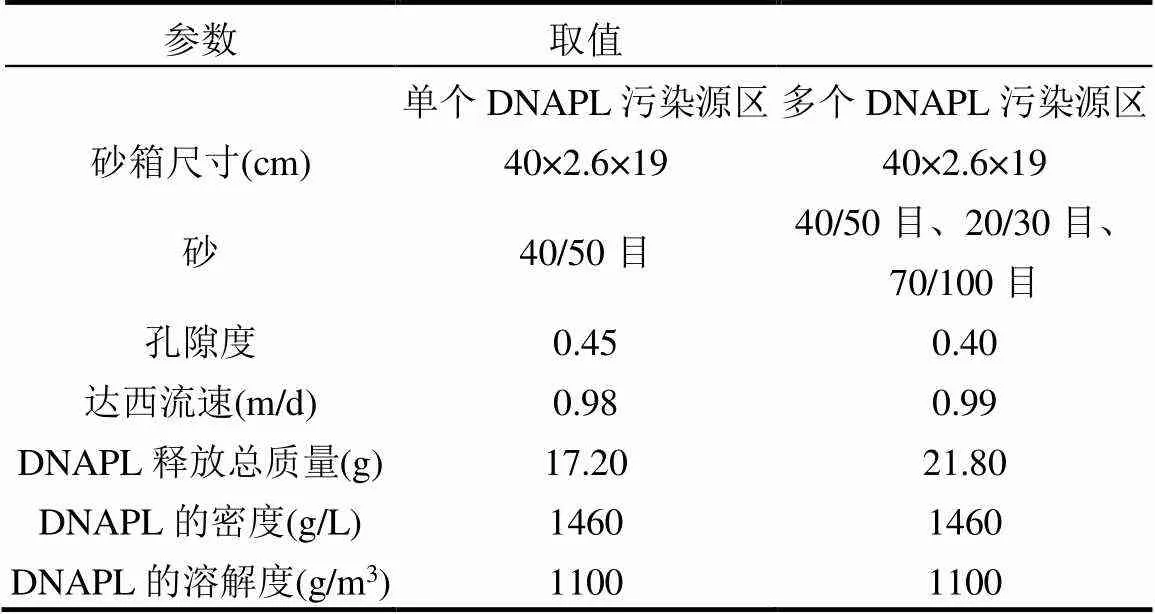
表2 试验参数设置[37]
2.2.1 均质介质中的单个DNAPL污染源区 为了达到均质介质的背景条件,DiFilippo等在砂箱中填入大小为40/50目且均匀分布的砂[37],并在底部布设2cm厚的70/100目的细砂,以形成低渗透性的边界,便于DNAPL以池状结构聚集.随后在砂箱顶部释放约12mL的TCE,形成一个中部为离散状形态,底部为池状形态分布的复杂污染源区(图8).污染源区稳定后,从砂箱左侧以恒定的速率注入去离子水,形成一个水力梯度约为0.01的流场,并在砂箱右侧端口进行取样分析,从而获得各个时刻污染源区的通量加权浓度.试验的具体设置见表2.

图8 单个污染源区试验的初始饱和度[37]


图9 单个污染源区试验和解析解的结果对比
由图9可知,对于单个DNAPL污染源区,采用本文拓展的解析解计算的结果能较好地拟合试验结果.试验值和解析解所得的计算值间的RMSE= 124.92mg/L.同样采用Zhu-Sykes模型、Parker-Park模型和Christ双域模型分别对通量加权浓度进行求解[18,21,29],经过与数值计算方法所得结果对比发现,前两类模型计算得到的RMSE的平均值分别为167.42和437.25mg/L.与这两类模型相比,本文拓展的解析解计算的精度约提高了10%和30%,并且可以更精确地刻画出污染源区衰减过程中溶解相污染通量的阶段变化.而与Christ双域模型相比,本文拓展的解析解在大约前60%衰减过程中可以更准确地推估溶解相污染通量,其精度提高了约3%.


图10 多个污染源区试验的初始饱和度[37]
采用本文基于双域模型拓展的解析解计算污染源区衰减过程中的通量加权浓度,并将试验结果与之对比.由图11可知,对于多个DNAPL污染源区,采用本文拓展后的解析解计算的结果与试验结果拟合较好.试验值和计算值间的RMSE=41.22mg/L,同样采用Zhu-Sykes模型、Parker-Park模型和Christ双域模型分别对通量加权浓度进行求解[18,21,29],经过与数值计算方法所得结果对比发现,前两类模型计算得到的RMSE的平均值分别为309.43和200.97mg/L.与这两类模型相比,本文基于双域模型拓展的解析解计算的精度约提高了20%和15%,可以更精确地刻画出污染源区衰减过程中溶解相污染通量的阶段性变化.而与Christ双域模型相比,本文拓展的解析解在大约前60%衰减过程中可以更准确地推估溶解相污染通量,其精度提高了约4%.

图11 多个污染源区试验和解析解的结果对比
3 结论
3.1 本文采用大量强非均质性的复杂污染源区算例,修正了双域模型中污染源区衰减指数的经验公式,将溶解相污染通量解析解的适用范围推广至强非均质性的复杂污染源区.
3.2 通过与蒙特卡洛数值计算结果对比验证可知,本文基于双域模型拓展的解析解可广泛应用于强非均质性的复杂DNAPL污染源区,较以往模型相比,修正模型的精度提高约10%~35%.
3.3 通过与两个砂箱试验结果对比验证可知,修正模型可以更精确地刻画复杂DNAPL污染源区衰减过程中溶解相污染通量的阶段性变化.本次研究的局限在于仅考虑溶解相的平衡溶解,后续可针对非平衡溶解过程,进一步提高污染源区衰减过程中溶解相污染通量的计算精度.
[1] 施小清,姜蓓蕾,吴吉春,等.非均质介质中重非水相污染物运移受泄漏速率影响数值分析[J]. 水科学进展, 2012,23(3):376-382.
SHI X Q, JIANG B L, WU J C, et al. Numerical analysis of the effect of leakage rate on dense non-aqueous phase liquid transport in heterogonous porous media [J]. Advances in Water Science, 2012,23 (3):376-382.
[2] 郑 菲,高燕维,孙媛媛,等.污染源区结构特征对Tween 80去除DNAPL效果的影响[J]. 中国环境科学, 2016,36(7):2035-2042.
ZHENG F, GAO Y W, SUN Y Y, et al. The influence of source-zone architecture on DNAPL removal by Tween 80 flushing [J]. China Environmental Science, 2016,36(7):2035-2042.
[3] Kueper B H, Redman D, Starr R C, et al. A field experiment to study the behavior of tetrachloroethylene below the water table: Spatial distribution of residual and pooled DNAPL [J]. Groundwater, 1993, 31(5):756-766.
[4] Mercer J W, Cohen R M. A review of immiscible fluids in the subsurface: Properties, models, characterization and remediation [J]. Journal of contaminant hydrology, 1990,6(2):107-163.
[5] 王慧婷,徐红霞,郭琼泽,等.饱和多孔介质中DNAPL污染源区结构及质量溶出[J]. 中国环境科学, 2019,39(8):3474-3483.
WANG H T, XU H X, GUO Q Z, et al. Dense non-aqueous phase liquid source zone architecture and dissolution in saturated porous media [J]. China Environmental Science, 2019,39(8):3474-3483.
[6] Christ J A, Ramsburg C A, Abriola L M, et al. Coupling aggressive mass removal with microbial reductive dechlorination for remediation of DNAPL source zones: a review and assessment [J]. Environmental Health Perspectives, 2005,113(4):465-477.
[7] 郭琼泽,张 烨,姜蓓蕾,等.表面活性剂增强修复地下水中PCE的砂箱实验及模拟[J]. 中国环境科学, 2018,38(9):3398-3405.
GUO Q Z, ZHANG Y, JIANG B L, et al. Experiment and numerical simulation of surfactant-enhanced aquifer remediation in PCE contaminated laboratory sandbox [J]. China Environmental Science, 2018,38(9):3398-3405.
[8] Lemke L D, Abriola L M, Goovaerts P. Dense nonaqueous phase liquid (DNAPL) source zone characterization: Influence of hydraulic property correlation on predictions of DNAPL infiltration and entrapment [J]. Water Resources Research, 2004,40(1):198-213.
[9] Gehlhaus III M W, Gift J S, Hogan K A, et al. Approaches to cancer assessment in EPA's Integrated Risk Information System [J]. Toxicology and applied pharmacology, 2011,254(2):170-180.
[10] Koch J, Nowak W. Predicting DNAPL mass discharge and contaminated site longevity probabilities: Conceptual model and high-resolution stochastic simulation [J]. Water Resources Research, 2015,51(2):806-831.
[11] 边淑贞.氯代烃污染地下水中重质非水相液体通量估算研究[D]. 保定:河北农业大学, 2015.
BIAN S Z. Research on contaminant mass flux of dense non- aqueous phase liquids in chlorinated hydrocarbon contaminated site [D]. Baoding: Hebei Agricultural University, 2015.
[12] Integrated DNAPL Site Strategy Team. Use and measurement of mass flux and mass discharge [J]. The Interstate Technology & Regulatory Council, 2014,2010:154.
[13] Einarson M D, Mackay D M. Peer Reviewed: Predicting Impacts of Groundwater Contamination [J]. Environmental Science and Technology, 2001,35(3):66A-73A.
[14] Soga K, Page J W E, Illangasekare T H. A review of NAPL source zone remediation efficiency and the mass flux approach [J]. Journal of Hazardous Materials, 2004,110(1-3):13-27.
[15] Zhang Z, Brusseau M L. Nonideal transport of reactive solutes in heterogeneous porous media: 5. Simulating regional-scale behavior of a trichloroethene plume during pump‐and‐treat remediation [J]. Water Resources Research, 1999,35(10):2921-2935.
[16] Karaoglu A G, Copty N K, Akyol N H, et al. Experiments and sensitivity coefficients analysis for multiphase flow model calibration of enhanced DNAPL dissolution [J]. Journal of contaminant hydrology, 2019,225:103515.
[17] 郭芷琳,马 瑞,张 勇,等.地下水污染物在高度非均质介质中的迁移过程:机理与数值模拟综述[J]. 中国科学:地球科学, 2021,51(11): 1817-1836.
Guo Z L, Ma R, Zhang Y, et al. Contaminant transport in heterogeneous aquifers: A critical review of mechanisms and numerical methods of non-Fickian dispersion [J]. Science China Earth Sciences, 2021,51(11):1817-1836.
[18] Zhu J, Sykes J F. Simple screening models of NAPL dissolution in the subsurface [J]. Journal of Contaminant Hydrology, 2004,72(1-4): 245-258.
[19] Falta R W, Rao P S, Basu N. Assessing the impacts of partial mass depletion in DNAPL source zones: I. Analytical modeling of source strength functions and plume response [J]. Journal of Contaminant Hydrology, 2005,78(4):259-280.
[20] Falta R W, Basu N, Rao P S. Assessing impacts of partial mass depletion in DNAPL source zones: II. Coupling source strength functions to plume evolution [J]. Journal of Contaminant Hydrology, 2005,79(1/2):45-66.
[21] Parker J C, Park E. Modeling field‐scale dense nonaqueous phase liquid dissolution kinetics in heterogeneous aquifers [J]. Water Resources Research, 2004,40(5):147-158.
[22] Christ J A, Ramsburg C A, Pennell K D, et al. Estimating mass discharge from dense nonaqueous phase liquid source zones using upscaled mass transfer coefficients: An evaluation using multiphase numerical simulations [J]. Water Resources Research, 2006,42(11): 48-60.
[23] Saenton S, Illangasekare T H. Upscaling of mass transfer rate coefficient for the numerical simulation of dense nonaqueous phase liquid dissolution in heterogeneous aquifers [J]. Water Resources Research, 2007,43(2):6-20.
[24] Kokkinaki A, Werth C J, Sleep B E. Comparison of upscaled models for multistage mass discharge from DNAPL source zones [J]. Water Resources Research, 2014,50(4):3187-3205.
[25] Agaoglu B, Scheytt T, Copty N K. Impact of NAPL architecture on interphase mass transfer: A pore network study [J]. Advances in Water Resources, 2016,95:138-151.
[26] Trulli E, Morosini C, Rada E C, et al. Remediation in situ of hydrocarbons by combined treatment in a contaminated alluvial soil due to an accidental spill of LNAPL [J]. Sustainability, 2016,8(11): 1086.
[27] Yang M, Annable M D, Jawitz J W. Field-scale forward and back diffusion through low-permeability zones [J]. Journal of contaminant hydrology, 2017,202:47-58.
[28] Shafieiyoun S, Thomson N R. The role of intra-NAPL diffusion on mass transfer from MGP residuals [J]. Journal of contaminant hydrology, 2018,213:49-61.
[29] Christ J A, Ramsburg C A, Pennell K D, et al. Predicting DNAPL mass discharge from pool-dominated source zones [J]. Journal of contaminant hydrology, 2010,114(1-4):18-34.
[30] Guo Z, Russo A E, DiFilippo E L, et al. Mathematical modeling of organic liquid dissolution in heterogeneous source zones [J]. Journal of Contaminant Hydrology, 2020,235:103716.
[31] DiGiano F A, Weber Jr W J. Sorption kinetics in finite-bath systems [J]. Journal of the Sanitary Engineering Division, 1972,98(6):1021- 1036.
[32] Guilbeault M A, Parker B L, Cherry J A. Mass and flux distributions from DNAPL zones in sandy aquifers [J]. Groundwater, 2005,43(1): 70-86.
[33] Park E, Parker J C. Evaluation of an upscaled model for DNAPL dissolution kinetics in heterogeneous aquifers [J]. Advances in water resources, 2005,28(12):1280-1291.
[34] Brooks R H, Corey A T. Hydraulic properties of porous media and their relation to drainage design [J]. Transactions of the ASAE, 1964, 7(1):26-0028.
[35] Kang X, Kokkinaki A, Kitanidis P K, et al. Improved characterization of DNAPL source zones via sequential hydrogeophysical inversion of hydraulic-head, self-potential and partitioning tracer data [J]. Water Resources Research, 2020,56(8):809-831.
[36] Koch J, Nowak W. Identification of contaminant source architectures—A statistical inversion that emulates multiphase physics in a computationally practicable manner [J]. Water Resources Research, 2016,52(2):1009-1025.
[37] DiFilippo E L, Carroll K C, Brusseau M L. Impact of organic-liquid distribution and flow-field heterogeneity on reductions in mass flux [J]. Journal of Contaminant Hydrology, 2010,115(1-4):14-25.
Upscaling dissolved phase mass flux for complex DNAPL source zones.
SONG Mei-yu, SHI Xiao-qing*, MA Chun-long, KANG Xue-yuan, DU Fang-zhou
(Key Laboratory of Surficial Geochemistry, Ministry of Education, School of Earth Science and Engineering, Nanjing University, Nanjing 210023, China)., 2022,42(5):2095~2104
The NAPL phase in the Dense Non-Aqueous Phase Liquid (DNAPL) contaminated site are dissolved in the flowing groundwater sustainably, thus a downstream contaminant plume is created, and a threat is posed to human health. It is important to accurately estimate the downstream contaminant mass flux from the DNAPL source zone. Due to the geological heterogeneity, the mass flux of dissolved phase is changed periodically. The dual-domain upscaling model developed by Christ et al. was often used to calculate the mass flux, however, it was only applicable to the DNAPL source zone with weak heterogeneity. Many numerical examples were used for complex DNAPL source zones with strong heterogeneity, to modify the empirical formula for deriving the source zone depletion index in the dual-domain model, thus the application scope of the dual-domain upscaling model were extended to strong heterogeneity. The applicability and accuracy of the modified model was validated based on Monte Carlo synthetical cases and two two-dimensional sandbox experiments. The comparison results showed that the modified model could be widely applied to complex DNAPL source zones with different structures. Compared with the previous, the accuracy of the mass flux calculated by the modified model was increased by about 35%.
DNAPL;mass flux;GTP;source zone depletion;upscaled models
X703.5
A
1000-6923(2022)05-2095-10
宋美钰(1998-),女,辽宁大连人,南京大学硕士研究生,主要从事地下水数值模拟研究.
2021-09-22
国家重点研发计划项目( 2018YFC1800604);国家自然科学基金资助项目(41977157)
* 责任作者, 教授, shixq@nju.edu.cn

