Quasi-periodic Oscillation Analysis for the BL Lacertae Object 1823+568
Huai-Zhen Li ,Quan-Gui Gao ,Long-Hua Qin ,Ting-Feng Yi ,and Qi-Rui Chen
1 Physics Department,Yuxi Normal University,Yuxi 653100,China;qggao@yxnu.edu.cn
2 Department of Physics,Yunnan Normal University,Kunming 650092,China
Abstract We studied the optical band periodic variability of 1823+568 using the Jurkevich method,the Lomb–Scargle periodogram and the REDFIT38 software,and found evidence of quasi-periodic oscillation.An unprecedented variability with perioddays was identified by three different analysis methods.This quasi-periodic variability most likely results from nonballistic helical jet motion driven by the orbital motion in a binary black hole system.Considering the light-travel time effect,the real physical period is Pd=67.1 yr.Moreover,we estimated that the primary black hole mass is M ⋍1.92×10⁹ M⊙to 3.43×10⁹ M⊙.
Key words:blazars (1823+568)– relativistic jets– non-thermal sources
1.Introduction
Blazars are a special subclass of active galactic nuclei(AGNs) with rapid and violent variability in almost all bands.Blazars are usually categorized into two subclasses:BL Lacertae objects (BL Lacs) and flat spectrum radio quasars(FSRQs).In general,BL Lacs show weak or even no emission lines with equivalent width EW <5 Å,but FSRQs have strong ones(Böttcher 2019).Variability is a common characteristic of blazars,and variability analysis is the most powerful tool to probe the radiation mechanism and constrain the parameters of the physical model (Sillanpää et al.1988;Lainela et al.1999;Chandra et al.2014).The detection of periodicity in blazars would help us to locate relevant physical parameters,and would strongly limit physical models of blazars (Lainela et al.1999).The variability timescales of blazars cover a wide range from minutes to years (Fan 2005;Otero-Santos et al.2020).Based on the variability timescales,the variability can be roughly divided into three classes:intra-day variability (IDV),short timescale variability(STV)and long timescale variability(LTV).The timescales of IDV,STV and LTV refer to changes of the order of minutes or hours,days to weeks,and over months to years,respectively(Liu et al.1997;Fan 2005;Gupta et al.2008;Gaur et al.2012;Li et al.2015,2016;Otero-Santos et al.2020).The variabilities of many objects have been studied extensively,such as Mrk 421(Chen et al.2014;Li et al.2016),S5 0716+714 (Raiteri et al.2003;Zhang et al.2008;Poon et al.2009;Fan et al.2011;Dai et al.2015;Liu et al.2021),OJ 287(Sillanpää et al.1988;Fan et al.2010),3C 454.3(Li et al.2006,2015;Qian et al.2007;Fan et al.2019,2021),3C 66A (Fan et al.2018),3C 273 (Liu et al.2021),3C 279(Xie et al.2002;Li et al.2009),PKS 1510-089 (Xie et al.2002,2008),etc.
The emission variability of blazars can be explained within scenarios such as a binary black hole system(BBHS,Sillanpää et al.1988;Lehto &Valtonen 1996;Romero et al.2000;Xie et al.2005,2008;Valtonen et al.2008;Caproni et al.2013;Graham et al.2015),accretion flow instabilities (Honma et al.1992;Kawaguchi et al.1998;Fan et al.2001;Liu et al.2006;Kharb et al.2008;Fan et al.2010;Karouzos et al.2012;McKinney et al.2012;Piner &Edwards 2014),a helical jet structure (Villata &Raiteri 1999;Ostorero et al.2004;Mohan&Mangalam 2015),rotation (Vlahakis &Tsinganos 1998;Hardee &Rosen 1999),precession (Romero et al.2000;Caproni et al.2013),etc.In the framework of a BBHS,the periodic change of radiation in a blazar is due to the Keplerian orbital motion of the BBHS,which would lead to periodic accretion perturbations,or jet nutation.The instabilities in an accretion disk may be related to disk perturbations,which could be caused by penetration of the accretion disk,as well as tidal action in the BBHS.The effect of instabilities in a slim accretion disk atmosphere around a supermassive black hole can cause the optical variability of AGNs (Kawaguchi et al.1998).The mechanism for variability caused by the jet’s helical structure,rotation or precession is referred to as geometric effects which are related to changes in the viewing angle or the observation of different emitting regions at different times.The variation produced by the geometric effects in different bands is usually correlated and exhibits quasi-periodicity.
1823+568 was classified as a BL Lac with a redshift z=0.664±0.001 (Lawrence et al.1986;Roland et al.2013).Observation found that the host galaxy of 1823+568 is elliptical (Falomo et al.1997),and the jet morphology on kpc scales is complex(O’Dea et al.1988).Appreciable polarization structure (Gabuzda et al.1989),superluminal motions,and high and variable polarization (Perley 1982;Aller et al.1985)in 1823+568 were identified(Gabuzda et al.1989).Very Large Array(VLA)observations found there are wiggles of the jets in 1823+568 which can be caused by helical instabilities in the magnetic field structure,as well as by the precession of the central engine with ballistic motion of the ejecta (O’Dea et al.1988).The variability of 1823+568 was first investigated by Schramm et al.(1994) who identified some rapid variabilities>0.5 mag occurring within a few days.Based on the multiepoch Very Long Baseline Array (VLBA) MOJAVE 15 GHz data,a quasi-periodic flux variation with timescale about 7 yr,and a relation between the peak flux density and the position angle of the inner-jet were reported by Liu et al.(2012) who tried to explain the periodicity and correlation using ballistic jets with a precession nozzle model (B+P model).They found the B+P model can adequately interpret the correlation between the peak flux density and the position angle,but the origin of the periodic precession is not clear.On the other hand,the periodic variability of blazars may be related to the nonballistic helical motion driven by the orbital motion in a BBHS,jet precession or an internally rotating jet flow(Rieger 2004).For 1823+568,a BBHS existing in the center of the source was reported by Roland et al.(2013),and nonballistic motion was found by the MOJAVE program(Lister et al.2009).Therefore,the variability behavior and the driving mechanisms of variability need to be investigated.
In this paper,based on optical band observation data of the Katzman Automatic Imaging Telescope (KAIT),we will analyze the variability timescale of 1823+568,and investigate the emission mechanisms.In the following,the observation data are described in Section 2.The periodicity analysis is shown in Section 3.Discussion and conclusion are given in Section 4.
2.Observation Data and Variability Analysis of the Light Curves
Observations of 1823+568 at optical band are performed with the 0.76 m KAIT at Lick Observatory which is a robotic telescope.Since August 2009,KAIT has been used to monitor γ-ray bright blazars (Cohen et al.2014).Now,a sample containing 163 blazars has been monitored.Unfiltered optical observations of KAIT were carried out,and the observed unfiltered photometry was transformed roughly to R-band (Li et al.2003;Wang &Jiang 2021).The strict transformation procedure considers the instrument magnitudes and the color terms of both the standard star and the target (Li et al.2003;Wang &Jiang 2021).However,the color term of the target is not considered in the pipeline of the transformation (Wang &Jiang 2021).The data“mag2”and“mag2err1”of KAIT are the best photometry obtained by Weidong Li3http://herculesii.astro.berkeley.edu/kait/agn/READMEand have considered the Galactic extinction of A=0.26 mag (Li et al.2003).
In this work,the data “mag2” and “mag2err1” of KAIT are used,and the light curve is depicted in Figure 1,spanning 8.2 yr from July 2010 to September 2018 with 382 data points.During the monitoring,the variation of magnitude is ΔR=2.87 mag between 14.98 and 17.85 mag.Moreover,the variability index can indicate the activity level of the object,and it is defined by the following equation (Fan et al.2002)
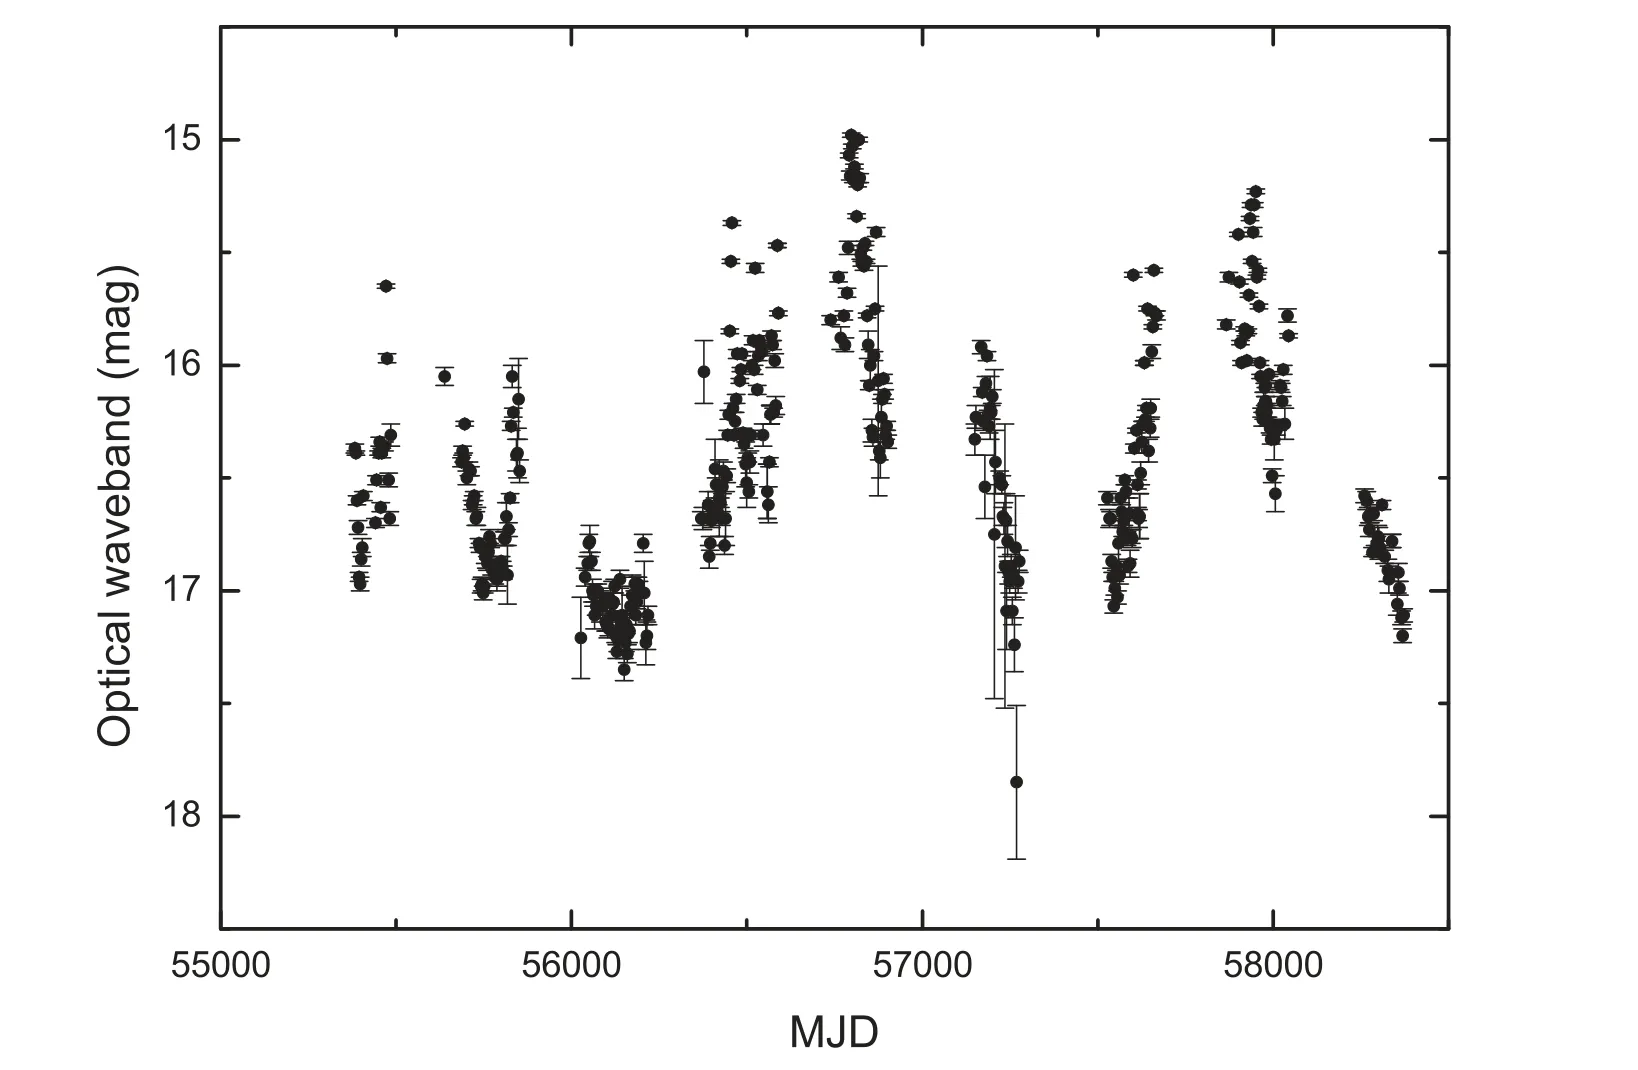
Figure 1.The optical band light curves of 1823+568.

where Fmaxand Fminare the maximal and minimal flux,respectively.The flux density F can be converted from magnitude m by the following formula,

where F0is the zero-point.Then,the variability index,as a function of magnitude m,is given by

where mmaxand mminare the maximal and minimal magnitudes,respectively.During the monitoring,the maximum and minimum magnitudes aremag andmag,respectively.Therefore,the variability index V=0.87 which suggests that the object 1823+568 is an active object at optical band.
3.Periodicity Analysis
In order to reveal the properties of the emission variability of 1823+568,we will analyze the variability period of optical band light curves using three specialized techniques:the Jurkevich method(Jurkevich 1971),the Lomb–Scargle periodogram (LSP,Lomb 1976;Scargle 1982) and the REDFIT38 software (Schulz &Mudelsee 2002),respectively.These methods have different approaches,and can apply to uneven data samples to explore the variability property,which ensures the reliability of the results.
The Jurkevich method is based on the expected mean square deviation,and tests a series of trial periods using the phase folding technique (Jurkevich 1971).This method can effectively analyze unequally spaced and non-sinusoidally modulated astronomy observation data.Based on the phases,all data are divided into a certain number of groups.Then,the varianceof the lth group and the sumsfor all groups are obtained by the following formulas,

where xiand mlare an individual observation and the number of observations in the lth group,respectively.If the data sample contains a periodic signal,the sumswould reach their minimum value when a trial period is equal to an actual one.In order to test the reliability of the period,a quantitative criterion,f-test,was provided by Kidger et al.(1992).The parameter f can be estimated by the following formula,

The parameter f ≥0.5 indicates that the period in the sample is strong,while f <0.25 implies that the obtained period is weak or even spurious.
We employed the Jurkevich method to analyze the light curve of 1823+568 at optical band,and the results are displayed in Figure 2.Figure 2 shows that there is an obvious minimum ofat the timescaledays with f=0.62 (>0.5) which indicates it is a strong period.The uncertainties of the results are estimated with the half width at half maximum(HWHM)of the minimum(Jurkevich 1971).In addition,there are three other significant minimums at the timescalesdays with f=0.75,0.70 and 1.52,respectively.This suggests that P2,P3and P4are also strong periods.Moreover,one can find that there is a simple multiple relationship among the periods P1,P2,P3and P4,namely,P2≈2P1,P3≈3P1and P4≈4P1.This implies that the periods P2,P3and P4are most likely astronomical multiple frequencies of the period P1.This suggests that there exists a quasi-periodic signal in the optical band light curve of 1823+568 with the timescaledays.
In order to test the reliability of the results of the Jurkevich method,we also analyzed the light curve of 1823+568 utilizing the LSP method.The LSP method is a widely used traditional technique in timescale analysis.The algorithm of the LSP method was described by Lomb (1976) and Scargle(1982).For a time series x(tk) (k=0,1,2,3...,N0),the periodogram is given by the following equation,

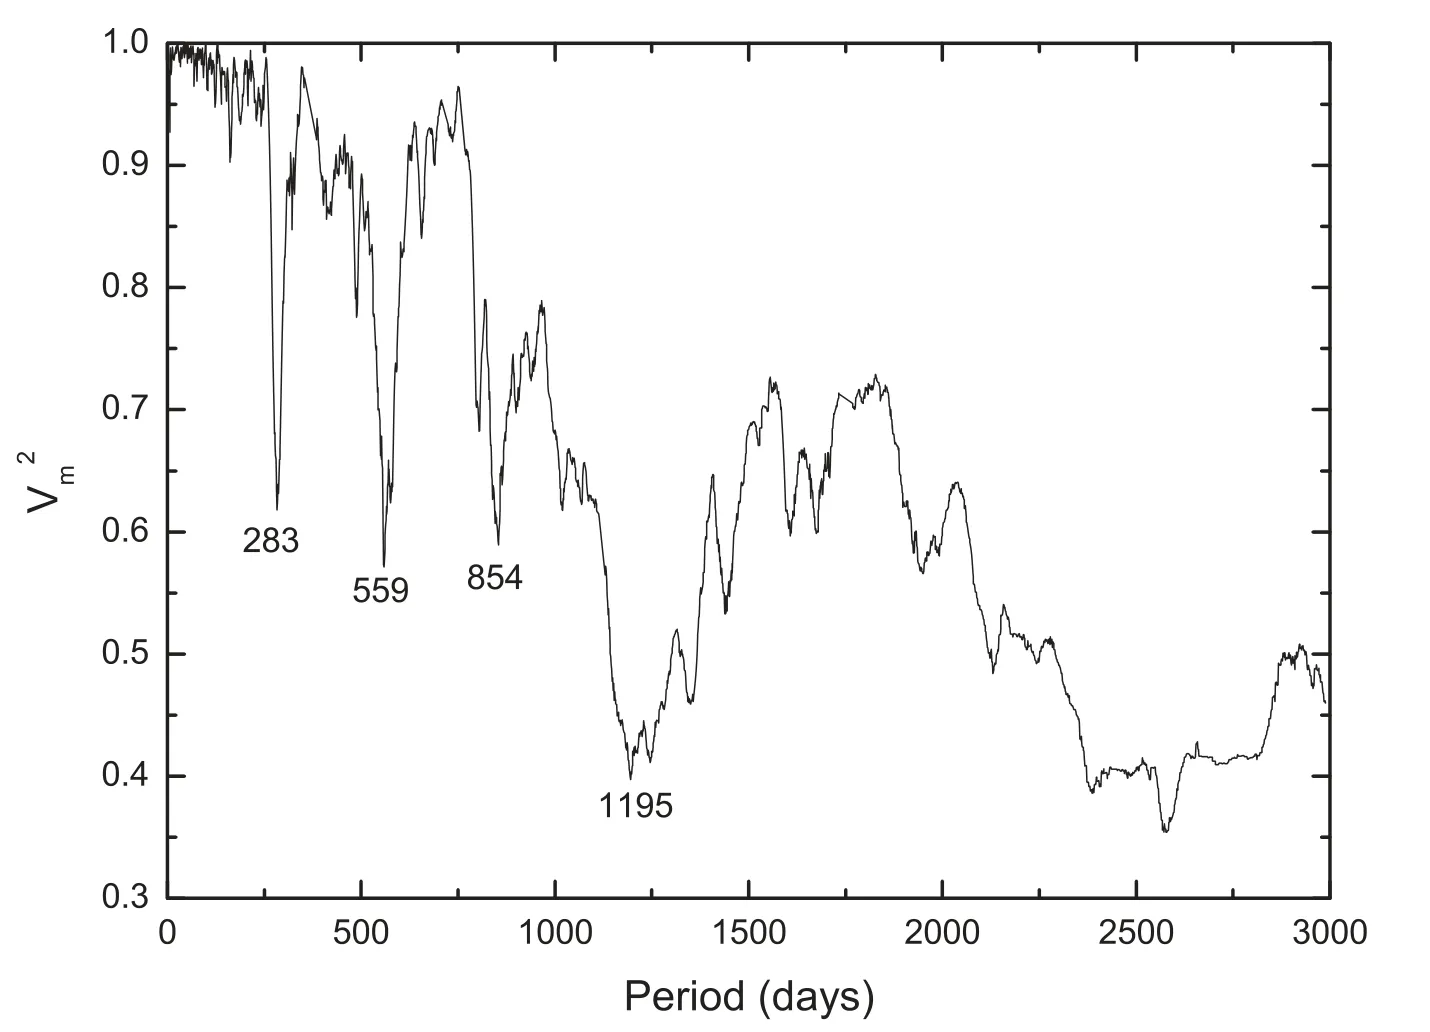
Figure 2.The Jurkevich method results of 1823+568.
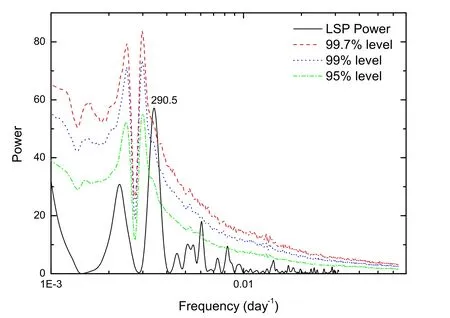
Figure 3.The Lomb–Scargle periodogram results of 1823+568.
In order to test the significance level of the results,we assessed the confidence level by simulating the multiwavelength variability as red noise with a simple power-law power spectral density model(PSD ∝f−β),and the confidence level is calculated by a Monte Carlo simulation (Yang et al.2020;Wang &Jiang 2021).Based on the algorithm recommended by Timmer &Koenig (1995),we simulated 10,000 artificial light curves with the slopes of power spectral density β=1.18 which was obtained by fitting the spectrum of the Lomb–Scargle periodogram using the linear least squares method (Yang et al.2020) (see Figure 4).Then,we resampled the artificial light curves considering the uneven sampling effect of the observation sample (Li et al.2015;Wang &Jiang 2021).Finally,we calculated the red noise confidence level by analyzing the 10,000 resampled light curves using the Lomb–Scargle periodogram.The 95%,99% and 99.7% confidence level curves are depicted in Figure 3 which reveals a higher significance level than 99.7% at the timescaledays.This suggests that the variability with the perioddays is significant.

Figure 4.The fit results of PSD.
To verify the significance level and the reliability of the Jurkevich and LSP results,we also calculated the red noise significance level using the REDFIT38 software.The REDFIT38 software was developed based on the first-order autoregressive(AR1)model,which is included in the generally used and more robust ARIMA(p,d,q)test with AR(p),MA(q)and d=0,1,...It is often performed to estimate the red noise spectrum from the data time series by fitting a first order autoregressive process.Moreover,the REDFIT38 software can calculate the significance of the result,and provide the FAP levels of the result with maximum 2.5σ (99%).The results of the REDFIT38 software are plotted in Figure 5 suggesting that there are three peaks at the timescale 166.1 (f=0.00602),284.7 (f=0.003512) and 1494.9 (f=0.0006689) days with a higher confidence level than 99%,respectively.The timescale 284.7 days is in good agreement with the results obtained by the Jurkevich and LSP methods,which suggests that the timescale is most likely the real variability period in the optical light curve of 1823+568.The timescale 1494.9 days may be a harmonic timescale of the 284.7 day one since it is about 5 times 284.7 days.The timescale of 166.1 days must be ruled out,and more observations are needed to confirm it,because it is only obtained by the REDFIT38 software (see Table 1).A summary of the results of the periodicity analysis is given in Table 1 which implies that the period of about 283 days is uniformly obtained by three different analysis methods.

Table 1 Summary of the Results of the Periodicity Analysis
4.Discussion and Conclusions
Based on the optical band observation data of KAIT,we have studied the optical band variability period of 1823+568 using the Jurkevich method,LSP method and REDFIT38 software.An unprecedented variability period ofdays was confirmed by three different analysis methods.The periodic variability may be caused by some physical timescales such as the approximate length of large outbursts,a sum of intervals of smaller outbursts close in time or the observation gaps (Kartaltepe &Balonek 2007;Li et al.2015).From Figure 1,one can find that there is no obvious activity lasting for about 283 days.In addition,there are no regular observation intervals with a timescale of about 283 days in the light curve.This implies that theday periodic variability is not caused by those physical timescales.Thus,it can result from the nature of the intrinsic variability.Moreover,it is of interest to note that the variability period of T=7.0 yr obtained by Liu et al.(2012) is nine times our period P=283 days (T=9P).Therefore,a variability period with the timescale ofdays indeed exists in the R-band light curve of 1823+568.
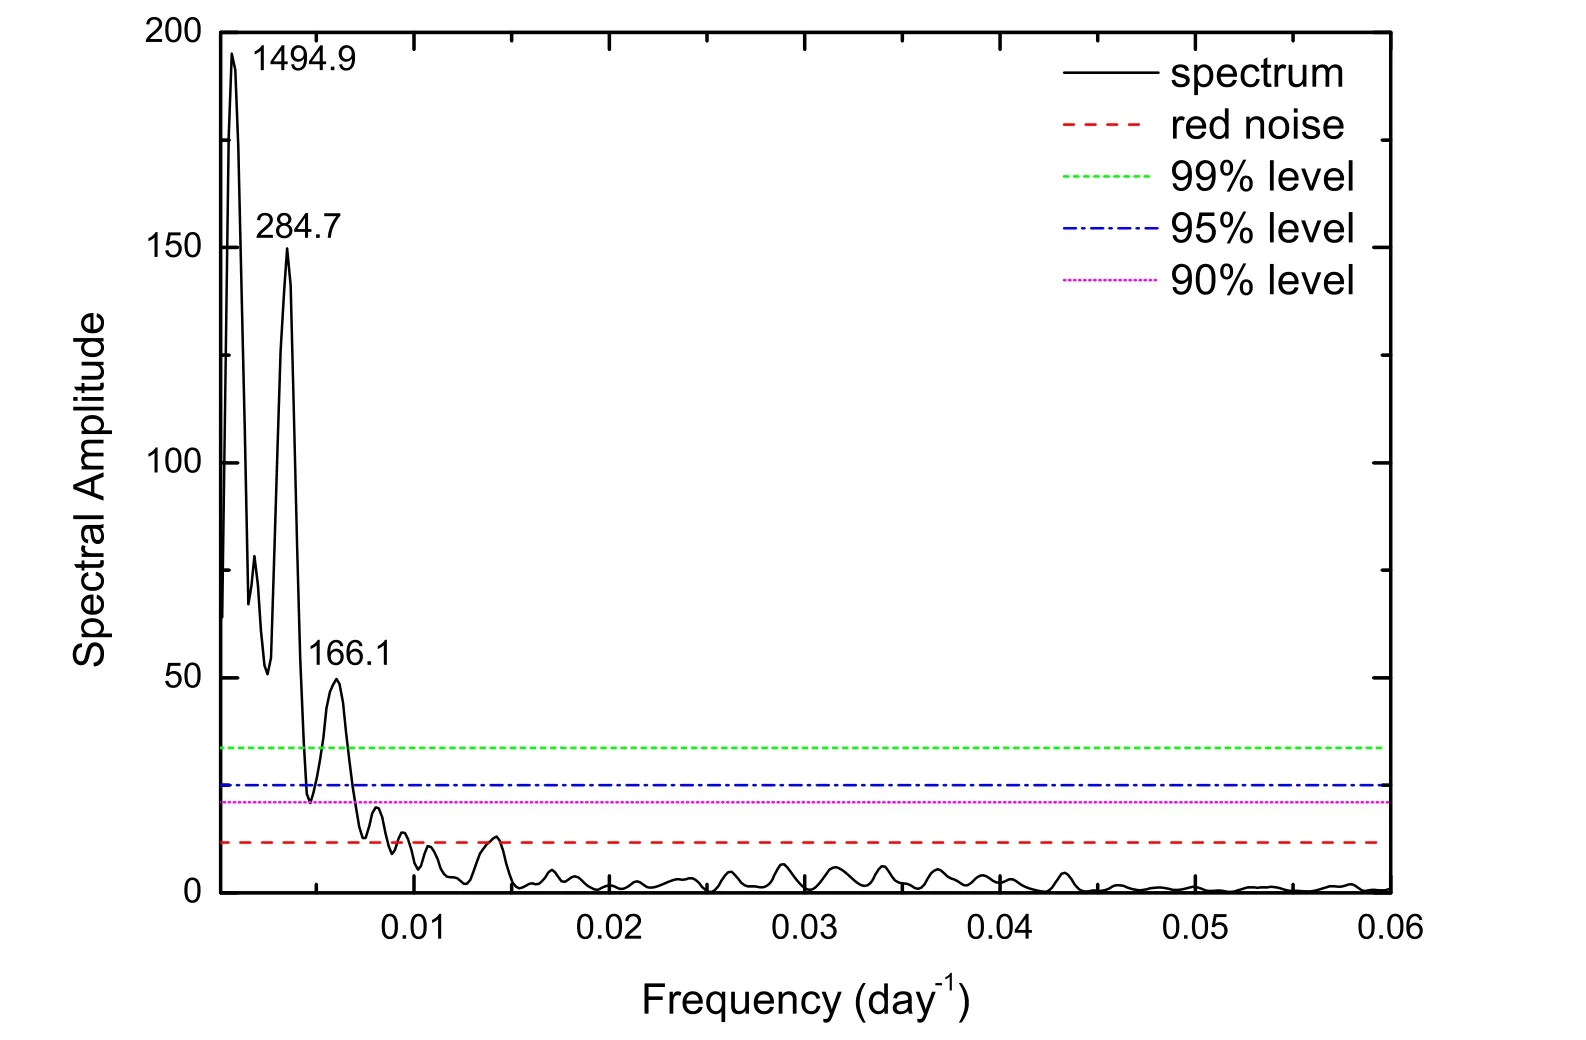
Figure 5.The results of 1823+568 calculated by the REDFIT38 software.
For 1823+568,it was classified as a BL Lac object whose emission is usually correlated with the non-thermal emission of the relativistic jet.Moreover,the wiggles of the jet were observed by VLA (O’Dea et al.1988).Therefore,the optical variability of 1823+568 with timescaledays can be explained well under the framework of a geometrical model which includes jet precession,rotation,helical structure,etc.(Rieger 2004;Li et al.2009,2015,2016,2018;Ackermann et al.2015;Mohan et al.2016a,2016b).In the scenario of a geometrical model,the quasi-periodic variability is caused by a quasi-periodic change in the Doppler boosting factor δ(t).The change in δ(t) is related to the variability of viewing angle θ(t)which is the angle between the jet and the direction of the observer.The relation between δ(t),θ(t) and the velocity of radiation particles v is given by the following formula,

For periodic variability caused by the nonballistic helical motion of the jet,the real physical period Pdis much larger than the observed period P due to the light-travel time effect(Rieger 2004;Li et al.2009,2015).The relation between Pdand P is Pd⋍Γ2P/(1+z),where Γ and z are the Lorentz factor and the redshift,respectively.For 1823+568,the observed period,the Lorentz factor Γ and the redshift z are P=283 days,Γ=12.0 (Jorstad et al.2005) and z=0.664 (Lawrence et al.1986),respectively.So,the physical period is Pd⋍67.1 yr.For a BBHS with a given value of the mass ratio M/m between the primary M and secondary black holes m,the mass of the primary black hole is(Begelman et al.1980;Ostorero et al.2004;Li et al.2015).Roland et al.(2013) suggested that the mass ratio M/m is 4 to 10.5.Then,the mass of the primary black hole is M ⋍1.92×10⁹M⊙to M ⋍3.43×10⁹M⊙which is consistent with the black hole masses MBH⋍1.26×10⁹M⊙and 1.05×10⁹M⊙reported by Wu et al.(2009) and Roland et al.(2013),respectively.Moreover,Liodakis et al.(2018) proposed that the Lorentz factor of 1823+568 is 8.7 to 54.13.The corresponding mass of the black hole is 6.87×10⁸M⊙to 2.38×10¹¹M⊙when the mass ratio M/m=4.However,the mass of the central black hole 2.38×10¹¹M⊙is too large.The black hole mass based on Lorentz factor Γ=12.0 is in good agreement with the result reported by other authors(Wu et al.2009;Roland et al.2013).In addition,Lorentz factor Γ=12.0 is in the range of 8.7–54.13 reported by Liodakis et al.(2018).Therefore,it is reasonable to adopt Γ=12.0 to estimate the black hole mass.
Acknowledgments
We gratefully thank the anonymous referee for the very helpful comments which helped us to greatly improve this paper.This research has made use of data provided by the optical observations of KAIT.This work is supported by the National Natural Science Foundation of China (NSFC,Grant Nos.12063005,12063006,11863007 and 12063007),the Program for Innovative Research Team (in Science and Technology) in University of Yunnan Province (IRTSTYN)and Yunnan Local Colleges Applied Basic Research Projects(2019FH001-12,2019FH001-76,202001BA070001-031).
ORCID iDs
 Research in Astronomy and Astrophysics2022年5期
- Research in Astronomy and Astrophysics的其它文章
- Constraining the Parameterized Neutron Star Equation of State with Astronomical Observations
- Classifying Galaxy Morphologies with Few-shot Learning
- Possibility of Searching for Accreting White Dwarfs with the Chinese Space Station Telescope
- A New X-Ray Tidal Disruption Event Candidate with Fast Variability
- Detecting and Monitoring Tidal Dissipation of Hot Jupiters in the Era of SiTian
- The Astrometric Performance Test of 80cm Telescope at Yaoan Station and Precise CCD Positions of Apophis
