Accurate Data Match and Call Method for the Thermal Compensation Database of the Reflector Antenna
Yuefei Yan ,Song Xue ,Xinlan Hu ,Peiyuan Lian ,Yan Wang ,Lin Li ,Qian Xu,Na Wang,Wulin Zhao,Yuanpeng Zheng,and Congsi Wang
1Key Laboratory of Electronic Equipment Structure Design,Ministry of Education,Xidian University,Xi’an 710071,China;sxue@xidian.edu.cn,congsiwang@163.com
2 School of Information and Control Engineering,Xi’an University of Architecture and Technology,Xi’an 710055,China
3 School of Physics and Technology,Xinjiang University,Urumqi,830046,China
4 Xinjiang Astronomical Observatory,Chinese Academy of Sciences,Urumqi 830011,China
5 The 39th Research Institute of China Electronics Technology Group Corporation,Xi’an 710065,China
6 The 54th Research Institute of China Electronics Technology Group Corporation,Shijiazhuang 050081,China
Abstract The influence of thermal deformation on the performance of reflector antennas has become increasingly significant with the increasing aperture and working frequency.The use of a thermal compensation database is an efficient method to compensate for the deformation caused by the non-uniform temperature distribution.However,how to efficiently and accurately match and call the database remains as one of the tough challenges for the antenna thermal compensation system to achieve real time compensation.Therefore,this study proposes a data match and call method for the thermal compensation database of the reflector antenna,matching the database from three aspects:the overall rms match of temperature data,the similarity area match of each data sample,and the key area match of key structural positions.The validation of this method is demonstrated in an example.The difference between the pointing adjustment amount calculated by the matched data and the collected data was found to be less than 1″,which satisfied the requirements of practical engineering,thus achieving real-time thermal compensation of the antenna.
Key words:instrumentation:miscellaneous– methods:miscellaneous– telescopes
1.Introduction
Whether the technical requirements of scientific research fields such as astronomical observation and deep space exploration (Wu et al.2020),or the developing innovations in technical fields such as radar communication and military defense are considered (Rahmat-Samii &Haupt 2015),largescale reflector antennas have played a significant role in these areas (Lian et al.2021).
During practical engineering projects,under the combined effect of Sun heat and wind gusts (Wang et al.2017),the temperature field distribution of the antenna structure becomes complicated(Lian et al.2020),inducing thermal deformation and affecting the ultimate electrical performance of the antenna.To achieve real-time compensation of electrical performance,a thermal compensation database containing the related temperature data and the corresponding electrical performance compensation amount can be established during practical operation(Doyle 2009).Real-time compensation can be achieved by matching the collected data with a table look-up scheme (Wang et al.2014).In other words,when the antenna is operating,the collected temperature data can be directly matched with the temperature data stored in the predefined database,and the calculated electrical performance compensation adjustment amount corresponding to the temperature data in the compensation database can be called accordingly.This method can achieve real-time compensation of the electrical performance of the reflector antenna.It is evident that the accuracy of the database match and call is the determining factor of whether the antenna thermal compensation system can be applied in practical engineering projects.
Based on previous real-time compensation procedures,the key to database match and call is obtaining temperature field data with temperature features similar to those of the database,during the process of real-time compensation for reflector antenna thermal compensation.If a set of temperature data measured through the temperature collecting system is used to invert the antenna temperature field and calculate the deformation displacement field to match the adjustment amount(Greve et al.2005),this can hardly be called real-time compensation.If only a single matching constraint is applied and a certain data feature of the collected temperature data is compared,it tends to introduce inaccurate and incomplete matching,and false matching results can cause the deterioration of the compensation effect.
This study mainly focuses on the matching of temperature data,which directly matches and calls the corresponding electrical performance compensation amount to compensate for the antenna.We first examine three commonly used methods for describing the similarity of data sets,and based on the described method of data similarity,we propose an efficient and accurate method for triple match and call of the database considering the features of the reflector antenna’s thermal compensation system database.
2.Data Similarity Description Method
2.1.The Least Squares Method
For storing linear data,if the database is a simple linear data set,the matching method is relatively simple.The N-time fitting or other fitting methods are applied to obtain the fitting parameters that describe the features of the data set.Then,using these parameters to match and call the data is sufficient.For example,if the data are a simple linear data set,they can be matched by parameters;if the database is a complex linear data set,it is only necessary to adopt a piecewise fitting method based on the previous method.With the multiple sets of fitting results,we can obtain the final database expression parameters,which can be used as the matching criterion.
However,in the actual databases,the data with no correlation between databases are known as discrete data sets.For similarity matching of these database data,the least squares method(LSM)is a common mathematical solution in engineering applications.The basic idea is to select an estimator that minimizes the sum of squares of the difference between the models(including static or dynamic,linear or nonlinear data) and the measured data(Levenberg 1944).In other words,the idea of LSM is to minimize the sum of squares of the observation points and the estimated points.The purpose of this method is to ensure that the collected data are infinitely close to the sample data in the database.
The estimated sum of squared errors of the LSM is

The correlation between the data can be expressed using the correlation coefficient (Asuero et al.2006).The correlation coefficient is a statistical value that describes the degree of correlation and direction between the variables,and r is generally used to measure the correlation between data.

2.2.The Feature Matching Method
Currently,digital image processing technology has matured after several years of continuous development.Whether it is applied closely to issues related to peoples’lives,such as target tracking,three-dimensional imaging reconstruction and image stitching,or national security systems such as criminal face recognition,a large number of feature matching methods is used to perform similarity matching and calls existing databases in order to obtain a suitable target(Jiang et al.2020).
The process of feature matching mainly consists of three steps:
(1) Feature detection (Agrawal et al.2020):Process the information points of the matched image and detect the targeting features.
(2) Feature description (Li et al.2021):After detection,the description is pertinent to the matching of features.Describing local features,that is,a specific description of features,will facilitate the application of final feature matching.
(3) Feature matching (Fischer et al.2021):Through the previous preparation of preliminary matching objects,constraints were used to eliminate matching errors and enhance robustness.
The essence of the feature matching method is to extract distinctive features from the matched image as the reference unit,and then perform similarity matching through the reference unit.This method bridges partialism and holism.Feature units are usually feature points,feature areas,and feature contours.This method is characterized by its convenience and fewer calculations.However,it is also of low accuracy and needs to correlate with other matching constraints to improve the accuracy of its match and call.
2.3.The Pattern Matching Method
Research on matching patterns began in the 1980s,and in the early days it was mainly for pattern integration services.With the development of technology,the demand for database integration calls has been increasing.Pattern matching integrates the data sources into a database.During this process,the mapping between the data source pattern and the features of the database is used to complete the extraction and conversion of data from the source data (Singhal &Seborg 2006),which is a generic data match and call.The pattern-matching method is mostly utilized for comprehensive matching in the application field of web data sources.The common pattern-matching methods are as follows:
(1)The similarity flooding(SF)method is mainly focused on calculating the matching result based on the correspondence between the column name and the data type in a database pattern (Melnik et al.2002).
(2) The schema mapping method based on the data distribution (SMDD) method is mainly based on the matching of data instance features in the database.(Li et al.2005).
(3) The IMAP method is a system for the comprehensive application of mixed pattern matching(Dhamankar et al.2004).Its essence is the instance detection and matching of various data types,such as text,numbers and dates.
The single-pattern-matching method has its limitations.It can only perform database matching for certain features or types.Therefore,mixed matching,which uses multiple information sources,standards and various matching techniques to jointly determine the matching target,is expected to be more effective.
This study used the idea of mixed pattern matching for reference and applied different matching methods to successively narrow the matching range according to the structure of the thermal compensation database to achieve the final matching effect.
3.The Triple Match and Call Method for Thermal Compensation Database
When the construction of the reflector antenna is completed and ready for operation,a thermal compensation database will be established,and the database will be perfected gradually during the usage of the antenna after it is put into service.For the deformation of the antenna caused by temperature,a qualified matching data set could be obtained by comparing the collected temperature with the temperature stored in the database.This is an application of the matching method.It can be assumed that the two sets of data are approximately similar.Then,real-time compensation can be achieved when the intermediate calculation amount corresponding to the matching data set is directly called to calculate the electrical performance compensation adjustment amount.According to the temperature data collected in real time,the triple match and call method proposed in this study is used to match the data rms,data similarity area,and data key area to match and call the database,completing the compensation of the electrical performance adjustment amount on the reflector surface to ensure the accuracy of the compensation.The proposed matching process is illustrated in Figure 1.The following section describes each of the triple match and call methods.
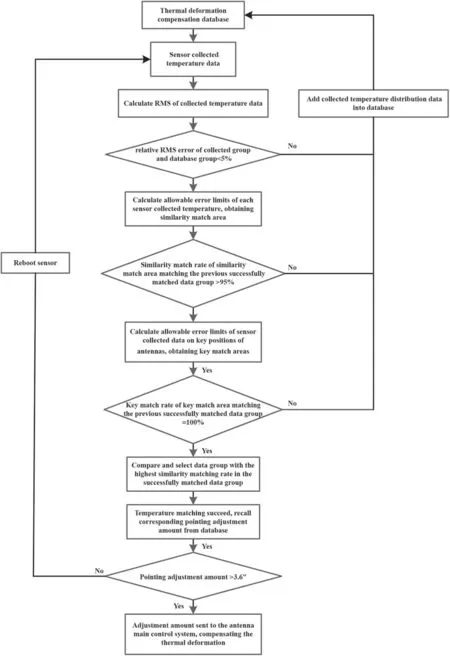
Figure 1.Application process of triple match and call method.
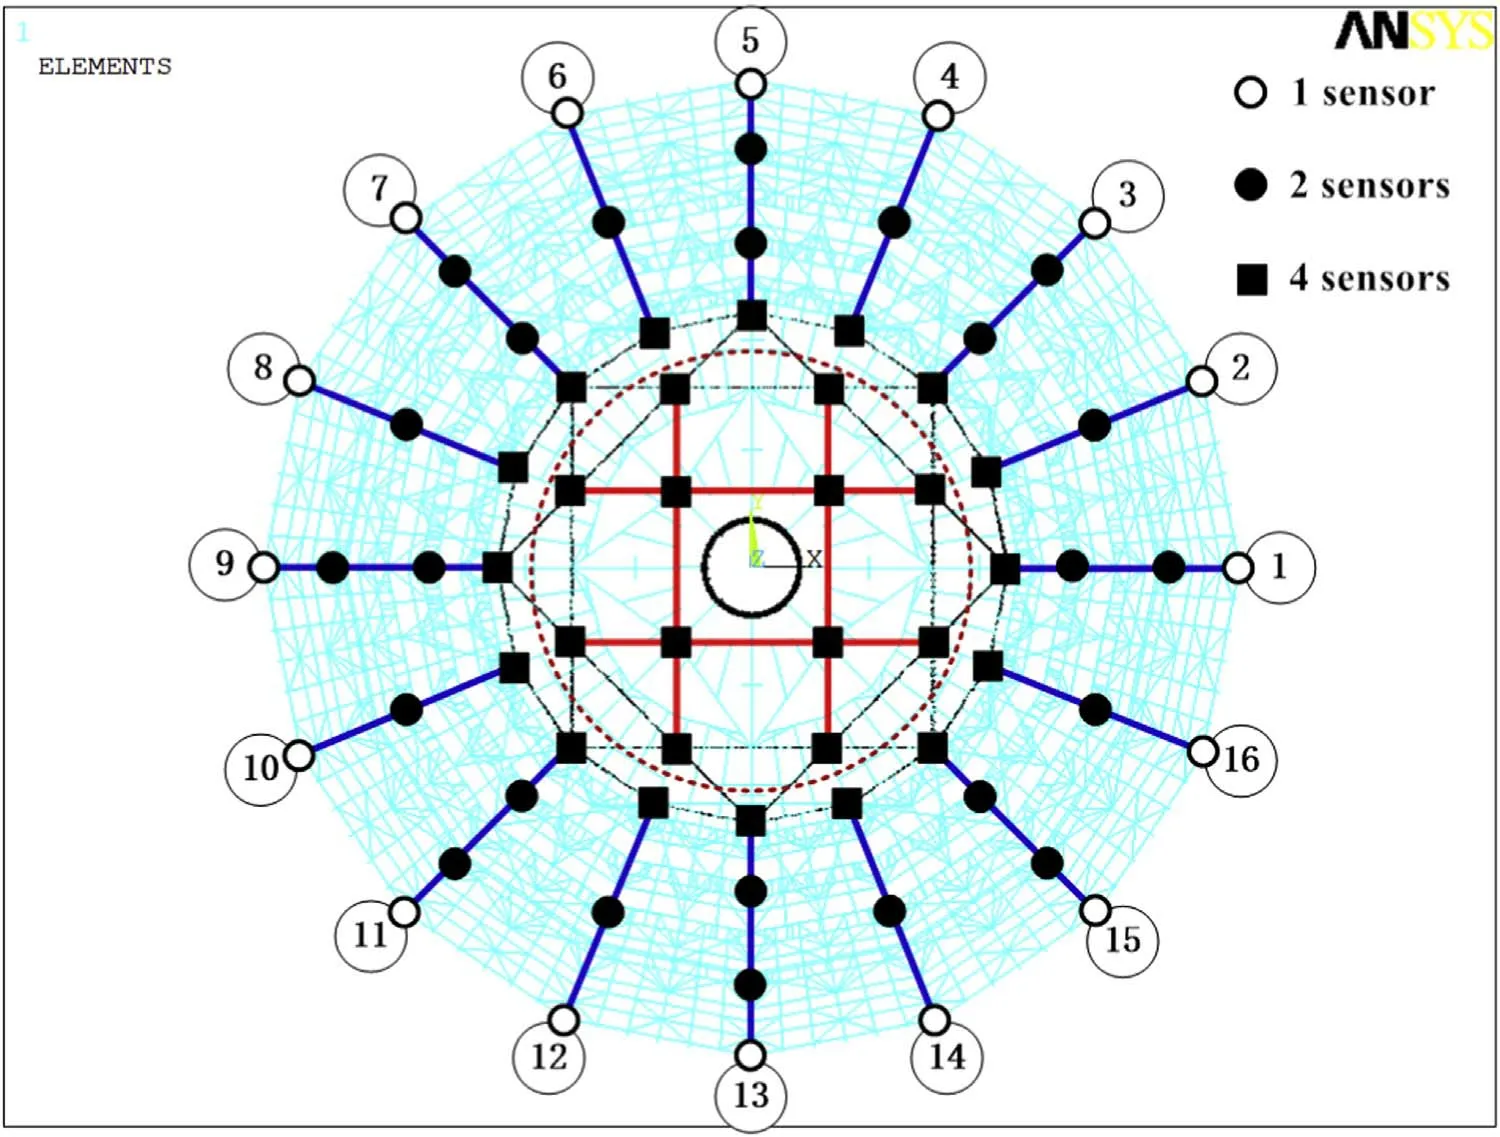
Figure 2.Schematic of the overall temperature sensor layout.
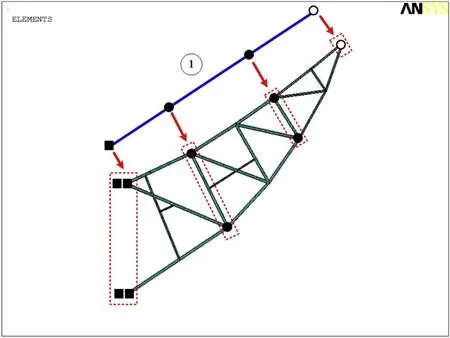
Figure 3.Schematic of radiating beam temperature sensor layout.
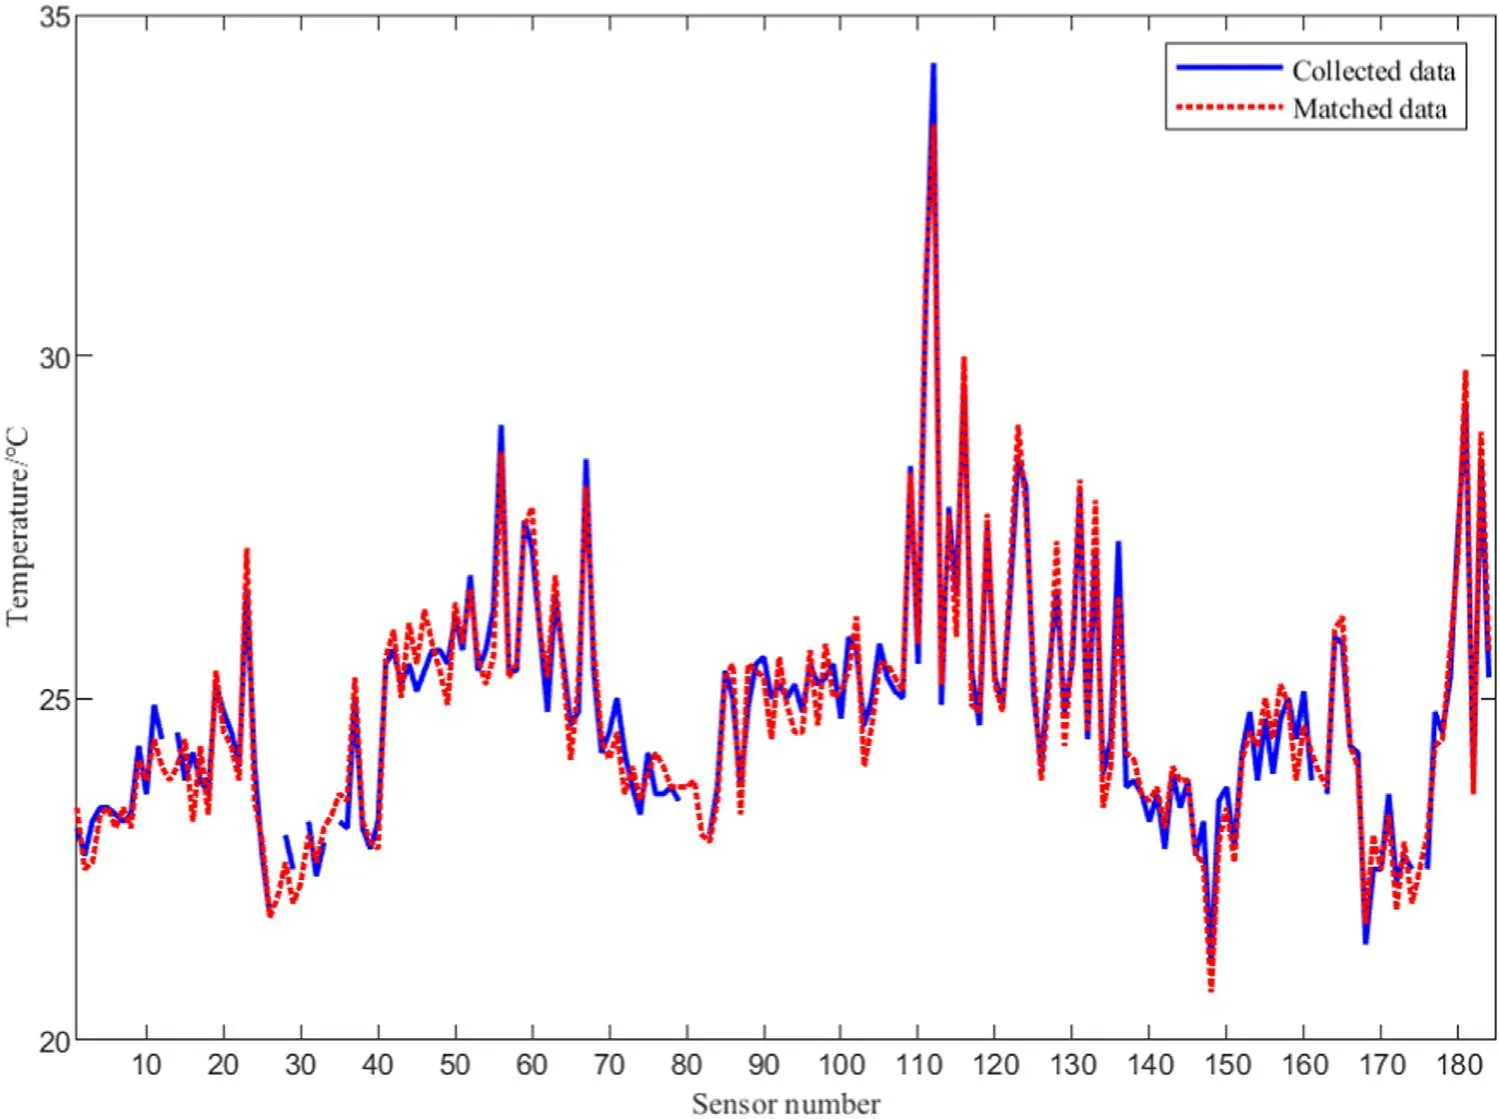
Figure 4.Schematic of collected temperature data set and matching temperature data set.
3.1.Initial Match:the Root Mean Square (rms) Error Match of Temperature Data
The temperature sensor collects a set of temperature data,and the collected temperature is arranged according to its sensor ID.The data collected by the sensors are not linear,and the data are independent and relatively discrete.Because the number of sensors is limited,the data sample is not large,and therefore,the root mean square (rms) error is used to indicate the degree of dispersion of a set of collected temperature data.The primary matching condition for the two sets of temperature data matched is that the degree of dispersion must be similar.Under normal circumstances,the accuracy of the temperature sensor is ±1°C,and the working ambient temperature in the antenna deformation simulation analysis is set to 20°C.Therefore,it can be considered that when matching the rms error of the data set,the limit of the relative error is taken as 5%,which acts as the matching criterion of the rms error matching.This is the initial match of the triple match and call methods.The process of rms matching of the temperature data set is as follows:
(1) The temperature collected by the sensor is indicated aswhere N is the number of sensors.
(2)Calculate the rms of the collected temperature data TRMSc.

(3) Obtain the rms error of the collected temperature data set calculated in step(b),along with the rms error of the temperature data set stored in the databasewhere K is the number of data sets stored in the database.
(4) Calculate the relative error of the two sets of data according to the formula.

Based on the method described above,the collected data are matched for the first time,and the data sets that do not match the collected temperature data in the database are eliminated using the required matching of the degree of dispersion.
3.2.Second Match:Similarity Area Match of Temperature Data
When the first match is completed,the second match of the collected temperature data can be performed.We set a similarity match area for the temperature data collected by each sensor.During the matching process,a confidence region is used to match the database.At the same time,a limit is set up for the overall match degree of the data.The overall match error limit of 95% is set based on experience.
(1) The allowable error limit is determined according to the requirements of the engineering indices,and the allowable error limit of the collected temperature of each sensor is calculated.According to the collected temperature,the error limit is obtained by
(2) Therefore,the similarity match area of the sensor’s current collected temperature is determined as ai.

(3) The similarity match area set of the collected temperature data set can be expressed as

(4) The similarity match area A is successively matched with the database temperature set,which is called from the initial match,and the similarity match area of each sensor in the collected temperature data set is matched.Equation (7) (Smis the number of successfully matched sensors,SNis the total number of sensors) obtains the similarity match rate P,which indicates the number of sensors that are successfully matched in a set of data matching.The value of P is determined according to engineering requirements,generally 95%.P can be expressed as

3.3.Third Match:Key Area Match of Temperature Data
The key area is the area where the deformation of certain structural positions in the reflector antenna will cause theelectrical performance to deteriorate to a greater extent.When performing a temperature match for this type of structural position,the allowable error limit of the match should be smaller,so the degree of match would be higher.Therefore,when performing key area matching,we take one-half of the error limit of the similarity match area and require the degree of match to be 100%,that is,complete matching.The matching process of the similarity area of the temperature data is as follows:
(1) The key positions of the antenna structure are obtained according to the characteristics of the antenna structure.The temperature measured by the sensor at the key positions is Tj,where j=1,2,…,M.M is the number of sensors at the key positions of the antenna structure.In this study,half of the error limit of the similarity match area was taken as the allowable error limit of the key match area.According to the collected temperature Tj,the error limit is calculated by
(2)Therefore,the key match area bjof the sensor number j is determined by

(3)The key matching area set of the collected temperature data set is expressed as

(4) The similarity match area set B is successively matched with the database temperature set,which is called from the initial match.The key matching rate f is obtained using Equation(10),where Gmis the number of key position sensors that are matched successfully,and GMis the total number of sensors at the key positions.f indicates the number of key position sensors that are successfully matched in a set of data matching,and it needs to be an exact match,that is,f=100%.

(5) If multiple sets of data in the final database meet the triple match criterion,the one with the highest similarity matching rate is selected as the successful matching set.If the data matching fails,the electrical performance compensation adjustment amount corresponding to the collected temperature data is calculated and stored in the database to enrich its data.
4.Example Verification
The proposed triple match method was verified through an engineering example of a 35 m aperture antenna.In this antenna project,184 sensors were utilized to measure temperature.The sensor layout is depicted in Figures 2 and 3.The collected temperature data are listed in Table 1.The unit of degrees is Celsius.Data nos.171–174 in Table 1 are the temperatures measured by the ambient temperature sensor.The symbol/indicates a damaged sensor.Based on the measured temperature data obtained in Table 1,the antenna temperature database was matched applying the triple match method,and the matched temperature data obtained are listed in Table 2.
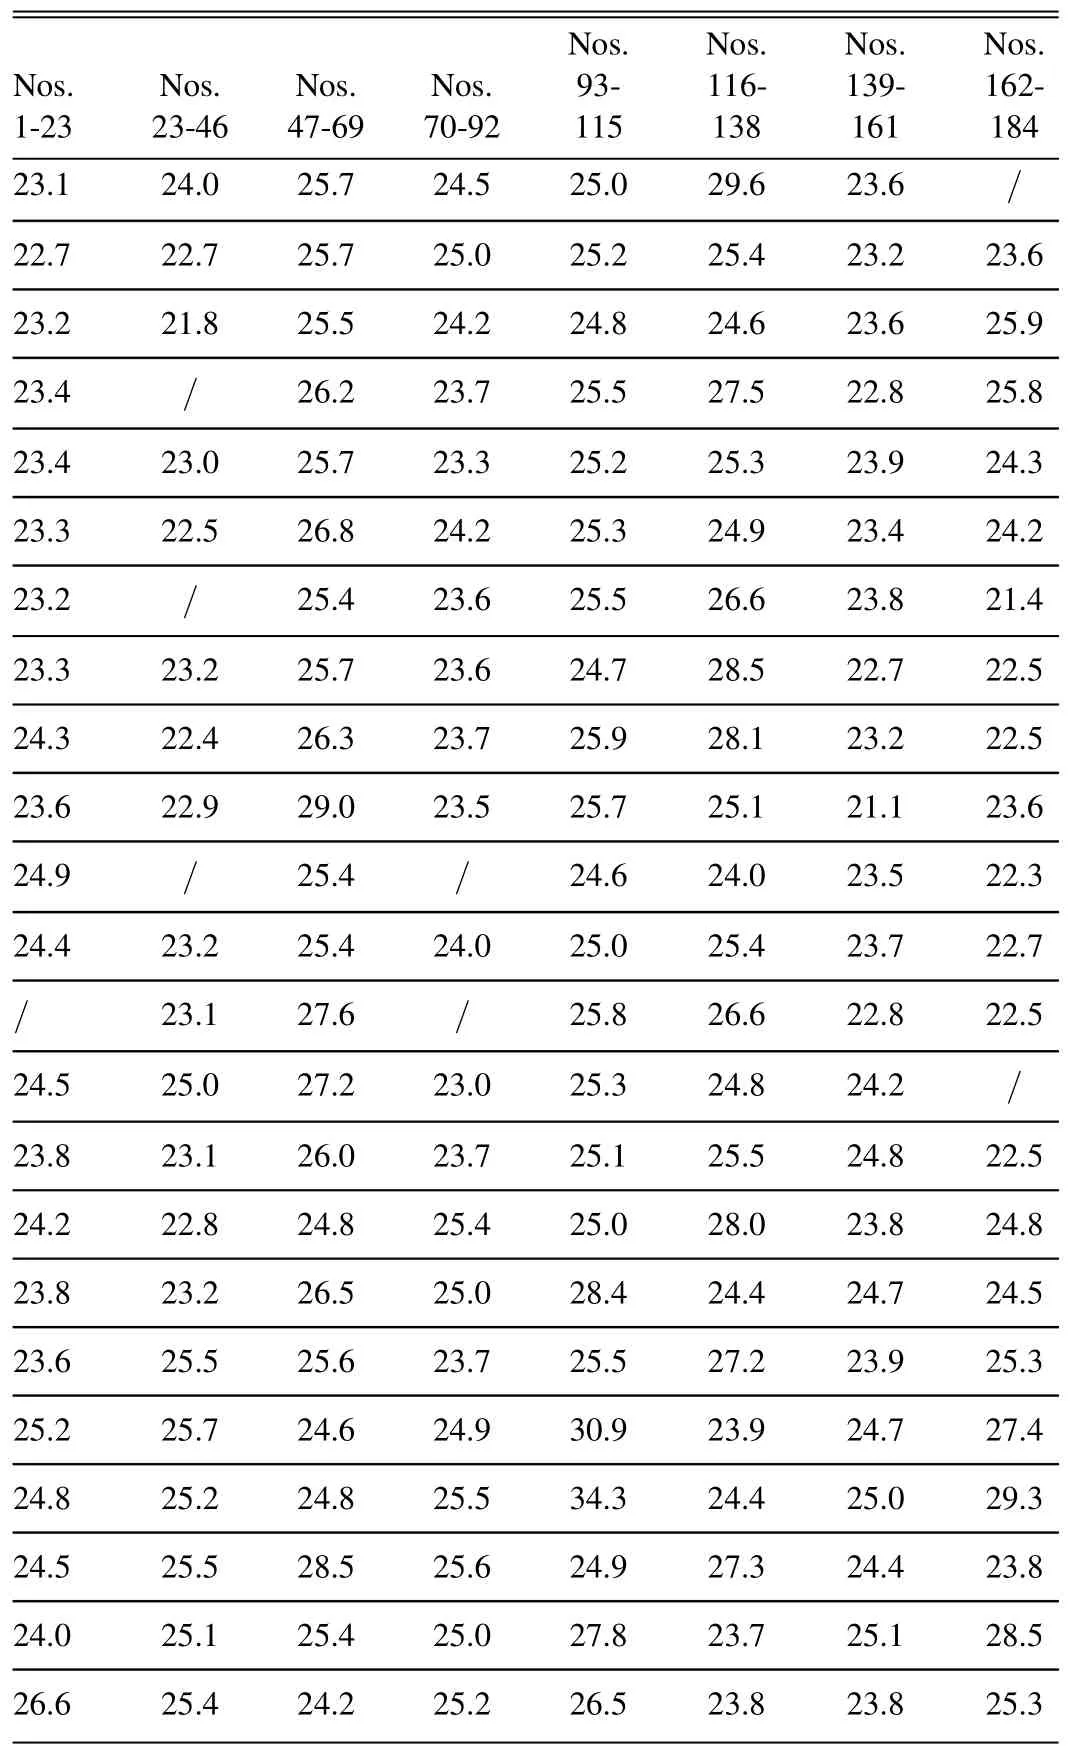
Table 1 Temperature Data Measured by Sensor (Unit:°C)
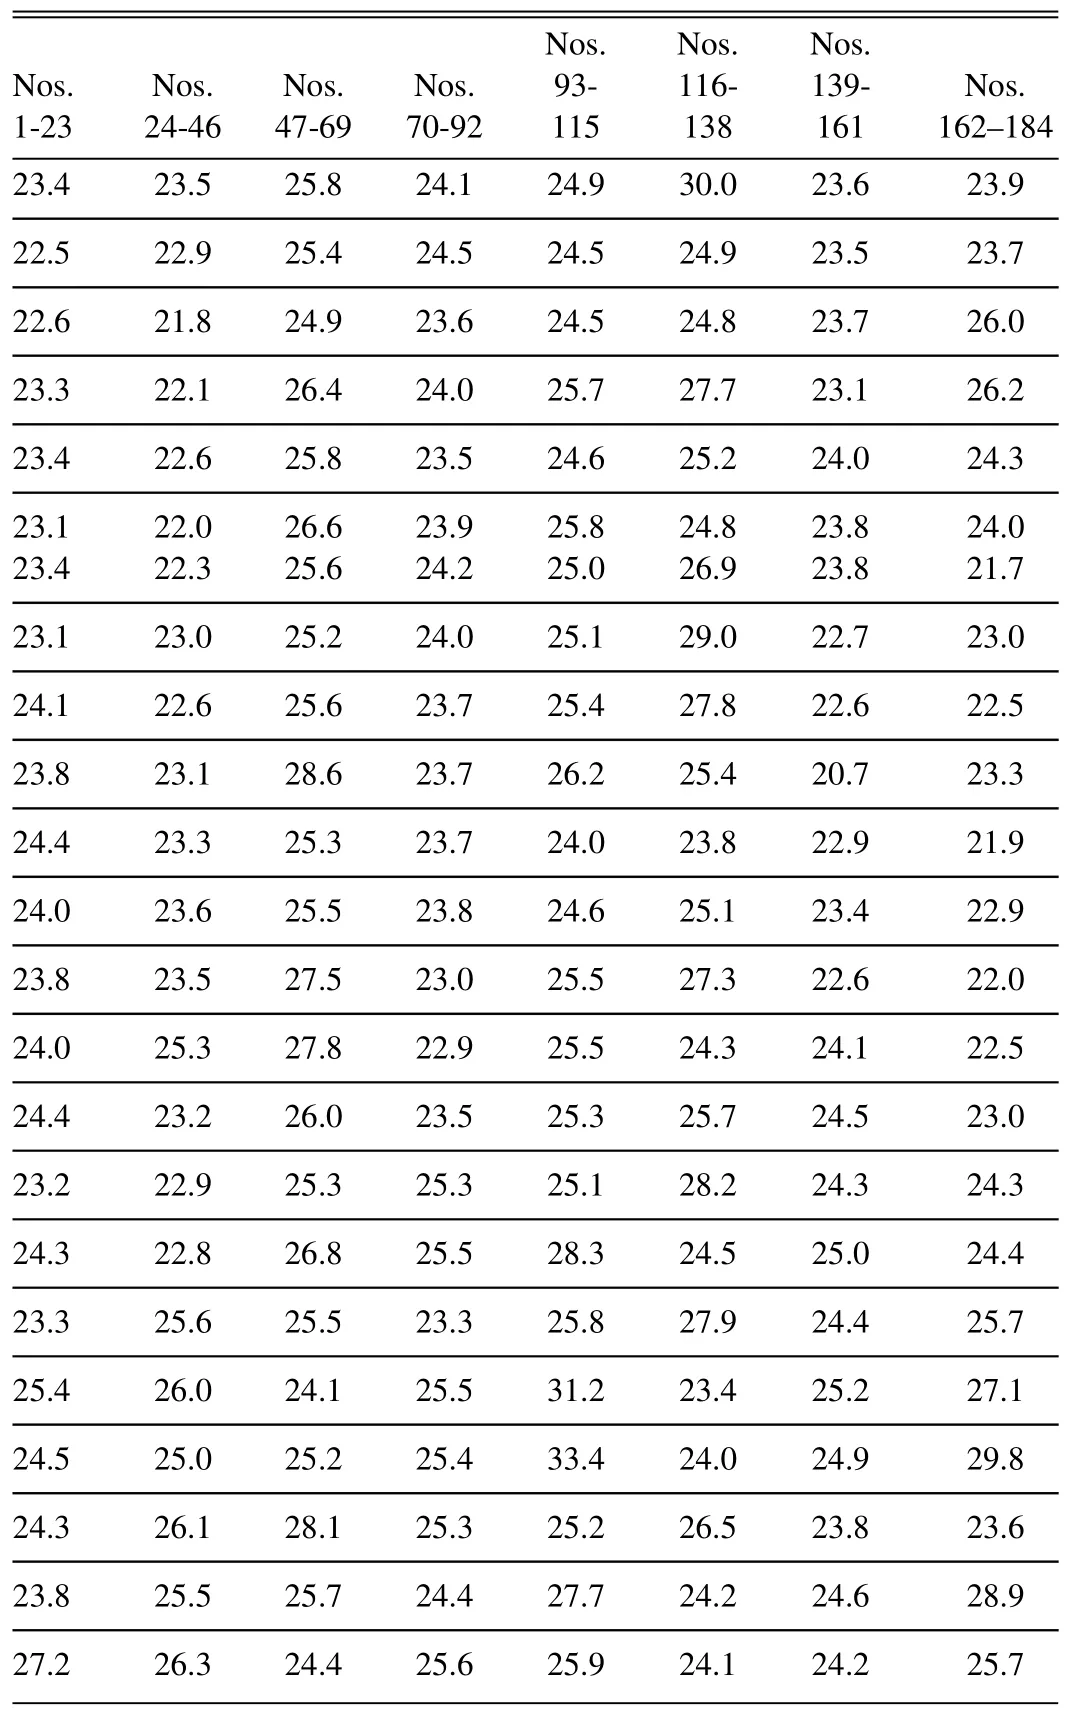
Table 2 Data after Triple Match (Unit:°C)
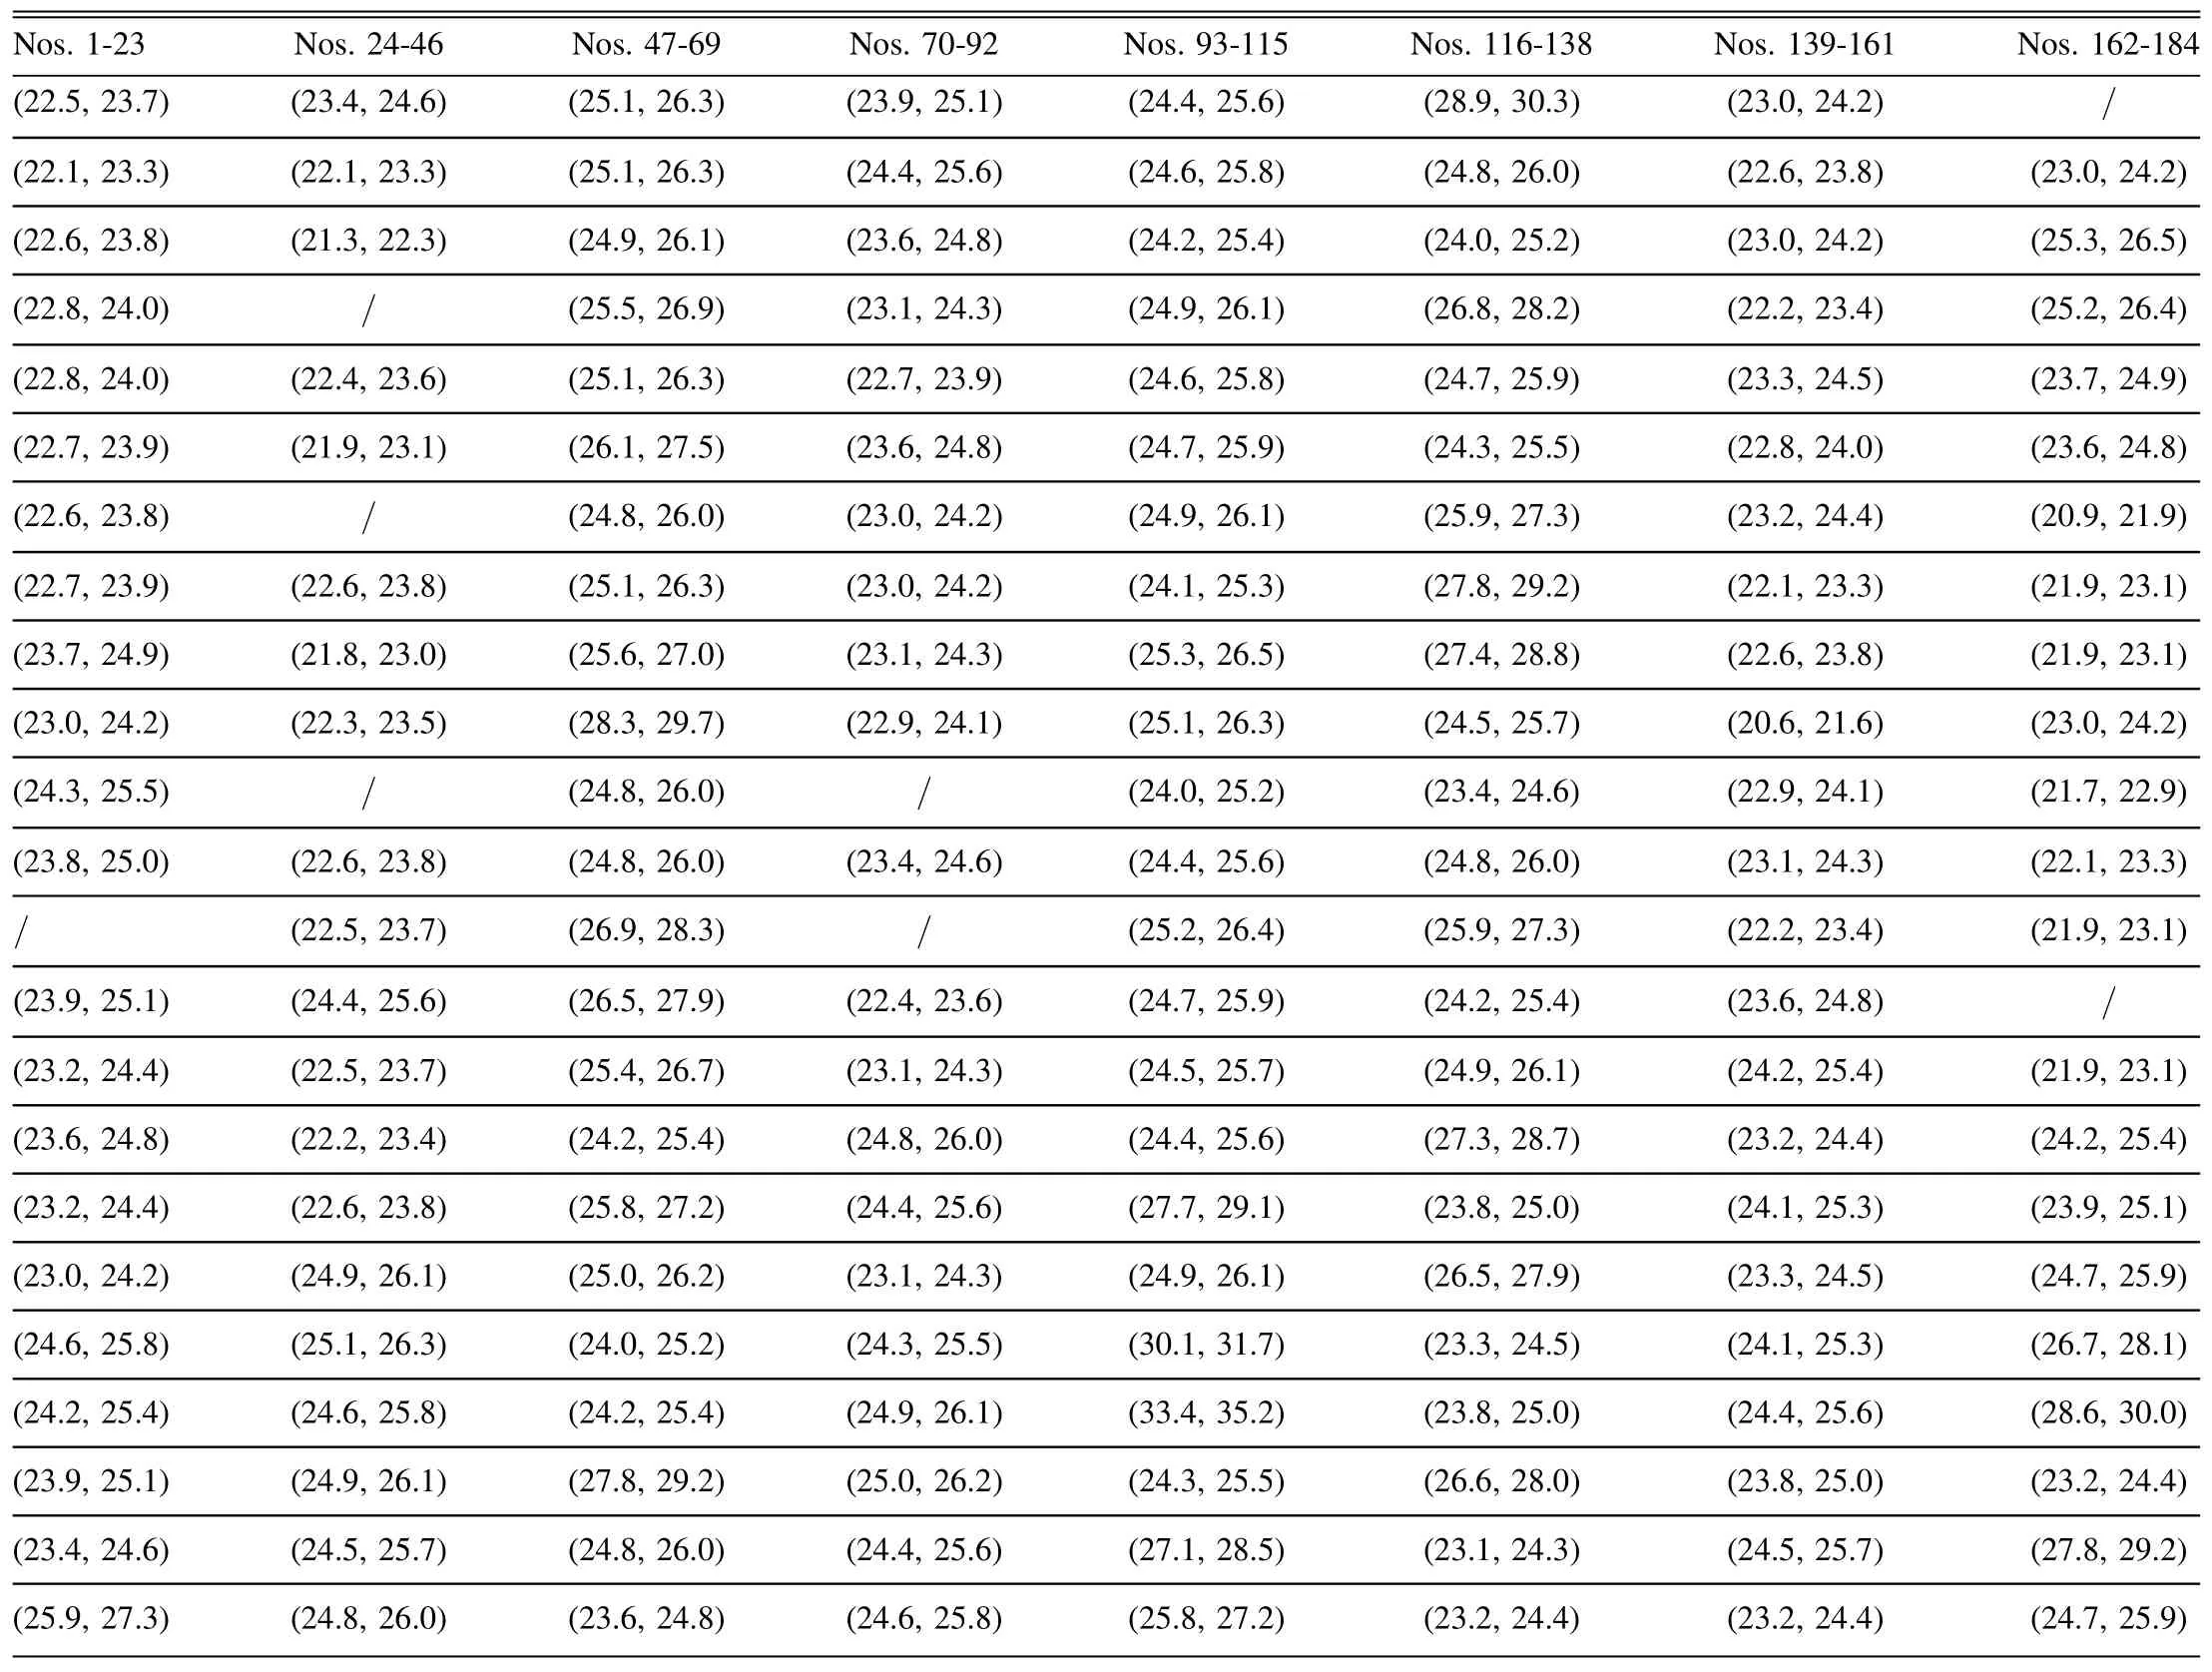
Table 3 Result Data of Similarity Area Match (Unit:°C)
Figure 4 displays a schematic of the matching results of the two data sets.The triple matching method was used to analyze the two data sets to verify the effectiveness of this method.
(1) rms error match of temperature data
We applied Equation (3) to calculate the rms error of the temperature data.The rms of the collected temperature data was 1.7189,and the rms of the matched temperature data was 1.7871.
We applied Equation(4)to calculate the relative error of the two data sets.γ=3.968%<5%.
(2) Similarity area match of temperature data
The similarity match area of the collected temperature of each sensor in the collected temperature data was calculated utilizing Equation(5).The similarity area matching results for sensors 1 to 184 are listed in Table 3.According to the data above,each data set of the match data set was compared with the similarity match area set of the collected temperature successively,and it was found that a total of five sets did not meet the match criterion.We applied Equation(7)to calculate the similarity matching rate P of the data set and P=97.3%>95%.Figure 5 features a schematic of the similarity matching of the two data sets.
(3) Key area match of temperature data
The sensor numbers of the eight key positions were nos.6,8,51,61,63,69,81 and 107.The measured temperature set was 23.3°C,23.3°C,25.7°C,26.0°C,26.5°C,24.2°C,24.0°C and 25.1°C.The matched temperature set was 23.1°C,23.1°C,25.8°C,26.0°C,26.8°C,24.4°C,23.8°C and 25.3°C.Equation (8) was used to calculate the key match area of the temperature measured by the key position sensors,which is shown in Table 4 from left to right according to the sensor numbers.

Table 4 Result Data of Key Match Area (Unit:°C)
Based on the data above,the matching data were successively compared with the key matching area set B of the measured temperature,and it was found that all eight sets of data were exactly matched.Figure 6 displays a schematic of the key matching process for the two sets of data.
The beam-pointing error in the gain pattern calculated from the two sets of temperature data was analyzed to verify the effect of the triple match and call method.After triple match,we get the matched temperature data set stored in the database that is closest to the collected temperature data set.The two sets of temperature data are loaded into the finite element model of the antenna,and the corresponding node displacement field on the surface of reflector can be obtained through finite element analysis.Then the electromechanical coupling model of the reflector antenna can be used to calculate the corresponding radiation patterns under the two sets of temperature data(Wang et al.2017).Figures 7 and 8 depict the comparison diagrams of the antenna pattern on the E-plane and H-plane of the two sets of data,respectively.
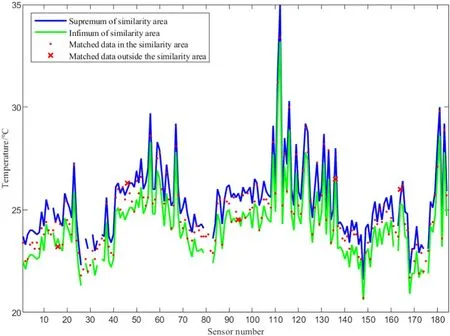
Figure 5.Schematic of similarity matching results.
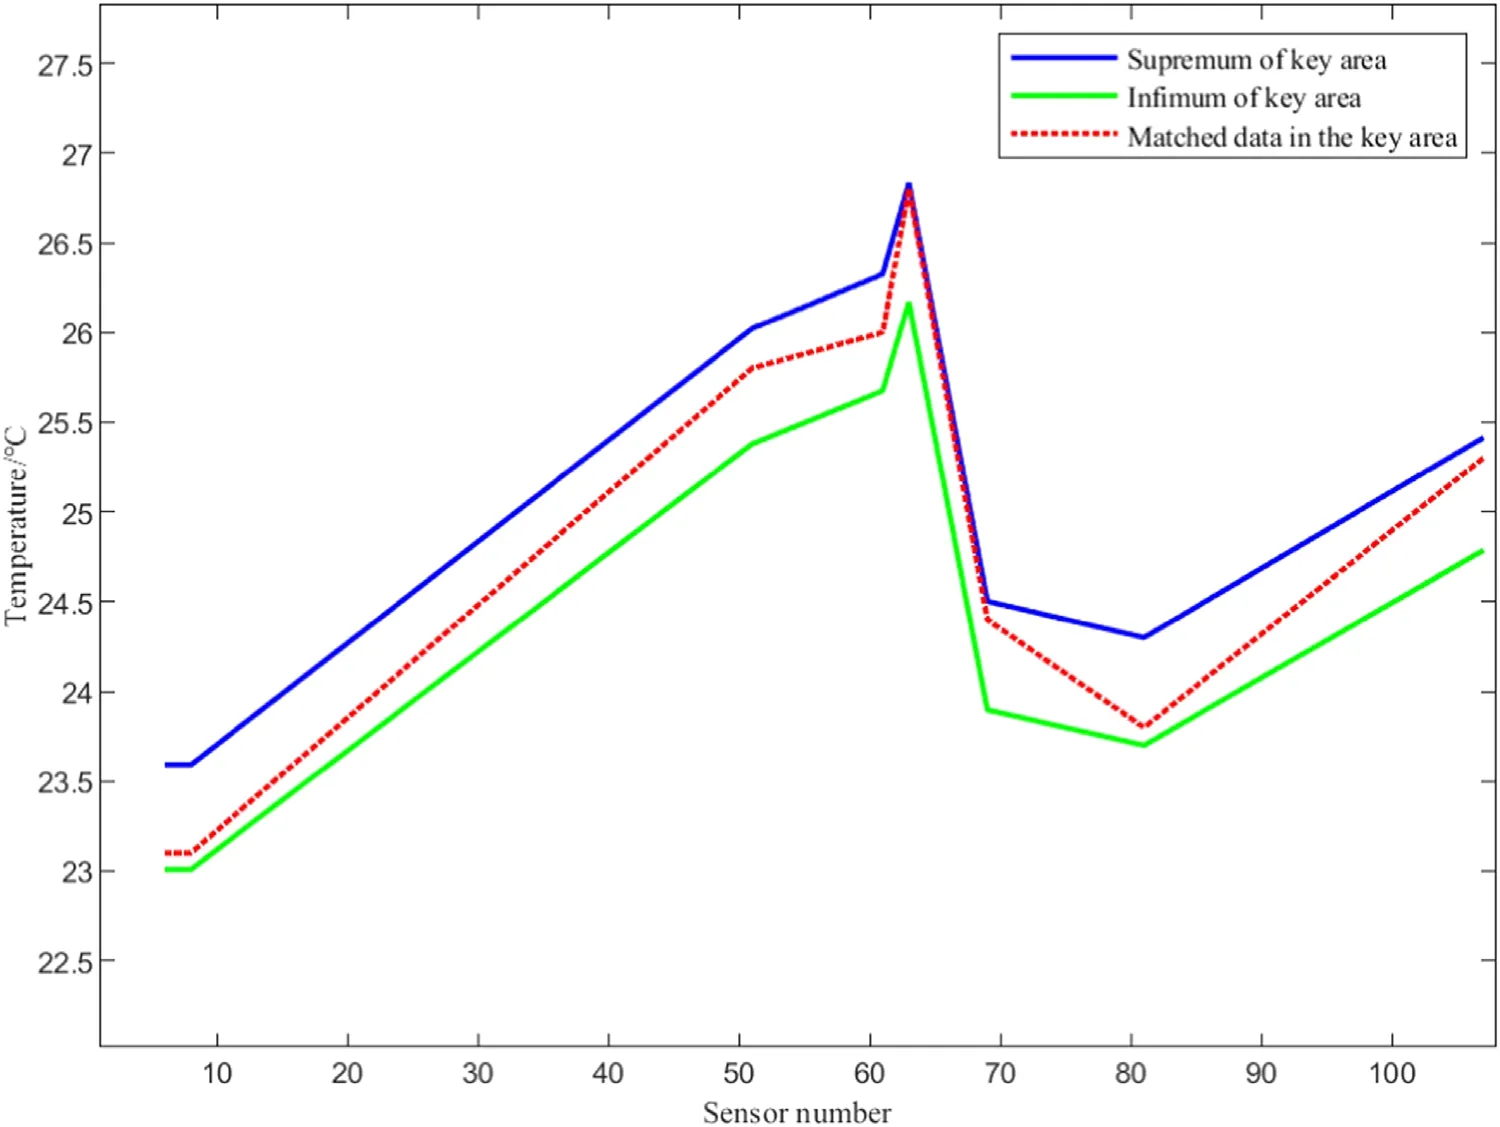
Figure 6.Schematic of key matching results.

Figure 7.Schematic of key matching results.
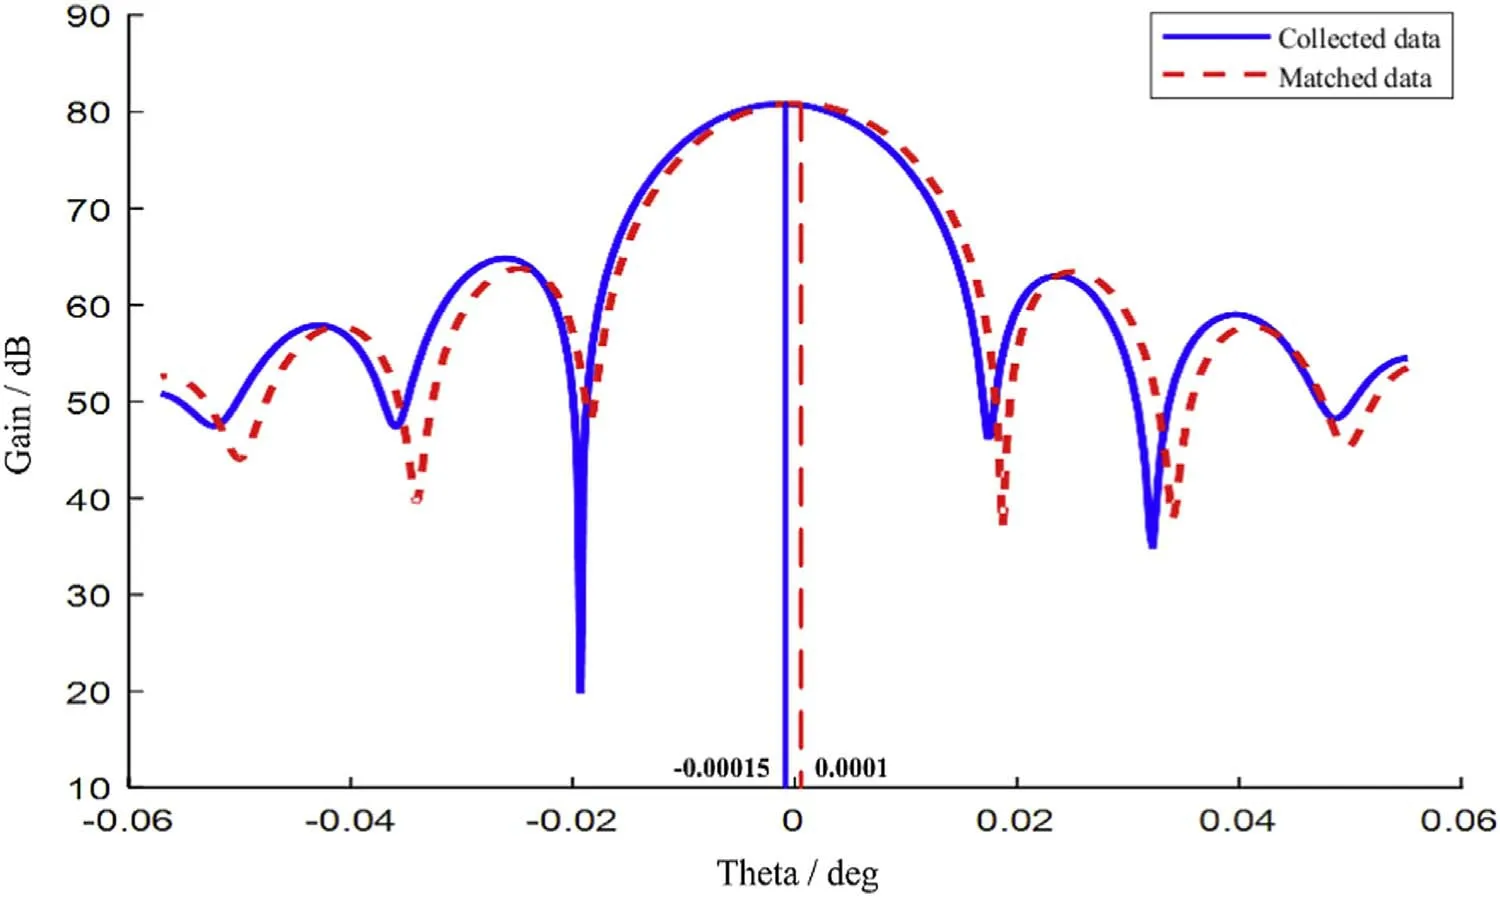
Figure 8.Schematic of key matching results.
Comparing the E-plane and H-plane gain patterns of the two sets of data,it can be found that the differences between the main lobe offsets of the E-plane and H-plane of the two data sets are 0.0004°and 0.000,25°,respectively.However,only the pointing offsets of the E-plane and H-plane cannot be directly used to guide the antenna pointing adjustment.It needs to be converted to adjustment amount of the antenna azimuth and pitch(Lian et al.2015).Let the current azimuth and pitch of the antenna be φ0and θ0respectively.Then the relationship between the point Plocalof the antenna in the local coordinate system (the coordinate system where the E-plane and H-plane are located) and the point Pglobalof the global coordinate system can be expressed as

Then after using the conversion relationship from the Cartesian coordinate system to the polar coordinate system,the azimuth angleand the pitch angleafter deformation in the global coordinate system can be obtained.The azimuth and pitch adjustment of the antenna can be expressed as

Table 5 shows the pointing adjustment data calculated from the two sets of data.
In this project,the minimum adjustment scale of the antenna wasAs displayed in Table 5,the final pointing adjustment amount calculated from the matching data and the collected data are both less than 1″,which meets the criterion in the practical project.This further demonstrates the effectiveness of the proposed database match and call method.

Table 5 Pointing Adjustment Data of Collected Temperature Data and Matching DataAdjustment
5.Discussion
A method of triple matching and calling of the thermal compensation database of the reflector antenna is proposed in this study.This method can guarantee the accuracy of the real-time compensation of the reflector antenna thermal compensation system in practical engineering.The proposed triple match and call method analyzes the degree of dispersion of the two data sets through the rms match of temperature data.Then,the overall similarity of the data was ensured through similarity area matching analysis.Finally,the complete match of key positions in the structure is guaranteed through a key area match analysis.The collected data samples were matched from the previous three aspects.The triple match and call method was verified using data charts through the analysis of an example,which further demonstrates the effectiveness of the proposed method.Finally,the patterns calculated by the collected data and the matched data were compared,and the beam-pointing adjustment error was found to be within an appropriate range,which met the requirements of accurate database calling and real-time antenna compensation.
Acknowledgments
This work was supported by the National Key Research and Development Program of China (2021YFC2203600),National Natural Science Foundation of China (Grant Nos.51975447 and 52005377) and Youth Innovation Team of Shaanxi Universities under No.201926.
 Research in Astronomy and Astrophysics2022年5期
- Research in Astronomy and Astrophysics的其它文章
- Discovery of Extended Structure Around Open Cluster COIN-Gaia 13 Based on Gaia EDR3
- Constraining Brans-Dicke Cosmology with the CSST Galaxy Clustering Spectroscopic Survey
- The First Photometric Study of AH Mic Contact Binary System
- Detections of Gamma-Rays from Globular Clusters ESO 452-SC11,NGC 6380,Palomar 6 and UKS 1 with Fermi-LAT
- Crust Cooling of Soft X-Ray Transients-the Uncertainties of Shallow Heating
- Quasi-periodic Oscillation Analysis for the BL Lacertae Object 1823+568
