Effects of TiO2 in Pd-TiO2/C for glycerol oxidation in a direct alkaline fuel cell
Viviane Santos Pereira,Júlio Nandenha,Andrezza Ramos,Almir Oliveira Neto
(Instituto de Pesquisas Energéticas e Nucleares-IPEN-CNEN/SP Centro de Células a Combustível e Hidrogênio-CECCO ,Cidade Universitária, São Paulo-SP 05508-000, Brasil)
Abstract: The Pd-TiO2 electrocatalysts were synthesized via sodium borohydride reduction and characterized by X-ray diffraction (XRD), transmission electron microscopy (TEM), cyclic voltammetry, chronoamperometry and attenuated total reflectance-Fourier transform infrared (ATR-FTIR). The X-ray diffraction experiments of the Pd-TiO2 showed peaks associated with Pd face-centered cubic (fcc) structure and peaks characteristics of TiO2 (anatase phase) with a tetragonal structure. The TEM images showed that the Pd and TiO2 nanoparticles were well distributed in the carbon support showing some clustered regions with nanoparticle sizes between 7 and 8 nm. Cyclic voltammograms showed an increase in current density values after the glycerol adsorption process. Experiments in alkaline direct glycerol fuel cells at 60 °C showed a higher power density for Pd-TiO2/C (70∶30) in comparison to the commercial Pd/C electrocatalyst indicating that the use of the TiO2 co-catalyst with Pd nanoparticles had a beneficial behavior. This effect can be attributed to the electronic effect or to the bifunctional mechanism. Molecules with high-value added glyceraldehyde, hydroxypyruvate and formate were identified as electrochemical reaction products of glycerol on all prepared electrocatalysts.
Key words:glycerol oxidation;Pd-TiO2 electrocatalysts;in-situ ATR-FTIR;cyclic voltammetry;alkaline fuel cell
Direct alcohol fuel cells (DAFCs) have a high energy density and are easy to handle when compared to PEMFC cells that use hydrogen (H2) as fuel. In this context, cells (DAFCs) are considered potential alternative energy sources with the possibility of application in portable equipment and electronic devices, in addition to the possible production of products with high added value[1,2].
Glycerol fuel applied to an Alkaline Direct Glycerol Fuel Cell (ADGFC) is very attractive because it has a high energy density with a theoretical value close to 6.4 kW·h/L, it is not toxic, and is a nonflammable liquid and of low cost. It presents advantages regarding its application and use in a direct alcohol fuel cell due to the reduction of environmental impacts and the possibility of conversion into highvalue added products[3]. The main challenge of this fuel for commercialization in ADFC lies in the kinetics of the glycerol oxidation reaction, that is, the breaking the C−C bonds and completing the oxidation to CO2[4,5].
Pt and Pd nanoparticles are commonly used as primary electrocatalysts in the anode of one ADGFC due to Pt-based electrocatalysts has a chemical stability and high catalytic activity, but it is considered a rare material in the nature and of high cost, in addition to suffering CO poisoning. The decrease in the activities of electrocatalysts during the oxidation reaction is evidenced by the formation of intense adsorbed intermediates on its surface[6]. Electrocatalysts based on Pd nanoparticles in alkaline medium for alcohol oxidation have been shown good results, these electrocatalysts also showed resistance to poisoning by intermediates adsorbed (CO) on the Pd surface.However, their contribution becomes limiting and dependent on factors such as support material,morphology and distribution[7,8].
However, the performance of Pd increase also when combined with other metals such as Ru[9], Ni[10],Au[11], Ag[12], In[13]and Co[14]in the form of alloys,deposits or anchors. In this context, new studies with materials for the synthesis of cheaper and more efficient electrocatalysts that help to improve reaction kinetics in a direct glycerol fuel cell have been developed.
The combination of Pd with titanium dioxide(TiO2) was studied in this work to investigate the catalytic activity and the possible production of products with high added value in the oxidation of glycerol fuel. Titanium dioxide is attractive to be used in the composition of an electrocatalyst because it has resistance to corrosion and tolerance to intermediates formed in the reaction, such as carbon monoxide (CO).TiO2can be used as a doping material on carbon support or as a co-catalyst[15−18]. Silva et al.[16]synthesized Pd/TiO2-C electrocatalysts for ethanol oxidation in an alkaline medium and showed good results due to the formation of OH species from TiO2,facilitating the oxidation of ethanol fuel, and also observed the change in thedband of Pd in this material due to the strong interaction between metal and support.
Han et al.[17]prepared the TiO2-Au/C electrocatalyst for glycerol oxidation in an alkaline medium, and they observed an improvement in the catalytic activity as well as a change in the glycerol reaction pathway due to TiO2-Au interfaces formed during the preparation, attributing the increase of catalytic performance to TiO2by facilitating oxidation on the Au surface. Souza et al.[18]investigated the combination Pd-TiO2/C (50∶50) for methane activation in an acidic medium, observing the formation of high added value products such as methanol. They attributed the improvement in catalytic activity and stability of the materials to the presence of TiO2. The presence of TiO2also favors the adsorption of some intermediates for the methane oxidation reaction on the Pd surface,thus increasing the catalytic performance of the prepared electrocatalysts.
In this work we present a study that aims to contribute to the understanding of the use of Pd-TiO2/C electrocatalysts with different atomic compositions(50∶50, 70∶30 and 90∶10) supported with Carbon Vulcan XC72®used in the oxidation of glycerol fuel.
1 Synthesis, characterization and experiments
1.1 Preparation of electrocatalysts
Pd/C, TiO2/C and Pd-TiO2/C (50∶50, 70∶30 and 90∶10) electrocatalysts were prepared by the sodium borohydride reduction method[18,19]. The metal salt Pd(NO3)2-2H2O (Aldrich) and (TiO2-(Aldrich) were used as metallic precursors, (NaBH4-(Aldrich) as a reducing agent and Carbon Vulcan XC72®(Cabot,Corp. USA) was used as support[18]. Initially, the ions metallic were dissolved in a mixture of water with 2-propanol (50:50 volume ratio), and the Carbon Vulcan XC72®support was added in the solution. The resulting mixture was submitted to an ultrasonic probe sonicator for 10 min for homogenization. After this step,(NaBH4:metal molar ratio equal to 5∶1 was added in one step under magnetic stirring for 1 h at room temperature to reduction of metallic salts. Finally, the resulting mixtures were filtered, and the solids(electrocatalysts) washed with ultrapure water and dried at 70 °C for 2 h.
1.2 Electrocatalysts characterization
1.2.1 Energy-dispersive X-ray spectroscopy (EDX)
The energy-dispersive X-ray spectroscopy analyzes were performed in an equipment containing a scanning electron microscope (SEM), with a 20 keV electron beam, model Philips XL30 equipped with an EDAX microanalyzer, model DX-4 was used for analysis. Samples were prepared with a small amount of powdered electrocatalyst over a sticky paint on the detection support. The data collected correspond to an average of four random points in each sample to obtain the real atomic compositions[20].
1.2.2 X-ray diffraction (XRD)
X-ray diffraction analyses were performed in a conventional diffractometer, (Rigaku, model Miniflex II) with a CuKα radiation source (λ= 0.15406 nm).The diffractograms were obtained in the range scanning angle 2θfrom 20° to 90° with a step size of 0.05° and scan time of 2 s per step[18]. To carry out these experiments, a small amount of electrocatalyst powder was compacted in a glass support with the aid of silicone grease, which was introduced into the diffractometer[21].
1.2.3 Transmission electron microscopy (TEM)
Transmission electron microscopy analyses were performed to estimate morphology and nanoparticles distribution of the electrocatalysts on the carbon support, using JEOL transmission electron microscopy(JEM-2100) operated at 200 kV[20,21]. The samples were prepared from the suspension of the electrocatalyst in isopropyl alcohol, undergoing homogenization in an ultrasound system. Subsequently, an aliquot of the sample was placed on a copper grid of 0.3 cm diameter containing a carbon film. Mean nanoparticle sizes were digitally measured by counting about 150 nanoparticles in different regions of each sample to construct nanoparticle distribution histogram and calculate mean nanoparticle size.
1.2.4 Cyclic voltammetry (CV) and chronoamperometry (CA)
Cyclic voltammetry and chronoamperometry measurements were performed at room temperature using a potentiostat/galvanostat (Autolab PGSTAT 302N, Metrohm). These studies were carried out using working electrodes (geometric area of 0.0707 cm2)prepared by the ultra-thin porous coating technique, the reference electrode was an Ag/AgCl (3.0 mol/L KCl)and the counter electrode was a Pt plate. The electrochemical measurements were performed in the presence of 1.0 mol/L KOH or 1.0 mol/L glycerol in 1.0 mol/L of KOH solutions saturated with N2. The cyclic voltammetry experiments were done at a scan rate of 10 mV/s for the potential range from −0.85 to 0.2 V versus Ag/AgCl[22]. The chronoamperometry analyses were carried out keeping the same setup of cyclic voltammetry using 1.0 mol/L glycerol in 1.0 mol/L KOH solution at −0.35 V versus Ag/AgCl for 1800 s[22].
1.2.5 Attenuated total reflection-Fourier transform infrared (ATR-FTIR)
The ATR-FT-IR measurements were performed on a Nicolet®6700 FT-IR spectrometer equipped with an MCT detector cooled with liquid N2, ATR accessory(MIRacle with a ZnSe Crystal Plate Pike®) installed is coupled to the spectrometer, to identify the products formed during the electrochemical oxidation of glycerol in alkaline medium in different potentials.
1.2.6 Alkaline direct glycerol fuel cell test
Alkaline Direct Glycerol Fuel Cell Tests were carried out using Pd/C, TiO2and Pd-TiO2/C electrocatalysts as anodes and Pt/C electrocatalysts as cathodes in a single fuel cell with an area of 5 cm−2. For Alkaline direct glycerol fuel cell studies it was used the carbon-cloth treated with Teflon and with the presence of Carbon Vulcan XC72®as a gas diffusion layer, and a Nafion®117 membrane as electrolyte. The electrodes(anode and cathode) were hot pressed on both sides of a Nafion®117 membrane at 125 °C for 10 min under a pressure of 225 kgf/cm2[23]. The prepared electrodes contain Pd 1 mg/cm2at the anode and Pt 1 mg/cm2at the cathode. The temperature was set to 60 °C for the fuel cell and 85 °C for the oxygen humidifier. 2 mol/L glycerol in 2 mol/L KOH aqueous solution was delivered at 1 mL/min, and the oxygen flow was regulated to 150 mL/min[5]. Polarization curves were obtained using a potentiostat/galvanostat (Autolab, model PGSTAT 302 N).
2 Results and discussion
The results of the nominal atomic ratios and atomic ratios obtained by EDX for the synthesized Pd-TiO2/C (50∶50, 70∶30 and 90∶10) electrocatalysts are presented in Table 1.
For Pd-TiO2/C binary electrocatalysts synthesized with different atomic proportions, the EDX analyses revealed that the atomic ratios (Pd:TiO2) obtained were similar to the nominal atomic ratios (Table 1),therefore, these results indicated that the sodium borohydride reduction method is efficient for the production of the proposed electrocatalysts.

Table 1 Nominal atomic ratios and atomic ratios obtained by EDX of the Pd-TiO2/C (50∶50, 70∶30 and 90∶10)electrocatalysts synthesized by the sodium borohydride reduction method
The X-ray diffractograms of the as-synthesized electrocatalysts are shown in the Figure 1. All diffractograms, showed the presence of a peak centered at about 2θ≈ 24° associated with the (004) plane of the carbon support. The Pd/C and Pd-TiO2/C electrocatalysts also presented four peaks at about 2θ≈ 40°, 47°, 68°and 82° associated, respectively, to the (111), (200),(220) and (311) planes of face-centered cubic (fcc)structure of Pd or Pd alloys (JCPDF#89-4897)[20,24−26].Pd-TiO2/C and TiO2showed peaks at approximately 2θ≈ 25°, 37°, 38°, 39°, 48°, 54°, 69° and 70°, associated with (101), (103), (004), (112), (200), (105), (116) and(220) crystalline planes of the tetragonal structure(JCPDF#2-387)[20,24], which were characteristics of titanium oxide (TiO2-anatase phase) as already evidenced by Silva et al. and De Souza et al.[16,18].
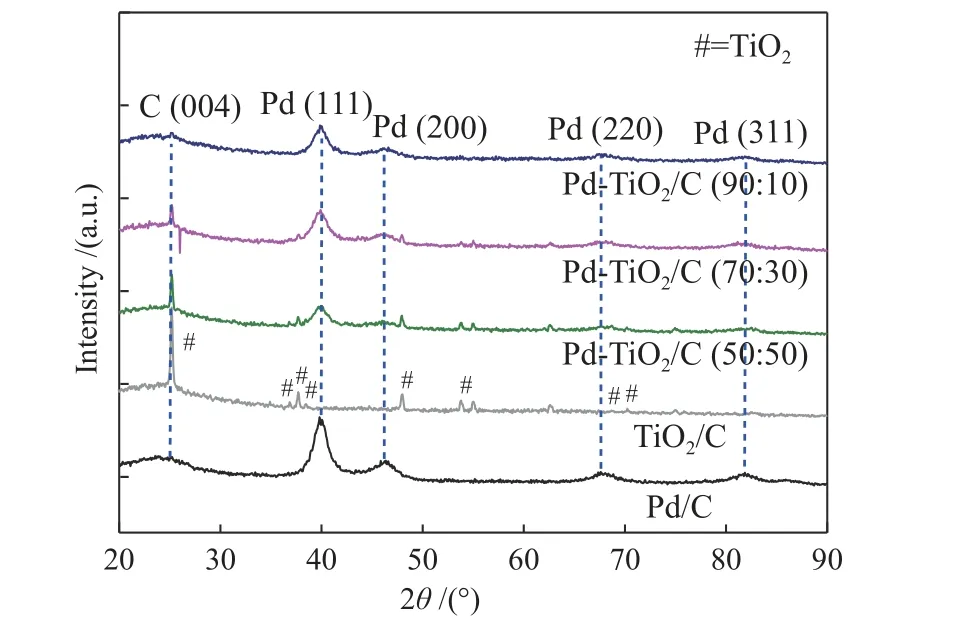
Figure 1 X-ray diffractograms of the Pd/C, TiO2/C, Pd-TiO2/C(50∶50, 70∶30 and 90∶10) electrocatalysts synthesized by the sodium borohydride reduction method
The mean crystallite sizes of the studied electrocatalysts were from 2.0 to 4.3 nm. As seen in Figure 1, the results did not show peak detachment for smaller or larger angles, indicating that there was no formation of metallic alloys in the composition of the synthesized electrocatalysts. The micrographs obtained by transmission electron microscopy analysis and its histograms are shown in Figure 2.
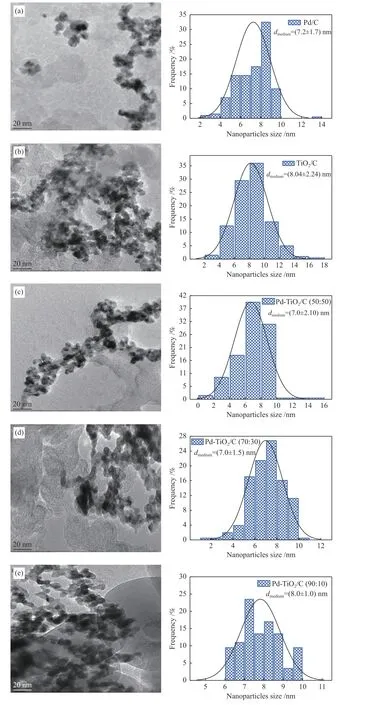
Figure 2 Micrographs and the size distribution of nanoparticles obtained by transmission electron microscopy: (a) Pd/C, (b) TiO2/C,(c) Pd-TiO2/C (50∶50), (d) Pd-TiO2/C (70∶30), (e) Pd-TiO2/C (90∶10)
The Pd/C and TiO2/C electrocatalysts had mean nanoparticle sizes of 7.2 and 8.0 nm and standard deviations of 1.7 and 2.2 nm. The Pd-TiO2/C (50∶50),Pd-TiO2/C (70∶30) and Pd-TiO2/C (90∶10) binary electrocatalysts, presented mean nanoparticle sizes of 7.0, 7.0 and 8.0 nm, respectively, with standard deviations of 2.1, 1.5 and 1.0 nm. All micrographs obtained showed some agglomeration regions of the nanoparticles on the carbon support.
All electrocatalysts studied by electrochemical measurements were normalized by milligram of palladium (Pd) considering that the adsorption/desorption process of the studied fuels is directly related to the palladium (Pd) sites at room temperature.The cyclic voltammograms were made in the absence of glycerol (Figure 3). The cyclic voltammograms of Pd/C, Pd-TiO2/C (50∶50, 70∶30 and 90∶10) exhibited a well-defined hydrogen adsorption/desorption region at(−0.85 to −0.5 V), (Figure 3). In these experiments a shift of the peak position to more negative potentials at about−0.7 V in the adsorption/desorption region (anodic scanning) of hydrogen for Pd-TiO2/C (50∶50) can also be observed when compared to the Pd/C, Pd-TiO2/C(70∶30) and Pd-TiO2/C (90∶10) electrocatalysts,indicating a possible electronic modification of palladium atoms by the neighboring titanium dioxide atoms. Han et al.[15]prepared the TiO2-Ni composition for glycerol oxidation. Cyclic voltammetry studies showed the presence of hydroxyl formation peaks on the material surface, originating from TiO2electron orbitals.

Figure 3 Cyclic voltammograms of Pd/C, TiO2/C, Pd-TiO2/C(50∶50, 70∶30 and 90∶10) electrocatalysts in a 1 mol/L KOH solution at room temperature at a scan rate of 10 mV/s
In Figure 3, an increase in the current values in the electric double layer at about −0.5 to 0.0 V was observed in the Pd-TiO2/C (50∶50) and Pd-TiO2/C(70∶30) binary electrocatalysts in comparison with Pd/C, indicating the formation of Pd oxides in the anodic scan, possibly due to a greater amount of adsorbed oxygen species (OHads)[23]. Grdén et al.[27]reported that the choice of material composition for the formation of an electrocatalyst can lead to an increase in adsorbed oxygen species on its surface, playing a decisive role in the hydrogen adsorption/desorption process.
In Figure 4, the onset of glycerol oxidation was observed at more negative potentials (−0.4 V) for Pd-TiO2/C (70∶30) with a higher current value with oxidation peak at 14.91 mA/cm2when compared to Pd-TiO2/C (50∶50) and Pd-TiO2/C (90∶10) binary electrocatalysts, which had oxidation onset at less negative potentials at −0.36 V with oxidation peaks at 9.37 and 4.88 mA/cm2, respectively. The Pd/C and TiO2/C electrocatalysts started the glycerol oxidation at about −0.2 V with oxidation peaks at around 1.08 and 0.55 mA/cm2respectively (Figure 4). Geraldes et al.[5]investigated the electrochemical oxidation of glycerol in alkaline electrolyte using the PdAu/C, PdSn/C and PdAuSn/C electrocatalysts, and obtained good results,in which its performance was attributed to the bifunctional mechanism, where Au and Sn provide OHspecies favoring the oxidation of intermediates adsorbed on the Pd surface.
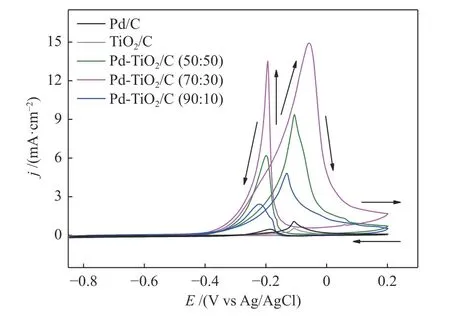
Figure 4 Cyclic voltammograms of glycerol electro-oxidation on Pd/C, TiO2, Pd-TiO2/C (50∶50, 70∶30 and 90∶10)electrocatalysts using 1.0 mol/L glycerol in 1.0 mol/L KOH electrolyte at room temperature with a scan rate of 10 mV/s
Ottoni et al.[23]studied the Pd/C, Pd/ITO and Pd/CITO combinations in the oxidation of glycerol in an alkaline medium and highlighted the Pd/C-ITO material that presented the best electrocatalytic performance in relation to the Pd/C that obtained inferior performance. The authors associated the best results with the bifunctional mechanism and electronic effect.
In the present work it was possible to notice that the metallic material Pd and TiO2when acting alone in the oxidation of glycerol do not present high current values, the opposite was observed when combined in different atomic ratios and this response could be attributed to synergy between the materials as well as to events such as the bifunctional mechanism or electronic effect.
The superior catalytic activity of Pd-TiO2/C(70:30) electrocatalyst (Figure 4) could be attributed to the smaller mean nanoparticle sizes as observed in the transmission electron microscopy (TEM) images, as the primary factor for the catalytic activities of reactions in an electrocatalyst take place on its surface,so the smaller nanoparticle size can significantly increase the catalytic activity process. Yanya et al.[4]described that the smaller size of PdAu nanoparticles for glycerol oxidation in an alkaline medium contributed to the improvement of its electrocatalytic activity. The chronoamperometries obtained are shown in Figure 5.

Figure 5 Current versus time curves at −0.35 V in a 1.0 mol/L KOH solution in the presence of 1.0 mol/L glycerol for Pd/C,TiO2, Pd-TiO2/C (50∶50, 70∶30 and 90∶10) electrocatalysts at room temperature at a scan rate of 10 mV/s
The current values obtained for Pd-TiO2/C(50∶50) and Pd-TiO2/C (70∶30) electrocatalysts were highest being almost twice higher than those of standard Pd/C and TiO2/C (Figure 5). For the Pd-TiO2/C (70∶30) electrocatalyst there is a slight decay over time compared to Pd-TiO2/C (50∶50). This behavior might be associated with the presence of adsorbed intermediates on the surface of this electrocatalyst in the glycerol oxidation process, as already observed in the literature[14,28]. However, the Pd-TiO2/C (70∶30) and Pd-TiO2/C (50∶50) compositions tend to remain active indicating that these stipulated atomic compositions were the most appropriate for the oxidation of glycerol as they presented lower potentials at the beginning of the glycerol oxidation process and higher current values, as seen in Figure 4 and Figure 5.
In Figure 6, the Pd-TiO2/C (50∶50, 70∶30 and 90∶10) electrocatalysts presented open-circuit voltage(OCV) values in 798, 817, 875 mV, respectively,whereas the Pd/C and TiO2/C electrocatalysts presented the OCV values of 674 and 713 mV (Figure 6A-(I)).The maximum power density values were 12.4, 12.5 and 7.9 mW/cm2for the Pd-TiO2/C electrocatalysts(50∶50, 70∶30 and 90∶10), 3.70 and 2,25 mW/cm2for the Pd/C and TiO2/C electrocatalysts, respectively(Figure 6A-(I)).

Figure 6 Polarization (A-(I)) curves and power density (A-(II))in a 5 cm2 alkaline direct glycerol fuel cell (ADGFC) at 60 °C,using Pd/C, TiO2/C and Pd-TiO2/C electrocatalysts with different atomic proportions fed with 2.0 mol/L glycerol in a 2.0 mol/L KOH solution and oxygen flux was set to 150 mL min at 85 °C
The Pd-TiO2/C (70∶30) combination obtained the best maximum power density activity and open-circuit voltage value, confirming the performance observed in the cyclic voltammetry and chronoamperometry experiments (Figure 4 and Figure 5), probably due to the higher formation of oxygenated species for the oxidation of COadson the Pd surface[23]. Lower values of maximum power density and open-circuit voltage were observed for Pd/C, TiO2/C when compared to PdTiO2/C (50∶50, 70∶30 and 90∶10), possibly due to resistivities of its electrodes that can hinder glycerol diffusion through the catalytic layer. Han et al.[17]studied the Au-TiO2combination and reported that the improvement of the catalytic system might be associated with the role of TiO2in facilitating the glycerol oxidation on the gold surface. This response was also observed in this work.
The ART-FTIR spectra of Pd/C, TiO2/C, Pd-TiO2/C (50∶50, 70∶30 and 90∶10) are shown in Figure 7 and the interpretation of the absorption bands for each molecule formed from the partial glycerol electrooxidation reaction was based on the comparison between standard FT-IR by considering the authors Winiwarter et al.[29]and the works of Gomes et al.[30]and Zalineeva et al.[31].
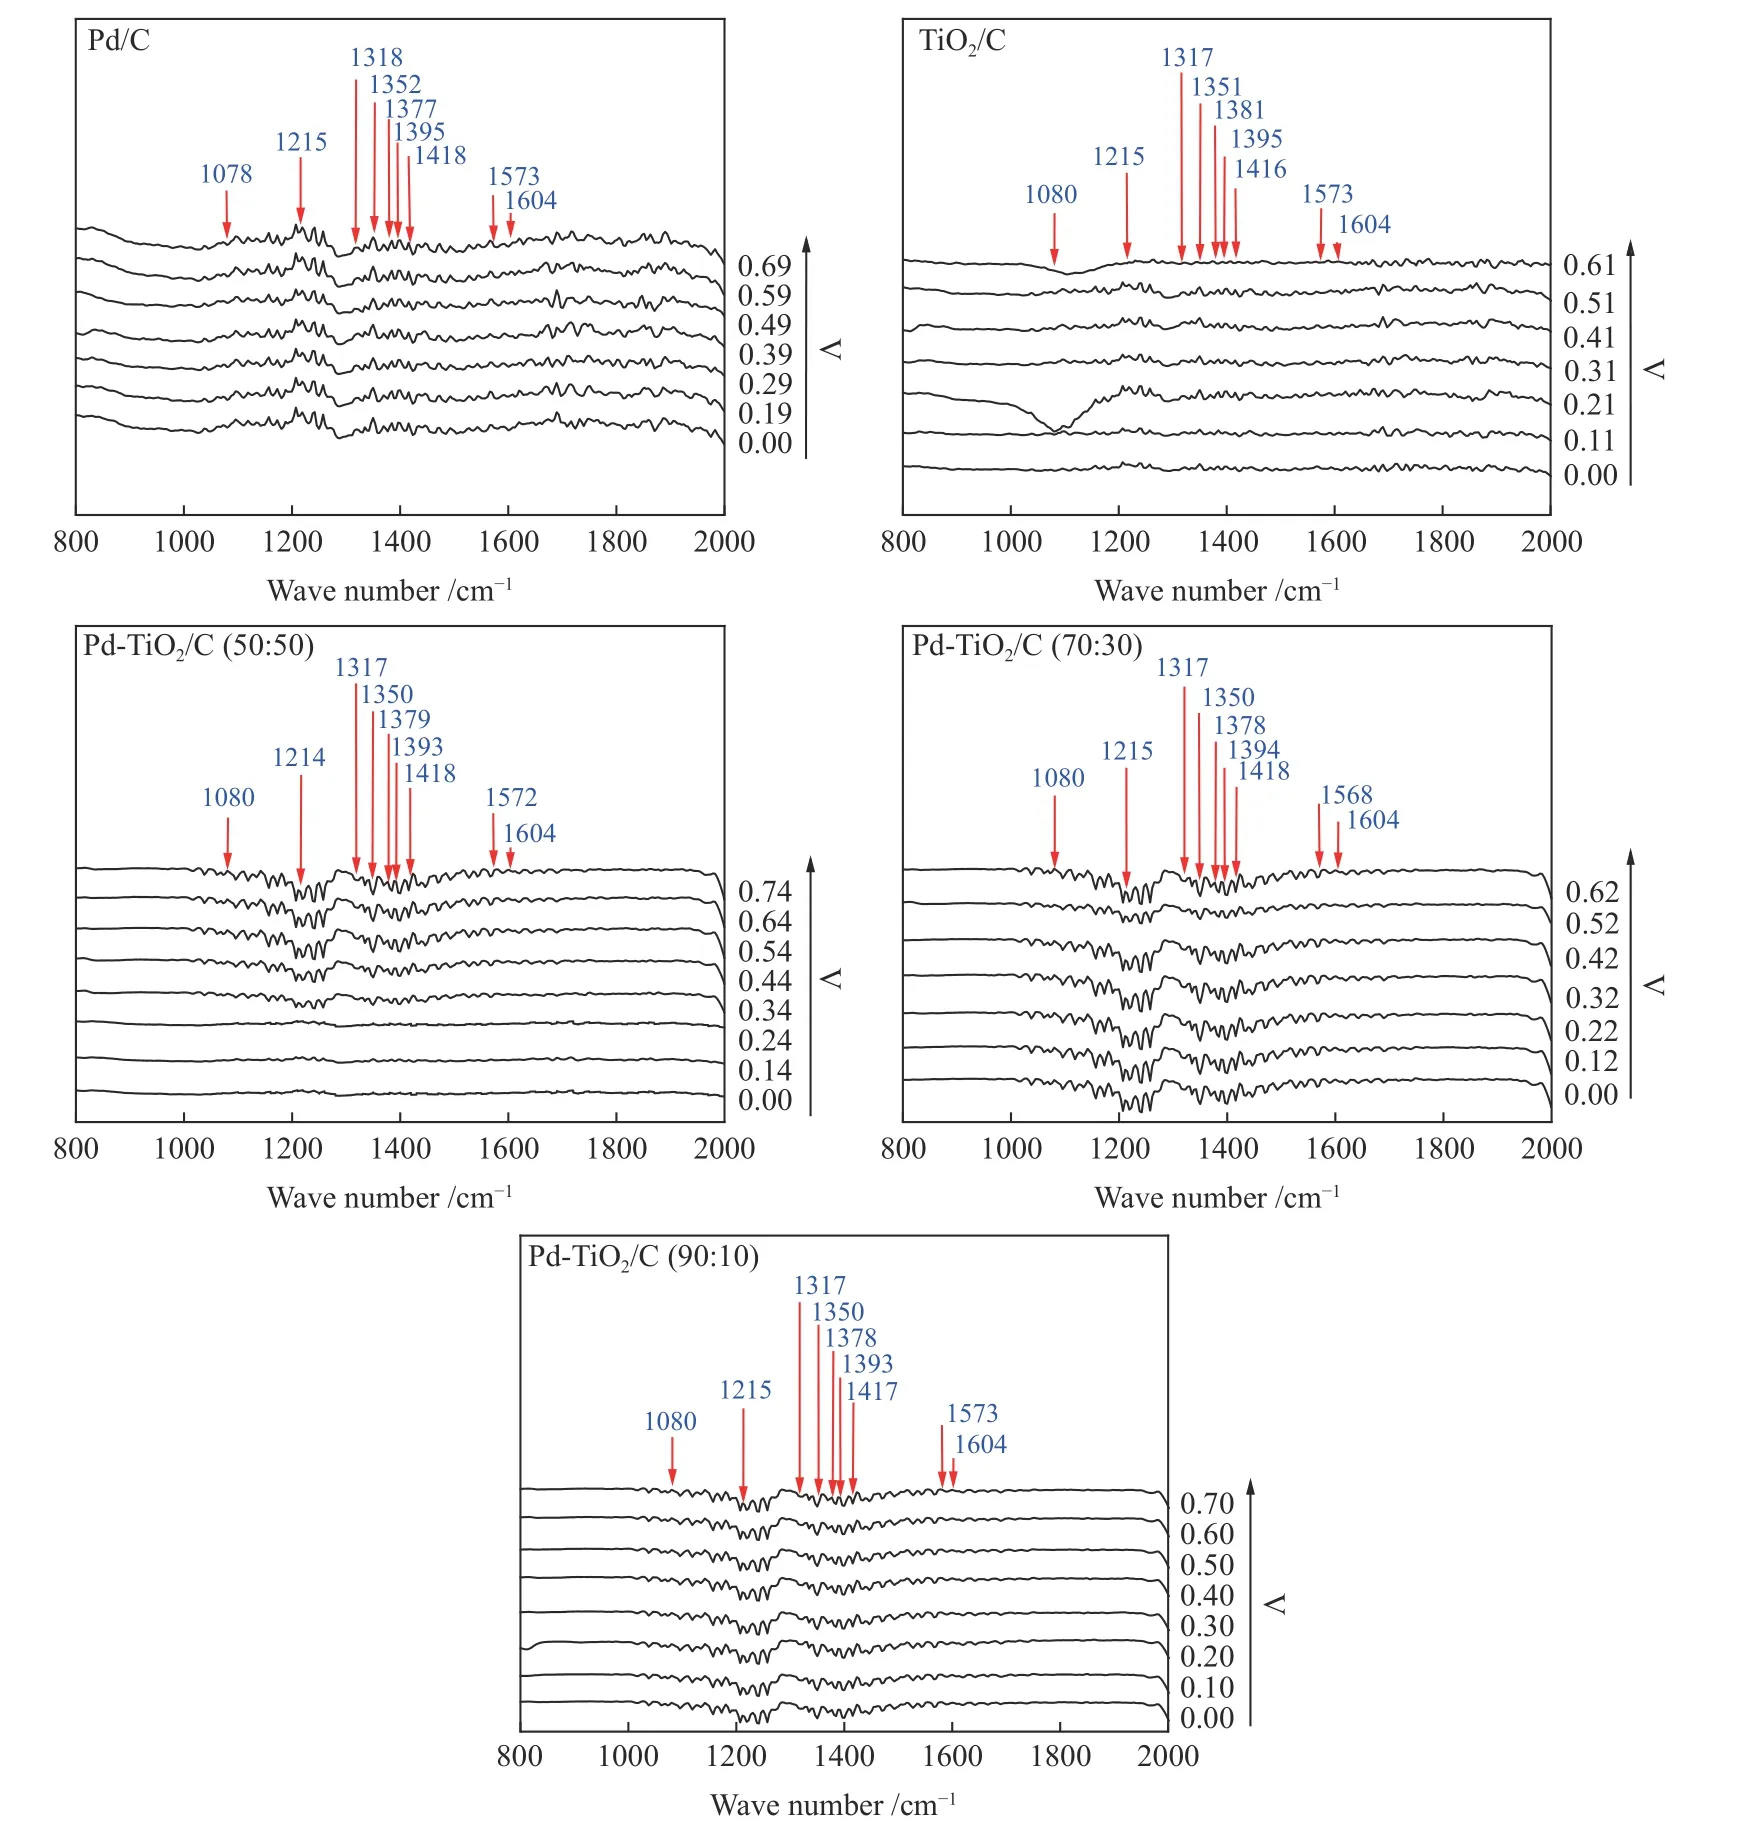
Figure 7 FT-IR spectra obtained from products collected at different potentials in increments of 100 mV in alkaline direct glycerol fuel cell (ADGFC) experiments using Pd/C, TiO2/C, Pd-TiO2/C (50∶50, 70∶30 and 90∶10) electrocatalysts
The Pd/C electrocatalyst showed efficiency in the glycerol oxidation, and led to the formation of the formate located at 1225 cm−1present in all potentials and was more intense at 0.69 V. The presence of the hydroxypyruvate band in 1355 cm−1was observed at all potentials and was more intense at 0.59 and 0.69 V respectively[30]. The mesoxalate that would occur from the hidroxypyruvate oxidation was not observed in the samples obtained (in the glycerol oxidation using Pd/C,TiO2/C or the Pd-TiO2/C (50∶50, 70∶30 and 90∶10)binary. Thus, the intermediate molecules of the partial glycerol electro-oxidation reaction were formed and consumed simultaneously.
Glycerate was observed at 1377 cm−1at all potentials, and this was less intense at 0.19 and 0.29 V at Pd/C. The carbonate and carboxylate were located at 1405 and 1575 cm−1respectively and were more intense from 0.59 to 0.69 V[30,31]. The intensities of the bands corresponding to the glycerol electro-oxidation products of the TiO2/C electrocatalyst are significantly lower than those related to the glycerol electrooxidation reaction in Pd/C electrocatalysts and those with higher proportions of Pd such as Pd-TiO2/C (with 50%, 70% and 90 % of Pd).
In the FT-IR spectra of all electrocatalysts, no peaks close to 2050 cm−1were observed, this fact can be attributed to the stretching vibration of CO species linearly bound to the surface of the electrocatalyst.However, implying that the reaction in these electrocatalysts does not include the CO formation as an intermediate[32,33]. Confirming that there is no total oxidation in the potential range observed for these electrocatalysts. According to the electrochemical results obtained, the PdTiO2/C (50∶50) and PdTiO2/C(70∶30) electrocatalysts were more promising than Pd/C, TiO2/C and Pd-TiO2(90∶10). In the PdTiO2/C electrocatalyst (50∶50) the bands of the reaction products formed were more evident from 0.30 V.Moreover, in the PdTiO2/C (70∶30) electrocatalyst the bands that tended to increase together with the value of potential were observed.
Table 2 shows the products formed with the different electrocatalysts studied. According to the electrochemical results obtained, the Pd-TiO2(50∶50)and Pd-TiO2(70∶30) electrocatalysts were more promising than Pd/C, TiO2/C and Pd-TiO2(90∶10),with respect to the rate of reaction. However, for the Pd-TiO2(50∶50) electrocatalyst, the bands of the reaction products formed were more evident from−0.30 V, while for the Pd-TiO2(70∶30) electrocatalyst,varying intensities along the potentials were observed.

Table 2 Molecules formation in the partial electro-oxidation reaction of glycerol at different potentials using combined Pd/C and TiO2/C electrocatalysts
3 Conclusions
The sodium borohydride reduction method was an efficient process to produce Pd/C, TiO2/C and Pd-TiO2/C electrocatalysts for glycerol oxidation because atomic ratios EDX (%) result showed that the amount of Pd and TiO2in the synthesized electrocatalysts is close to those nominal atomic ratios (%), as expected.All Pd-TiO2/C electrocatalysts were promising for the glycerol oxidation in comparison with Pd/C and TiO2/C. Pd-TiO2/C obtained showed the presence of segregated face-centered cubic (fcc) structure Pd-rich and that also showed peaks associated with the tetragonal structure characteristics of titanium oxide(TiO2-anatase phase). The ATR-FTIR results showed the complexity of glycerol oxidation with the formation of different oxidation products. The electrochemical measurements and the experiments in a single DFAFC showed that Pd-TiO2/C (50∶50), Pd-TiO2/C (70∶30)and Pd-TiO2/C (90∶10) exhibited superior performance for glycerol electrochemical oxidation than Pd/C electrocatalyst. The highest catalytic activity of Pd-TiO2/C (70∶30) electrocatalyst could be attributed to the synergy between the constituents of the electrocatalyst (metallic Pd and TiO2). Further work still need to be done in order to investigate the electrocatalyst surface and to elucidate the mechanism of glycerol electrochemical oxidation using these electrocatalysts, as well as to understand the electronic effect that TiO2causes in Pd atomic structure.
- 燃料化学学报的其它文章
- 铌元素改性V2O5-WO3/TiO2催化剂降低脱硝过程 SO2 的氧化率
- 甲醇水蒸气重整制氢Cu-Zn-Al尖晶石催化剂的研究
- Cu3N自支撑电极制备及其电催化氮气还原性能研究
- Co3O4/WO3复合催化剂的合成及可见光催化转化甲烷制甲醇
- Solvothermal synthesis of TiO2@MIL-101(Cr) for efficient photocatalytic fuel denitrification
- Preparation of Au-OVs-BiOBr-P25 Z-scheme photocatalyst and its photocatalytic performance in overall water splitting

