
A multiple-tissue-specific magnetic resonance imaging model for diagnosing Parkinson’s disease:a brain radiomics study
2022-04-29 03:26:38XiaoJunGuanTaoGuoChengZhouTingGaoJingJingWuVictorHanStevenCaoHongJiangWeiYuYaoZhangMinXuanQuanQuanGuPeiYuHuangChunLeiLiuJiaLiPuBaoRongZhangFengCuiXiaoJunXuMinMingZhang
中国神经再生研究(英文版) 2022年12期
Xiao-Jun Guan,Tao Guo,Cheng ZhouTing Gao,Jing-Jing WuVictor Han,Steven Cao,Hong-Jiang Wei,Yu-Yao Zhang,Min XuanQuan-Quan GuPei-Yu HuangChun-Lei Liu,,Jia-Li Pu,Bao-Rong Zhang,Feng Cui,Xiao-Jun Xu,Min-Ming Zhang
Abstract Brain radiomics can reflect the characteristics of brain pathophysiology.However,the value of T1-weighted images,quantitative susceptibility mapping,and R2* mapping in the diagnosis of Parkinson’s disease (PD) was underestimated in previous studies.In this prospective study to establish a model for PD diagnosis based on brain imaging information,we collected high-resolution T1-weighted images,R2* mapping,and quantitative susceptibility imaging data from 171 patients with PD and 179 healthy controls recruited from August 2014 to August 2019.According to the inclusion time,123 PD patients and 121 healthy controls were assigned to train the diagnostic model,while the remaining 106 subjects were assigned to the external validation dataset.We extracted 1408 radiomics features,and then used data-driven feature selection to identify informative features that were significant for discriminating patients with PD from normal controls on the training dataset.The informative features so identified were then used to construct a diagnostic model for PD.The constructed model contained 36 informative radiomics features,mainly representing abnormal subcortical iron distribution (especially in the substantia nigra),structural disorganization (e.g.,in the inferior temporal,paracentral,precuneus,insula,and precentral gyri),and texture misalignment in the subcortical nuclei (e.g.,caudate,globus pallidus,and thalamus).The predictive accuracy of the established model was 81.1 ± 8.0% in the training dataset.On the external validation dataset,the established model showed predictive accuracy of 78.5 ± 2.1%.In the tests of identifying early and drug-naïve PD patients from healthy controls,the accuracies of the model constructed on the same 36 informative features were 80.3 ± 7.1% and 79.1 ± 6.5%,respectively,while the accuracies were 80.4 ±6.3% and 82.9 ± 5.8% for diagnosing middle-to-late PD and those receiving drug management,respectively.The accuracies for predicting tremor-dominant and non-tremor-dominant PD were 79.8 ± 6.9% and 79.1 ± 6.5%,respectively.In conclusion,the multiple-tissue-specific brain radiomics model constructed from magnetic resonance imaging has the ability to discriminate PD and exhibits the advantages for improving PD diagnosis.
Key Words:diagnosis;imaging biomarker;iron;magnetic resonance imaging;neuroimaging;Parkinson’s disease;quantitative susceptibility mapping;R2*mapping;radiomics;T1-weighted imaging
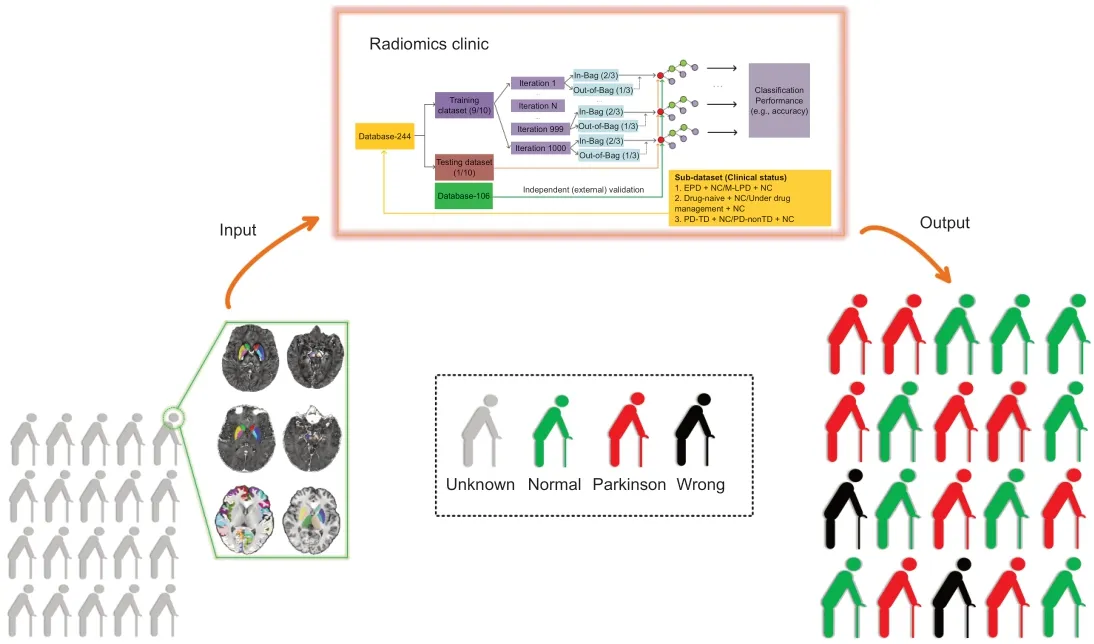
Graphical Abstract A neuroimaging model for diagnosing Parkinson’s disease
Introduction
Although numerous documents dealing with Parkinson’s disease (PD)continue to describe it simply as a disorder of substantia nigra (SN) dopamine neurons,it is now widely appreciated that PD should be identified as a multisystem disorder with differential sets of brain regions involved,resulting in complicated clinical statuses (Obeso et al.,2017;Diederich et al.,2019).The lack of reliable biomarkers for characterizing PD independently of its clinical heterogeneity is closely related to the failure to improve clinical diagnosis;in particular,high diagnostic error occurs when diagnosing early or drug-naïve patients (Rajput et al.,1991;Adler et al.,2014).Furthermore,the motor phenotypes of patients with PD vary and show considerable variations in diagnosis and treatment (Kang et al.,2005).Therefore,the investigation of objective biomarkers that provide direct evidence of brain degeneration in PD is very important.
Magnetic resonance imaging (MRI) using different sequences with diverse tissue-specific sensitivities can provide non-invasive insights into brain degeneration.Iron-related nigral degeneration was consistently detected by quantitative susceptibility mapping (QSM) and R2* mapping in PD (He et al.,2015;Du et al.,2016;Guan et al.,2019a),and the techniques were shown to improve the diagnosis (Barbosa et al.,2015;Murakami et al.,2015).Beyond the SN,brain-wide cortical degeneration measured by T1-weighted structural imaging is extensively reported (Feldmann et al.,2008;González-Redondo et al.,2014;Xu et al.,2018).By employing the Parkinson Progression Marker Initiative structural dataset,moderate performance in classifying early patients with PD was achieved (Adeli et al.,2016).Although these studies,which extracted traditional features of the PD brain (e.g.,cortical thickness/volume,mean susceptibility/relaxation of the SN),have undoubtedly offered significant advances towards biomarkers for PD,the single modality MRI and relatively small sample sizes without external independent validation(Chen-Plotkin et al.,2018) employed in most of them make it hard to comprehensively characterize brain degeneration in PD,which leads to difficulties in clinical translation.
Medical images contain a great deal of high-dimensional features that may reflect underlying brain pathophysiology (Gillies et al.,2016).However,in PD research,such high-dimensional features have frequently been ignored,and the diagnostic values of T1-weighted,QSM,and R2* images underestimated.Radiomics allows extraction of high-dimensional imaging features from multiple-parameter images,and brain radiomics offers the potential to better convert medical brain images into minable data to identify further imaging findings suitable for clinical translation (Gillies et al.,2016;Sun et al.,2018).We hypothesized that integrated brain features derived from multipleparameter MRI images through a radiomics framework may have the ability to improve PD diagnosis,including differentiation of the various clinical statuses of PD (e.g.,disease stages,drug status,and motor subtypes).Therefore,we constructed a radiomics-based diagnostic model for PD,and then performed external independent validation of the trained machine learning model using an untouched database.
Participants and Methods
Design
The protocol for the use of human subjects for this prospective diagnostic study was approved by the Medical Ethics Committee of the Second Affiliated Hospital,Zhejiang University School of Medicine (ethics approval Nos.2012-26 and 2017-008).All patients with PD and normal controls signed informed consent forms (Additional file 1).This study was reported according to the Standards for Reporting of Diagnostic Accuracy (STARD) statement (Additional file 2) and was performed in accordance with theDeclaration of Helsinki.
Patients with PD were recruited from the PD clinics of the same institute,while normal controls were recruited from local communities in Hangzhou.A total of 350 subjects (database-350) were recruited and split into two databases (database-244 and database-106) according to their recruitmenttime (before and after May 2018),and these two databases were then used for the model construction and independent validation,respectively.
Subjects (database-244)
The clinical and imaging data included in this study were originally collected from August 2014 to May 2018.The diagnosis of PD was made by two senior neurologists (JLP and BRZ) according to the UK PD Society Brain Bank criteria (Hughes et al.,1992).Initially,a total of 293 subjects who underwent MRI and clinical assessments were included.To ascertain disease severity in the patients with PD who were taking anti-parkinsonian drugs,MRI and clinical assessments were performed in the morning after withdrawing all anti-Parkinsonian drugs overnight (at least 12 hours on“drug-off status”).Among these 293 subjects,49 participants were excluded because of head motion,misregistration,significant brain atrophy/ventricle enlargement,multiple microhemorrhages,absence of clinical data,or the presence of other neurological/psychiatric diseases.Finally,data from 244 subjects including 121 normal controls and 123 patients with PD were included in the model construction (Table 1).

Table 1|Demographic information of the recruited subjects
MRI sequences
All subjects were scanned on a 3.0-T MRI scanner (GE Health,Discovery 750,Milwaukee,WI,USA) equipped with an eight-channel head coil.During MRI scanning,the head was stabilized using restraining foam pads and earplugs were provided to reduce noise.If it was noticed during scanning that motionrelated or other factors influenced image quality,the affected sequence was re-scanned.
The MRI sequences and their parameters were as follows.High resolution three dimensional T1-weighted images were acquired using a fast-spoiled gradient recalled sequence with:repetition time=7.336 ms;echo time=3.036 ms;inversion time=450 ms;flip angle=11°;field of view=260 × 260 mm2;matrix=256 × 256;slice thickness=1.2 mm;and 196 continuous sagittal slices.Enhanced susceptibility-weighted angiography images were acquired using a gradient recalled echo sequence with:repetition time=33.7 ms;1stecho time/spacing/8thecho time=4.556/3.648/30.092 ms;flip angle=20°;field of view=240 × 240 mm2;matrix=416 × 384;slice thickness=2 mm;slice gap=0 mm;and 64 continuous axial slices.
Subcortical segmentation in the native QSM and R2* maps
A newly-developed method (STAR-QSM,Steaking Artifact Reduction for QSM) was used for QSM reconstruction (Wei et al.,2015).Although the QSM map is believed to provide superior quantification of iron,R2* may provide different tissue information,such as the association with α-synuclein (Lewis et al.,2018).Therefore,in the present study,the Susceptibility Tensor Imaging Suite V3.0 software package (https://people.eecs.berkeley.edu/~chunlei.liu/software.html) was used to calculate tissue susceptibility through the construction of QSM and R2* maps.
To obtain the original susceptibility of each nucleus in its native space,we used registration-based segmentation according to the following steps(Figure 1) (Guan et al.,2020):(1) all the QSM images were co-registered to an age-specific QSM template (Zhang et al.,2018) using the SyN registration algorithm within the ANTs V2.0 package (Avants et al.,2008) and transformation matrices were acquired for each subject;(2) subcortical labels,including caudate nucleus (CN),putamen,globus pallidus (GP),red nucleus(RN),and SN were created manually in the QSM template space;(3) these labels in the template space were warped to the native space by applying the inverse transformation matrices;and (4) to reduce any voxel misplacement of the surrounding tissue resulting from co-registration bias,appropriate revisions to the resulting labels were made in the native space.Finally,in the native QSM maps,10 subcortical nuclei from bilateral hemispheres were segmented.The R2* maps had the same spatial coordinates as the QSM maps,and therefore we used the labels generated from the individual QSM maps to segment the 10 subcortical nuclei in the R2* maps.
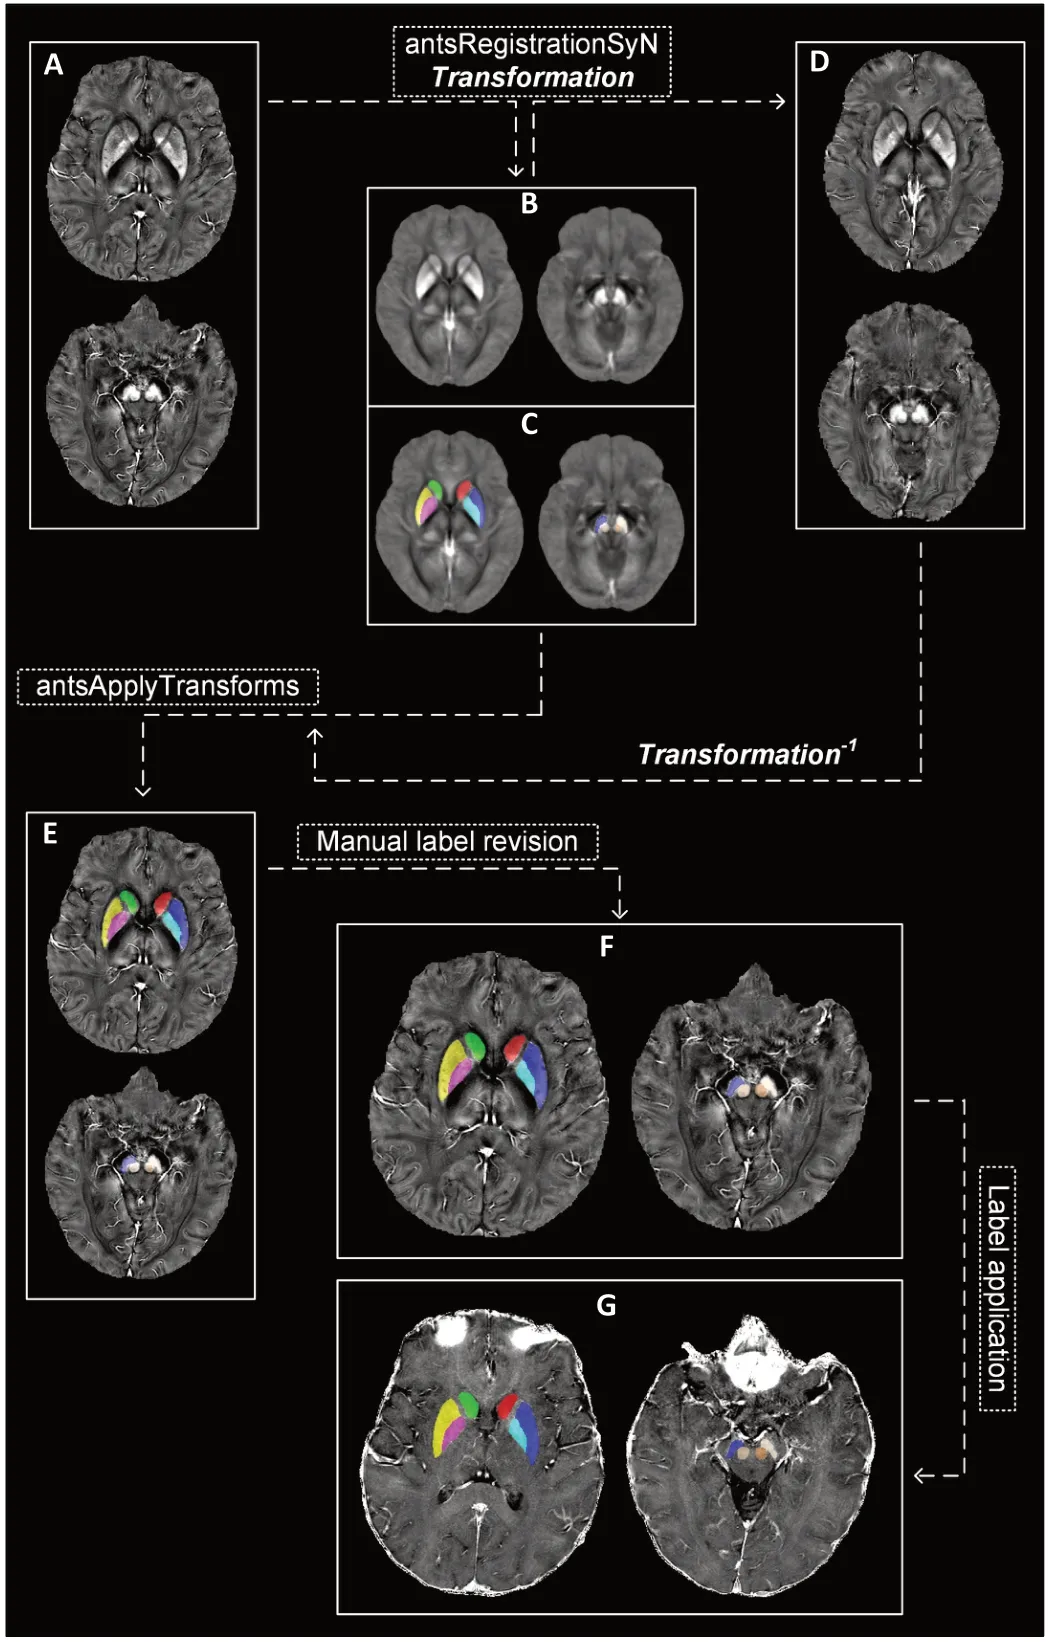
Figure 1|Registration-based segmentation to obtain labels for subcortical nuclei in the native QSM and R2* images.
Subcortical and cortical segmentations in the native T1-weighted images
A fully-automated segmentation method,FSL’s Integrated Registration and Segmentation Tool (FIRST,FSL V6.0,https://fsl.fmrib.ox.ac.uk/fsl/fslwiki)(Patenaude et al.,2011),was used to label subcortical nuclei in the native T1-weighted images.Eight nuclei,including the CN,putamen,GP,and thalamus were segmented bilaterally (Figure 2A).
For cortical segmentation,the ANTs ‘antsCorticalThickness’ pipeline,including intensity inhomogeneity correction (N4 bias correction),brain tissue extraction,SyN diffeomorphic image co-registration,tissue segmentation,and cortical thickness calculation,was applied (this pipeline has shown superior performance to the Freesurfer ‘recon-all’ pipeline) (Tustison et al.,2014).Then,the ANTs ‘antsJointLabelFusion’ pipeline referenced on the Desikan-Killiany-Tourville atlas (Klein and Tourville,2012) was used to define 62 cerebral cortical regions in the native space (31 cortical regions per hemisphere) of each subject (Figure 2A).To eliminate any risk of zero-regions within any native segmentation,we modulated the resulting Desikan-Killiany-Tourville labels in native space according to the cortical thickness mask.
Quality control of subcortical and cortical segmentations was performed by means of visual inspection of each subject’s images.
Brain feature extraction:feature extraction from the QSM map and R2*map
For the two quantitative MRI techniques (QSM and R2* maps),two kinds of brain features were extracted.First,histogram features including mean intensity,standard derivation,kurtosis,and skewness were computed within all included voxels and the voxels showing the top-ranking signals (top 5%,10%,20%,30%,40%,and 50%) within each nucleus (10 nuclei × 7 kinds of intensity × 4 histogram features × 2 MRI techniques=560 features).Second,three dimensional texture features were measured using the Gray-Level Co-Occurrence Matrix (GLCM) algorithm (Haralick et al.,1973) written in Matlab 2018a (https://ww2.mathworks.cn/products/matlab.html).For each nucleus,20 texture features (e.g.,autocorrelation,contrast,correlation,cluster prominence,cluster shade,dissimilarity,energy,entropy,homogeneity,maximum probability,sum of squares/variance,sum average,sum variance,sum entropy,difference variance,difference entropy,information measure of correlation1,information measure of correlation2,normalized inverse difference,normalized inverse difference moment) spatially derived from 26 orientations were calculated.Theoretically,because the features at each orientation should be influenced by the native position of each head within the main magnetic field,to ensure robustness in the feature quantification,the averaged GLCM features were obtained from their corresponding 26 derivates (orientations) for each nucleus (10 nuclei × 20 GLCM features ×2 MRI techniques=400 features).In total,480 QSM features and 480 R2*features were entered into the further analyses.
Brain feature extraction:high resolution T1-weighted imaging
Three kinds of features were obtained from the subcortical regions segmented by FSL-FIRST:regional volume,histogram features,and GLCM features.First,we counted the voxel numbers within each nucleus and multiplied the value by the voxel resolution.Each regional normalized volume was recorded after dividing by the subjects’ total intracranial volume (TIV).Then,the nucleus intensity was normalized by dividing the measured value by the mean value of the whole brain white matter intensity to ensure a relative estimation of intensity distribution.Afterward,the four histogram features and 20 average GLCM features mentioned above were measured for each nucleus.Two hundred FIRST features (25 features/nucleus × 8 nuclei) were entered into the analyses.
For the cortical regions defined by the ANTs algorithms,we calculated the features of cortical volume,mass,thickness,and surface area by applying the ANTs ‘LabelGeometryMeasures’ and ‘ImageMath’ pipelines.The cortical volume and surface area were normalized by the TIV and total surface area respectively.In brief,248 ANTs-features (4 features/region × 62 regions) were obtained.
Brain feature preprocessing:general linear model
Given that age and sex could present potential confounders,we constructed a general linear model from the data of 121 normal participants and applied it to both the PD and normal control data to control for the influence of these confounders on the brain features (Figure 2B).Then,all the extracted radiomics features were normalized to the range [−1,1] using the“mapminmax”algorithm in Matlab 2018a.
Feature selection:the contribution of features to the classification
The R package (https://www.r-project.org/)“caret”(classification and regression training) was used to perform the feature selection indicated in the flowchart by applying the random forest method (randomForest).To search for the brain features that contributed to the differentiation of patients with PD (n=123) from normal controls (n=121),1000 random datasets were created by permuting the label column of the original database(database-244),and 10-fold cross-validation was used to obtain unbiased estimates of classification error.Finally,all 1408 features were ranked according to their value for discriminating patients with PD from normal controls in the training database (Figure 2C).To reduce feature redundancy,the top 50 radiomics features were selected and used as input into the following model construction,and we refer to these as“informative features”.
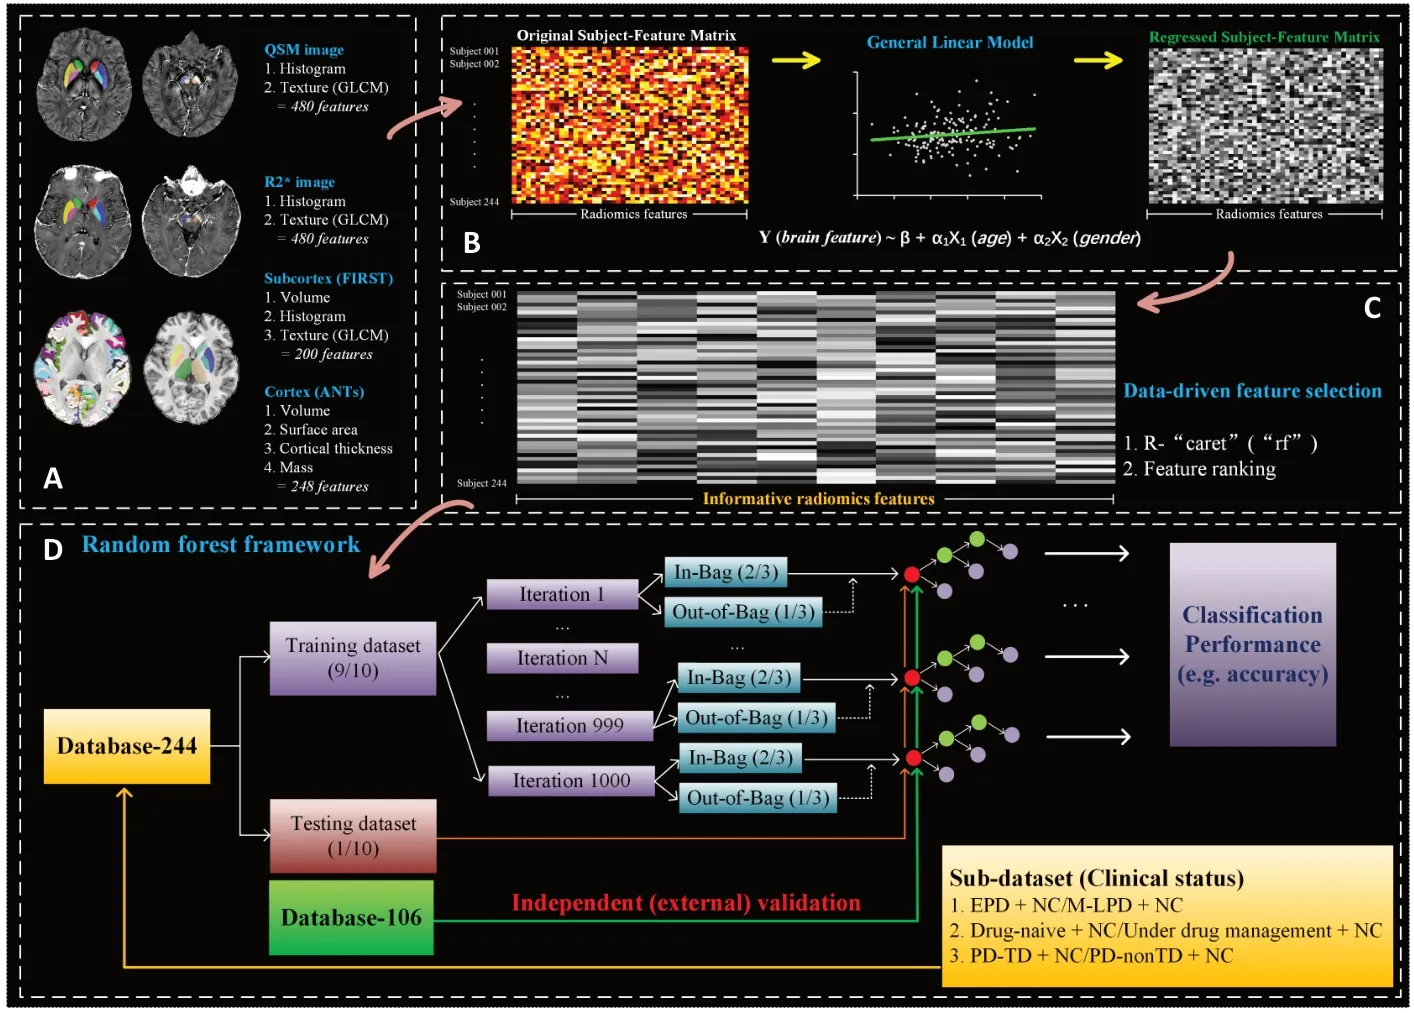
Figure 2|Flowchart of the radiomics analysis framework.
Random forest classifier construction:model training and testing
In the random forest classifier (R package ‘randomForest’),two hyperparameters were left at their default values:the number of trees was 500 and the upper limit for the number of informative features (F) tested in each node was determined as,where F was the employed feature number.The database-244 was randomly split into a training dataset and testing dataset with fixed proportions of 0.9 and 0.1.The train-test split was resampled 1000 times to obtain a stable predictive result.For each iteration,220 subjects,each of whom was characterized by informative features,were randomly assigned to the training dataset.Notably,in the training stage,“random forest”has the intrinsic ability to calculate the out-of-bag error,an unbiased estimate of generalization error,which can be appropriately considered as cross-validation to avoid over-fitting.Then,the remaining 24 subjects were assigned to the internal testing dataset,and the random forest model constructed in the training stage was subsequently used to predict the classification.
To further validate the generalization ability of the constructed model calculated from the training database,we prospectively tested the classification model on an untouched database consisting of 48 patients with PD and 58 normal controls,who were recruited from May 2018 to August 2019 (database-106) (Table 1).The defined study framework,including imaging processing,data segmentation,feature extraction,feature preprocessing,and model testing,was conducted step by step (Figure 2D).Of note,the general linear model estimated previously was used to control the influence of age and sex,but all the other steps were performed independently of the training data.
In summary,a training-internal-testing-external-validation loop was established,and the mean accuracy,sensitivity,and specificity were recorded by averaging across the 1000 iterations (Figure 3).Moreover,to determine the most appropriate number of informative features,the training-internaltesting-external-validation procedures were repeated while the number of features was reduced.The initial feature number was set at 50,and therefore the classification performance of a model with the top 50 informative features was first tested.In the following tests,the number of informative features was truncated by one for each successive iteration (F=50:-1:2).The highest diagnostic accuracy in the independent external validation was regarded as the reference standard,and finally the number of informative features was set toF=36 (=6).Correlation analysis was performed to analyze the informative features with the United Parkinson’s Disease Rating Scale (UPDRS)III (false discovery rate [FDR] corrected,q<0.05).
Clinical validations
Given that patients with PD always present with heterogenous clinical manifestations,we tested the ability of the radiomics feature-based random forest model to classify patients with PD with different clinical statuses from normal controls in the training database (Figure 1D).For each test,we calculated the mean decrease in Gini (Breiman,2001),an indicator of the contributions of each informative feature to the classifications.
Clinical validations:Classifications between clinical statuses and normal controls
Patients were classified according to their disease stage:45 patients with a Hoehn-Yahr stage of 1 or 1.5 were assigned to early PD,while 78 patients with Hoehn-Yahr stage greater than 1.5 were assigned to middle-to-late PD (Djaldetti et al.,2006;Li et al.,2020).This design allowed us to test the generalization ability of the 36 informative features to identify patients with PD with different disease stages from normal controls.
Tremor-dominant PD (PD-TD) typically has a more benign outcome along the course of the disease,while patients with PD-nonTD (e.g.,with akinesia/rigidity-dominant) have a worse prognosis (Kang et al.,2005).In consideration of the motor subtypes,we assigned 49 patients to a PD-TD group and 74 patients to a PD-nonTD group based on the motor subtype ratio (the ratio of the mean tremor score to mean akinesia/rigidity score) (Kang et al.,2005;Guan et al.,2017a):patients with a motor subtype ratio >1.0 were defined as PD-TD patients,and the others were assigned to PD-nonTD.By testing the performance in these groups in comparison with normal controls,we hypothesized that the same 36 radiomics features might be capable of differentiating different PD motor subtypes from normal controls.
Clinical diagnosis is hard to achieve for patients with PD who have never taken anti-parkinsonian drugs (drug-naïve) (Rajput et al.,1991;Adler et al.,2014).Among the 123 patients with PD,41 were drug-naïve and were under medication management.The classification performance of the random forest model in normal controls and PD with different drug statuses was evaluated using the 36 informative radiomics features.
Statistical analysis
Two-samplet-tests,encoded in IBM SPSS Statistics V19.0 (IBM Corp.,Armonk,NY,USA),were conducted to test the differences in diagnostic accuracy between each pairing of clinical statuses of PD.P<0.05 was set as statistically significant.
Results
Informative radiomics features
Table 1shows the demographic distribution of the training and validation databases.Figure 2shows a flow chart of image processing and analysis in this study.A total of 1408 radiomics features derived from QSM,R2*,and T1-weighted images were initially extracted.In the data-driven feature selection method,we observed 36 informative features,which represented the subcortical iron distribution,cortical disorganization,and texture misalignment in the cortical nuclei (Figure 3A).In detail,25 informative features were derived from iron maps,including 11 in the SN (nine from QSM,two from R2*),seven in the RN (six from QSM,one from R2*),four in the putamen (three from QSM,one from R2*),two in the GP (two from R2*) and one in the CN (one from R2*);thus,those features reflecting iron distribution in the SN were the most important for diagnosing PD.In addition to these 25 features reflecting iron distribution,six texture features (four in the CN,one in the thalamus and one in the GP) were selected from FIRST (Figure 3A),and the five informative features of cortical volume in inferior temporal,paracentral,precuneus,insula,and precentral gyri,were also selected.Among these 36 features,the seven of skewness_QSM_SN_L,volume_ACT_ITG_L,sd_QSM_SN_R,skewness_QSM_top5%_SN_R,mean_QSM_RN_R,volume_ACT_Precuneus_L,and volume_ACT_Insula_R were significantly correlated with UPDRS III (Figure 3A).
The subject-all-feature matrix (1408 × 244) and the subject-selected-feature matrix (50 × 244) derived from the training database are shown inFigure 3AandB;while the subject-selected-feature matrix (50 × 106) derived from the validation database is shown inFigure 3C.
Classification performance
The random forest classifier for discriminating patients with PD showed predictive sensitivity,specificity,and accuracy of 82.9 ± 11.4%,80.0 ± 12.0%,and 81.1 ± 8.0%,respectively,on the internal testing dataset,and 76.3 ± 3.3%,80.4 ± 4.0%,and 78.5 ± 2.1% on the external validation dataset (Figure 3B).
Using the same selected 36 informative features,we built classification models for diagnosing the different statues of PD,and observed predictive accuracies of 80.3 ± 7.1% for diagnosing early PD,80.4 ± 6.3% for middleto-late PD,79.8 ± 6.9% for PD-TD,79.1 ± 6.5% for PD-nonTD,79.1 ± 6.5% for drug-naïve PD,and 82.9 ± 5.8% for drug-managed PD,respectively (Figure 4A).In each pair of statistical comparisons,the accuracies for diagnosing drugmanaged PD and PD-TD were significantly higher than those for drug-naïve PD and PD-nonTD,respectively (P<0.001 and=0.031,respectively).However,no significant difference in accuracy was observed when discriminating early PD from middle-to-late PD (P=0.793).
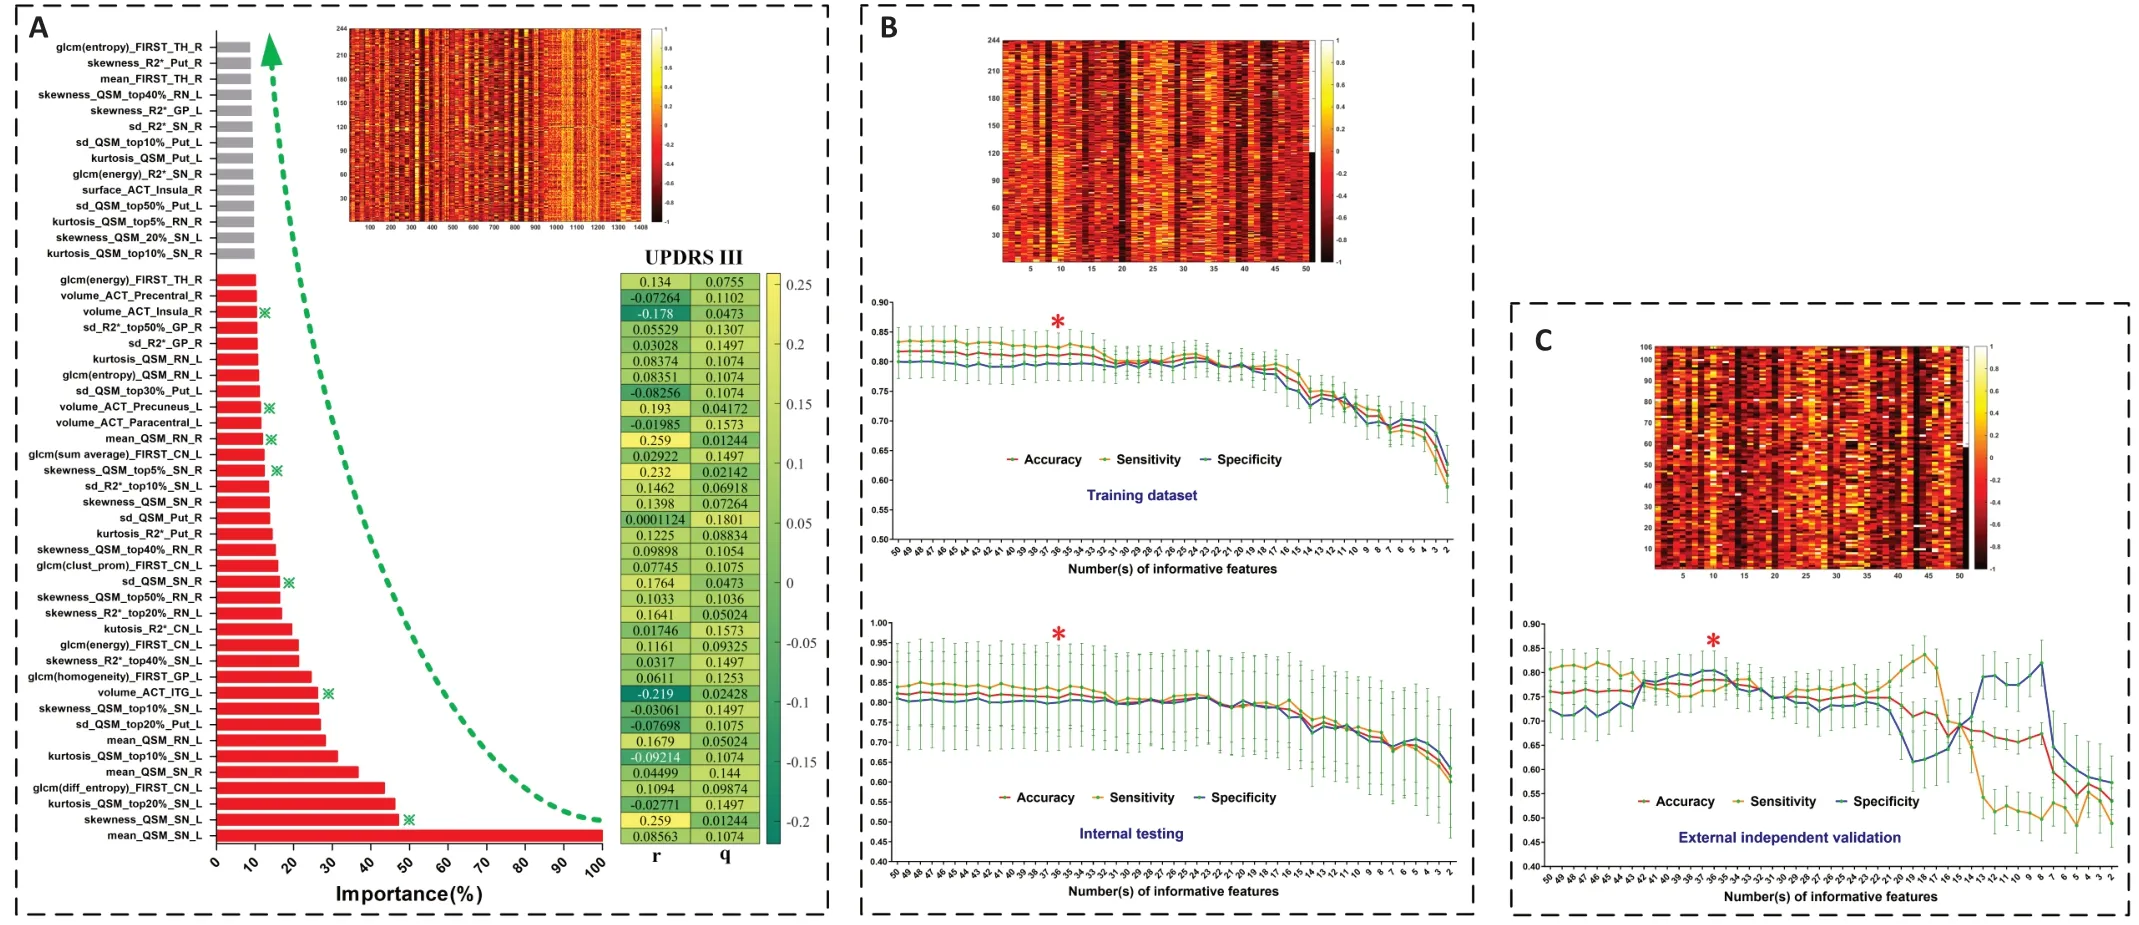
Figure 3|Feature selection and radiomics-based classifier construction.
Lastly,we plotted the contribution of each informative radiomics feature in each performance index against the mean decrease in Gini (Figure 4B).Of note,in the diagnoses of patients with PD with different clinical statuses,the contributions of the selected informative features differed between the different statuses,indicating heterogeneous neurodegenerative processes among these PD subgroups.

Figure 4|Discriminative results of the 36 informative radiomics features in the different machine-learning tests.
Discussion
In the present study,we constructed a radiomics-based model to help diagnose patients with PD,with a particular focus on its generalization ability.The major findings were as follows:(1) we identified a set of 36 informative radiomics features dominated by nigral iron distribution that showed diagnostic accuracy of 81.1 ± 8.0% on the internal testing dataset,and 78.5± 2.1% on the external validation dataset;and (2) a radiomics-based random forest classifier constructed on the same 36 informative features robustly performed diagnosis across patients with PD of different clinical statuses.
Taking advantage of non-invasive brain MRI features,computer-aided decision making for PD has been under development for approximately 10 years (Xu and Zhang,2019).The largest attempt to use machine learning to discriminate patients with PD from normal controls came from the Parkinson Progression Marker Initiative multicenter study (Parkinson Progression Marker Initiative,2011),in which a dataset of structural images (T1-weighted images) from approximately 530 subjects was employed (Adeli et al.,2016,2017).In these previous studies,MRI features of cortical volumes were input into a joint feature-sample selection method to identify patients with PD,and accuracies of 70.5% and 81.9% were achieved,respectively (Adeli et al.,2016,2017).With the insight that functional disruption may precede structural abnormalities (Guan et al.,2019b),studies also explored classifiers built on functional MRI features.However,such classifiers showed inconsistent outcomes,with accuracies varying from 75% to 93.6%,which reduced as the sample sizes increased (Chen et al.,2015;Pläschke et al.,2017;Tang et al.,2017;Guan et al.,2019b).These inconsistencies may be due to the limited sample sizes and the inconsistent EPI acquisitions used,which are sensitive to signal to noise.A couple of studies tested the usefulness of multimodal MRI features in PD diagnosis and obtained high accuracies of 87.0% and 99.7%(Long et al.,2012;Liu et al.,2016);however,the studies had small sample sizes,which suggests the possibility of over-fitting.Therefore,the construction of an objective biomarker remains an open issue.
In the present study,we established an analysis framework based on brain radiomics features,including tissue quantification and texture analysis from T1-weighted images,QSM,and R2* maps.In this evaluation for brain degeneration,we identified 36 informative radiomics features that showed a joint ability to classify patients with PD from normal controls with an accuracy of 81.1 ± 8.0%.Considering the strengths and weaknesses of machine learning algorithms,overfitting should be taken into consideration,and is usually the biggest factor leading to the failure of clinical translation.To achieve a feature selection with good generalization ability,we optimized the radiomics features by building a machine learning model on a large and balanced population (database-244),and tested the constructed classifier on an untouched database (database-106),on which it achieved a predictive accuracy of 78.5 ± 2.1%.Therefore,the radiomics-based classifier constructed on the informative feature set was shown to be robust across the internal testing and external validation,suggesting its potential translational value in future clinical practice.
Adler et al.(2014) reported only 26% accuracy for the clinical diagnosis of PD in drug-naïve subjects,53% accuracy in patients with early PD who were responsive to medication,and 85% diagnostic accuracy for patients with longer duration and medication-responsive PD.By jointly employing the 36 radiomics features,we observed that the accuracies for diagnosing patients with early PD and drug-naïve PD were 80.3 ± 7.1% and 79.1 ±6.5%,respectively,whereas similar or higher accuracies were observed for classifying patients with middle-to-late stage (80.4 ± 6.3%) or those under drug management (82.9 ± 5.8%).In addition,although previous MRI studies focused on the differences between patients with PD with different dominant motor symptoms (Kang et al.,2005;Guan et al.,2017c),no study investigated imaging biomarkers independently of motor heterogeneity.Therefore,we separately trained models on the same 36 features for the PDTD and PD-nonTD groups,and found accuracies of 79.8 ± 6.9% and 79.1 ±6.5%,respectively.Taken together,this suggested radiomics-based framework constructed on the 36 informative features exhibited good performance in diagnosing patients with PD across disease stages,drug influence,and motor subtypes,and we expect it to have high clinical value.
Among the 36 selected radiomics features,those representing abnormal iron distribution in the SN occupied the most vital role in characterizing PD.SN degeneration is the core pathology in clinical PD (Damier et al.,1999;Braak et al.,2003),and strong histopathological evidence suggests the existence of iron-related degeneration (Sofic et al.,1988,1991).Non-invasive MRI evidence has established nigral iron accumulation as a candidate imaging biomarker for PD at the group level (He et al.,2015;Du et al.,2016;Guan et al.,2017c,2019b).On the individual level,a couple of preliminary studies tested the usefulness of nigral iron content for discriminating between PD and normal controls,and found area under the curve values of 0.77 and 0.91 using QSM (Barbosa et al.,2015;Murakami et al.,2015).More recently,the texture features of SN susceptibility distributions were shown to perform well in the diagnosis of PD,with an area under the curve value of 0.89,which was higher than that achieved with traditional features (e.g.mean QSM value,area under the curve=0.69) (Li et al.,2019).These inconsistencies of the performance in the previous studies might be on account of the small sample sizes,with heterogeneous clinical statuses not being taken into account,and the studies lacking independent validation (Chen-Plotkin et al.,2018).In the present study,11 informative features indicating high iron load and heterogenous iron distribution in the SN were observed,and these gave the highest contributions to the diagnosis of PD.Moreover,even though a number of studies have reported abnormal iron distribution in other subcortical nuclei (He et al.,2015;Langkammer et al.,2016;Guan et al.,2017b,d),none of the past works considered the use of susceptibility information to diagnose patients with PD,which may be related to the clinical heterogeneity of PD (Lewis et al.,2013;Guan et al.,2017b).We found that 15 histogram and texture features derived from susceptibility information in the RN,putamen,GP,and CN were found to have certain contributions to the PD diagnosis.Taken together,subcortical susceptibility information,especially in the SN,where it may reflect iron-related degeneration,can play an important role in diagnosing PD.
Structural features in motor-,cognition-,and mood-related cortical areas,including the inferior temporal,paracentral,precuneus,insula,and precentral gyri,were found to have diagnostic value.Morphological alterations of the cerebral cortex are complex in PD,where it is under the direct stress of brain-wide α-synuclein aggregation (Braak et al.,2003) and indirect dopaminergic denervation (Yau et al.,2018).Although movement disorder is recognized as the cardinal symptom in PD,non-motor symptoms such as mood and cognitive dysfunction have become widely recognized (Lees et al.,2009).Therefore,it is possible to improve the diagnosis by integrating relevant cortical information.The paracentral and precentral gyri,the crucial components of the sensorimotor cortex in the human brain (Ribas,2010),may reflect the corticostriatal function that is exclusively disrupted in PD,and their dysfunction and hypometabolism are reported in PD (Eidelberg et al.,1994;Suo et al.,2017;Wu et al.,2020).The inferior temporal gyri,precuneus,and insula have been widely acknowledged to play especially important roles in cognitive reserve,mood-related functions,and motor modulations,and their structure,function,and metabolism were found to be pathologically involved (Feldmann et al.,2008;González-Redondo et al.,2014;Thibes et al.,2017;Xu et al.,2018;Zhou et al.,2020).Even though the exact pathogeneses of how these gyri modulate motor and non-motor symptoms in PD are not clearly known,their contributions to individual diagnoses demonstrate that cortical morphometry relating to motor and non-motor symptoms has important value in characterizing patients with PD.
Other contributions from nucleus texture misalignment,rather than regional volumes in the CN,GP,and thalamus,were observed in the normalized T1-weighted signal.Although it is difficult to explain the biological behavior behind the texture features,many studies have indicated that alterations in texture features are probably linked to the intrinsic tissue“quality”(Gillies et al.,2016).Given that the CN,GP,and thalamus are the main dopaminergic innervations influenced in PD pathology,the observed texture features may be indicating the neurodegenerative process in these nuclei.
Our study had several limitations.First,although the 36 informative radiomics features composed of nuclear susceptibility measurements,cortical morphometry,and nucleus texture showed good generalization ability in the diagnosis of PD independent of its clinical status;in real clinical practice,complex parkinsonism (like multiple system atrophy) also needs to be taken into account.Second,the single biomarkers failed to effectively identify patients with PD,and multiple integrated biomarkers appeared to be the most promising candidates (Chen-Plotkin et al.,2018).Future studies could improve the performance by integrating other biomarkers such as transcription factors.Third,this study is limited by insufficient clinical information on non-motor symptoms (e.g.,multiple-domain cognitive neuropsychological battery),and therefore it was not possible to validate the radiomics features in the patients with PD with different non-motor symptoms.Fourth,although we applied independent validation,the data were acquired from the same clinical center,and future studies that recruit external cohorts for independent validation are warranted to facilitate clinical translation.
In conclusion,brain radiomics features derived from multiple-parameter MRI had the ability to discriminate PD from normal controls,independent of the clinical heterogeneity of patients with PD,and they exhibited advantages for improving PD diagnosis on the individual level.
Acknowledgments:The authors would like to thank all the PD patients and normal volunteers recruited in this project.The authors appreciate the clinical assistance from other neurologists in the Department of Neurology,the Second Affiliated Hospital of Zhejiang University School of Medicine and the other members in Liu’s lab (University of California,Berkeley,USA)for technique consulting.The authors also appreciate Dr.Pei-Pei Pang (GE Healthcare,Hangzhou,China) for her intelligence on the suggestions about computer science.
Author contributions:Study conception:XJG,TG,XJX,MMZ;study organization:XJG,TG,MX,QQG,PYH,XJX,MMZ;experiment implementation:XJG,CZ,TG,JJW,VH,SC,HJW,YYZ,CLL,XJX,MMZ;statistical design:XJG,TG,TG,JJW,CLL,XJX,MMZ;statistical analysis:XJG,TG,CZ,VH,SC,HJW,YYZ,JLP,BRZ,FC;statistical revision:XJG,TG,CZ,TG,JJW,MX,QQG,PYH,CLL,JLP,BRZ,FC,XJX,MMZ;manuscript draft:XJG;manuscript revision:XJG,TG,CZ,TG,JJW,VH,SC,HJW,YYZ,MX,QQG,PYH,XJX,MMZ.All authors approved the final version of manuscript for publication.
Conflicts of interest:The authors declare that they have no conflict of interests.
Availability of data and materials:All data generated or analyzed during this study are included in this published article and its supplementary information files.
Open access statement:This is an open access journal,and articles are distributed under the terms of the Creative Commons AttributionNonCommercial-ShareAlike 4.0 License,which allows others to remix,tweak,and build upon the work non-commercially,as long as appropriate credit is given and the new creations are licensed under the identical terms.
Open peer reviewer:Xiaoyan Chen,First Medical Center of Chinese PLA General Hospital,China.
Additional files:
Additional file 1:Informed consent (template) (Chinese).
Additional file 2:STARD checklist.
Additional file 3:Open peer review report 1.
- 中国神经再生研究(英文版)的其它文章
- Acetyl-11-keto-beta-boswellic acid promotes sciatic nerve repair after injury:molecular mechanism
- Interleukin 17A deficiency alleviates neuroinflammation and cognitive impairment in an experimental model of diabetic encephalopathy
- NR4A1 agonist cytosporone B attenuates neuroinflammation in a mouse model of multiple sclerosis
- A new anterograde trans-synaptic tracer based on Sindbis virus
- Interleukin-4 promotes microglial polarization toward a neuroprotective phenotype after retinal ischemia/reperfusion injury
- Involvement of NLRP3-inflammasome pathway in noise-induced hearing loss