
Movement behaviors and their association with depressive symptoms in Brazilian adolescents:A cross-sectional study
2022-04-18 11:32:26BrunoGonclvesGldinoCostJenPhilippeChputMrcusViniciusVeerLopesLuisEdurdoArgentMlheirosKellySmrSilv
Bruno Gon¸clves Gldino d Cost *,Jen-Philippe Chput ,Mrcus Vinicius Veer Lopes Luis Edurdo Argent Mlheiros Kelly Smr Silv
a Research Centre in Physical Activity and Health,Federal University of Santa Catarina,Florian´opolis,88040-900,Brazil
b Healthy Active Living and Obesity Research Group,Children’s Hospital of Eastern Ontario Research Institute,Ottawa,ON K1H 8L1,Canada
Abstract
Keywords:Accelerometry;Depression;Physical activity;Sedentary behavior;Sleep
1.Introduction
Depression is a leading cause of mortality by suicide among adolescents1and is a predictor of mental disorders and social problems in adulthood.2,3The prevalence of depressive disorder among adolescents was estimated at 4%in a study published in 2006,4but its prevalence is projected to be much higher in 2030,5with growing prevalence of symptoms being observed in more recent studies.6Many behavioral risk factors(e.g.,physical inactivity)can contribute to increasing rates of depressive symptoms,and identifying modifiable behaviors associated with them is imperative for planning preventive policies and interventions for at-risk populations,especially in middle-income countries,where more adolescents at risk of depression are found7and less research has been conducted.8
There is a growing interest in how movement behaviors can be related to depression because they have been suggested as factors that can provide protection against depressive symptoms in adolescents.9-11Movement behaviors comprise the composition of physical activity(PA)of differing intensities,sedentary behaviors(SBs),and sleep behaviors.12These behaviors explain the day of each individual because they are mutually exclusive from a time perspective;that is,1 min spent in 1 of these behaviors implies 1 min less spent in the others,considering a finite 24-h day.Their relationship with depression has been analyzed before.For example,PA has been highlighted by a review of prospective studies as a possible protective factor for depressive symptoms,13but associations are inconclusive in studies with adolescents;negative associations14-16and non-significant associations have been reported.17-19SB has been shown to both predict and be predicted by depressive symptoms during adolescence,9,20,21and sleep also seems to be inversely associated with depressive symptoms in adolescents.10,11,22Overall,the available evidence suggests that more PA,less SB,and adequate sleep are protective factors for depressive symptoms;however,some components or domains of these behaviors may also be important.
Certain forms of PAs and SB happen within social and environmental contexts that may be associated with depressive symptoms.For example,a meta-analysis found a positive relationship between the use of computers and depression,but this relationship was not significant for television viewing and videogames.23One explanation for this association is that using social media exposes adolescents to social harassment,24which is unlikely to happen when watching videos.However,watching television and playing videogames are related to increased perceptions of loneliness and less social engagement,which may predispose adolescents to depressive symptoms by other pathways.25,26Similarly,a study of adults showed that leisure-time PA was associated with fewer depressive symptoms,but occupational and commuting domains were not.27Leisure PAs such as practicing team sports may be more conducive to social interactions and enjoyment that are not observed in commuting or doing house chores.28Poor sleep is also a predictor of depressive symptoms,24and different indicators of duration and quality have been associated with depressive mood in adolescents.22,29This may be partially explained by the adverse effects of sleep deprivation,such as impaired emotional regulation and reduced cognitive performance.30Daytime sleepiness is a measure of the sensation of tiredness and the need for sleeping more during the day.This measure is a qualitative complementary to other sleep variables because it is not a measure of sleep quality,such as sleep efficiency;and although it is highly related to sleep quality and duration,31it may be associated with depressive symptoms independently.32
Adolescence is marked by decreases in PA levels33,34and sleep duration,35and increased SB9,33,34and depressive symptoms2,9are observed during adolescence.The relationship between these variables has been studied before.For example,a previous study observed that sports are more strongly associated with psychological well-being in boys than in girls,28whereas the association of social media use and depression is stronger in girls than in boys.24However,most studies analyzing these associations have included only self-reported measures of behaviors,which are highly prone to memory and social-desirability bias among adolescents.On the other hand,accelerometers do not provide contextual information about these activities(e.g.,type of PA or type of SB).Additionally,most studies have included 1 or 2 measures of movement behaviors,which limits the comprehension of how these different behaviors are related to depressive symptoms.Furthermore,the majority of previous studies of this topic area have been conducted in high-income countries and may have limited applicability in lower-income settings.
The objective of the present study was to examine the associations between self-reported and accelerometer-measured movement behaviors and depressive symptoms in Brazilian adolescents.Based on previous studies,we hypothesized that all screen-time behaviors would be associated with more depressive symptoms,whereas all indicators of PA would be associated with fewer depressive symptoms.Furthermore,we hypothesized that sleep efficiency and duration would be negatively associated with depressive symptoms,whereas daytime sleepiness would be positively associated with depressive symptoms in our sample of younger people.
2.Methods
2.1.Participants and study design
Cross-sectional study data obtained from the baseline assessment of the Estudo Longitudinal do Estilo de Vida de Adolescentes(ELEVA;translated as Longitudinal Study of the Lifestyle of Adolescents)were analyzed.The study was conducted in 2019 and included all 3 Federal Institutes of Technological Education of Santa Catarina State(Florian´opolis,Brazil)that offered high school with professional courses.Eligible schools were invited in 2018 after meeting with the principals and the pro-rectory of Research,Graduate and Innovation.The study population was composed of students(age range:14-18 years old)enrolled in the high school courses integrated into professional courses,and all students in all public schools offering these courses in the mesoregion were invited to participate.(No sampling method was used;the population census strategy was chosen.)These courses have a duration of 4 years;students from the 1st to the 3rd year were eligible,and all were invited to participate in the present study.Exclusion criteria included being unable to take part in 1 of the study tests due to injury or health limitation.Adolescents under the age of 18 had to provide written informed consent forms signed by their parents/guardians and signed by themselves,whereas participants 18 years or older could provide informed consent themselves.The present research project was approved by the Ethics Committee in Research with Human Beings of the Universidade Federal de Santa Catarina(Protocol#3.168.745).
2.2.Data collection
Data collection was organized into 3 visits.In the 1st visit,the research project was presented to the adolescents in the classroom,and all eligible students were invited to participate.Consent forms were delivered,and students were advised to deliver the signed form to a physical education teacher or the researchers in the follow-up visit.The research team projected a video explaining the rationale of the study and its measures.The video was developed by the research team in the Brazilian Portuguese language.
In a follow-up visit(7 days after the 1st visit),the research team returned to the classrooms to collect the consent forms and take the 1st measurements of those participating in the research.Researchers trained in the protocol of the International Society for the Advancement of Kinanthropometry took the measurements.Body mass and height were measured in a reserved room while participants were wearing light clothes.A scale calibrated to the nearest 0.1 kg(Model W300;Welmy,Santa B´arbara d’Oeste,Brazil),and a portable stadiometer(Alturaexata,Belo Horizonte,Brazil)calibrated to the nearest 0.1 cm were used.The accelerometers(GT3x+and wGT3x+;Acti-Graph,Pensacola,FL,USA)were delivered to each student in the same room by trained researchers.In the 3rd visit(7 days after the 2nd visit),the team retrieved the accelerometers and instructed the students in the completion of the online questionnaire,which was hosted on the SurveyMonkey platform.Smartphones,tablets,and notebooks were offered to the students for answering the questionnaire,or they could use their own if they preferred.The average duration for the completion of the questionnaire was 24 min.Students who missed the classes at some stage of data collection were invited to participate in another class on the subsequent data collection date of that campus.
2.3.Instruments
Depressive symptoms were measured using the Center for Epidemiologic Studies Depression Scale(CES-D),a 20-item questionnaire widely used in studies of adolescents6,36and validated for Brazilian adolescents.37The items reflect mood and feelings of the participants(e.g.,“I felt I was just as good as other people”;“I thought my life had been a failure”),and each item receives a score from 0 to 3,resulting in a score ranging from 0 to 60,with higher scores indicating more depressive symptoms.Participants were classified as being at high risk of depression if their scores were≥20,as previously recommended.36
Movement behaviors were assessed using triaxial Actigraph accelerometers(GT3x+and wGT3x+;ActiGraph);worn on the non-dominant wrist for 7 consecutive days.Participants were instructed to wear the accelerometer for 24 h a day(including waking and sleeping),except for activities where the monitors would be submerged in water(e.g.,surfing or swimming but not showering or washing dishes).The accelerometers were secured by a disposable PVC band(Superband Fina 460;TAG Com´ercio de Materiais de Identifica¸c~ao,S~ao Paulo,Brazil),and each student received at least 1 other band if they had to take the accelerometer off for any activity.Accelerometers were charged and initialized by trained researchers and used 30 Hz as the sampling frequency.Participants who provided 16 or more hours of valid data for 4 or more days during the week,including a weekend day,were included in the analyses.38Data were analyzed in 5-s epochs,and acceleration was classified as moderate to vigorous PA(MVPA)(activities above 201.4 m g);light-intensity PA(LPA)(activities between 35.6 m g and 201.4 m g);and SB(activities below 35.6 m g)using the offs that Hildebrand et al.39,40recommend for this age group.Sleep duration was derived from the accelerometry data using the Heuristic algorithm,looking at Distribution of Change in z-Angle.This algorithm differentiates sleep from other inactivity windows(operationalized in the present study as SB)by calculating the longest sustained period of inactivity(calculated based on changes in the angle of the wrist)with the lowest number of interruptions in a 24-h time window.This is described in detail by van Hees et al.41Although no studies of adolescents have been published using this procedure,it has been validated and yields good estimates of sleep duration in adults(c-statistic of 0.86 for detecting sleep-period time vs.polysomnography).In addition,sleep efficiency(%)was calculated as the proportion of time spent sleeping divided by the total time in bed.Analyses of raw accelerometer data were conducted using the GGIR package for R(Version 4.0 for Windows;R Foundation for Statistical Computing,Vienna,Austria).
Self-reported PA was assessed using an adapted version of the Self-Administered Physical Activity Checklist.42It consists of the following question:“In general,which of the following activities do you practice?Report how many days in a typical week and for how long each day do you engage in any of the activities.”Participants responded to a list of 22 activities,which was previously validated for Brazilian adolescents,43reporting on PA frequency(0-7 days/week)and duration(min)in a typical week.Students could include other activities not included in the pre-established list or answer that they did not engage in any PA at all.The total volume of PA in minutes was calculated by summing the weekly volume(product of frequency×duration)for each activity on the list.Volume of sports was calculated by summing the volume of soccer,futsal,basketball,handball,volleyball,tennis,table tennis,swimming,athletics,combat sports,gymnastics,cycling,skating,and surfing.28Non-sports were coded as the sum of the volume of capoeira,dancing,collective gymnastics(gyms),weight lifting,walking,jogging,and active play.28
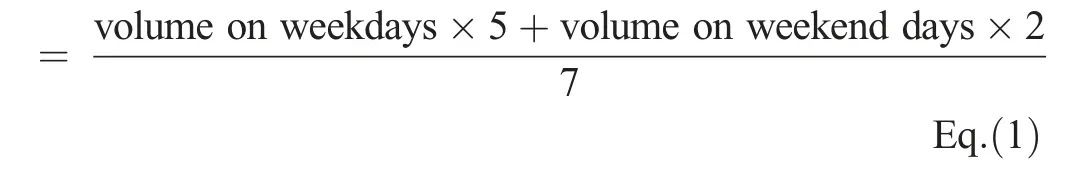
Screen time was measured by using 3 questions on the Questionnaire for Screen Time.Three constructs of screen time were assessed:(1)time spent watching videos(e.g.,series,news,sports,streams,and movies);(2)time spent playing videogames;and(3)time spent using social media and chat applications.The questions did not discriminate among whether the construct took place using a television,computer,smartphone,tablet,or other electronic device.Participants responded with the time(h or min)they engaged in each activity on a typical weekday and weekend day.Daily screen time was estimated by weighting the answers(Eq.(1))and classifying each construct into 3 categories:<2.0 h/day,2.0-3.9 h/day,and>3.9 h/day.These items were validated in a previous pilot study(n=104 adolescents),yielding Gwet agreement coefficients ranging from 0.54 to 0.82 for weekdays and from 0.56 to 0.87 for weekend days.
Daily screen time
The daytime sleepiness variable was assessed using the Pediatric Daytime Sleepiness Scale,44which comprises 8 questions with answers that could range between 0 and 4(e.g.,“Are you usually alert most of the day?”;“How often do you think that you need more sleep?”),resulting in a score ranging from 0 to 32,where 32 indicates the most daytime sleepiness.This instrument was validated for Brazilian Portuguese and yielded appropriate indicators of content validity and clarity for Brazilian adolescents.45
Sociodemographic indicators of sex,age,socioeconomic status(SES),and weight status were used as covariates in statistical models.These variables have been associated with depressive symptoms previously,and studies have shown that girls,6older adolescents,2those from lower socioeconomic backgrounds,2,7and adolescents with obesity2have increased depressive symptoms.Because these characteristics are also associated with 24-h movement behaviors,they were included as adjusting variables in our statistical models.The SES score was assessed according to the Brazilian Association of Research Companies and asked about ownership of household belongings(cars,computers,dish washers,refrigerators,freezers,washing machines,DVD players,microwave ovens,motorcycles,and drying machines),the level of education in the family,and whether the family had running water and lived on a paved street.46This list of these items was created specifically to represent a countrywide standardized measure of SES in Brazil,and each item was weighted according to guidelines and coded into a composite score.46We used the World Health Organization growth curves(calculated using body height and mass)to classify weight status as underweight,healthy weight,overweight,or obesity.
2.4.Statistical analyses
Participants’characteristics were described using means±SDs and relative and absolute frequencies.Normality of continuous variables was checked,and the MVPA variable was log-transformed for the regression analyses.Comparison of characteristics between those who provided valid accelerometer data and those who did not was conducted using the Student t test(age,SES,and depressive symptoms score)for continuous variables and the Pearsonχ2test for categorical variables.To test associations between each movement behavior(MVPA,LPA,SB,and sleep duration)and depressive symptoms,mixed-effects logistic regression models were fit by using the dichotomous classified risk score as the outcome variable(CES-D score≥20 vs.<20),with consideration given to the hierarchical structure of the data,where adolescents are nested within schools.Models were adjusted for sex,age,SES,and weight status.The regression models for accelerometermeasured sleep duration,sleep efficiency,and SB indicators were each adjusted for self-reported PA and self-reported screen-time indicators but not for other accelerometer-measured variables.The models for accelerometer-measured LPA and MVPA were adjusted for the self-reported screen-time indicators but not for other accelerometer-measured variables.The model for daytime sleepiness was adjusted for accelerometer-measured sleep duration,self-reported PA,and self-reported screen-time indicators.The models for self-reported PA,volume of sports,and volume of non-sports were adjusted for self-reported screen-time indicators.The model for the screen-time indicators was adjusted for accelerometer-measured SB,self-reported PA,and each other screen-time indicator.Sex interaction terms with each indicator of the 24-h movement behaviors were tested(e.g.,sex×MVPA,sex×social media use),but because no significant sex interactions were found in any model,data were pooled for analysis.Analyses were conducted with R(R Foundation for Statistical Computing),using the lme4 package for the mixed-models analysis.Significance was set at p<0.05(2-tailed).
2.5.Sensitivity analyses
The classification of“high-risk”for depression using the CES-D is not standardized,and other cut-off points have been used in previous studies.6,36Using different cut-off points can impact the prevalence of the high-risk group directly,which also may impact associations.To decrease the risk of bias due to the use of 1 cut-off point,we conducted sensitivity analyses using the cut-off point of 16,as recommended by the original CES-D instrument,and by using the cut-off point of 29,which has also been used in studies of adolescents.6
Although differences between self-reported and objective measures exist,there might be collinearity between these measures.For example,adolescents who report greater amounts time watching videos may be sedentary while doing so and,thus,information captured by accelerometers and questionnaires coincide.To quantify possible collinearity,correlations between self-reported and accelerometer-measured indicators were calculated.Polyserial correlations were calculated between screentime indicators and accelerometer-measured behaviors,and Pearson correlations were calculated between self-reported PA and accelerometer-measured behaviors.The results of these analyses are available in Supplementary Table 1.
3.Results
Of the 1010 participants who provided written informed consent(approximately 62.24%of the 1618 students eligible),762 provided valid accelerometer data(i.e.,valid data for 4 or more days,including at least 1 weekend day),851 had valid measures of body height and weight,and 856 answered the questionnaire,for a total of 610 who had valid data from all instruments and were,thus,included in the present analytical sample.No differences were found for sex,age,SES,depressive symptoms,volume of sports,screen time,or weight status variables between adolescents who were excluded compared to those who were included in the present analyses.However,participants who were excluded from the analyses had higher scores for daytime sleepiness and reported more total PA and a higher volume of non-sport physical activities(Supplementary Table 2).Descriptive data for the sample can be found in Table 1.
Associations between movement behaviors and depressive symptoms are presented in Table 2.No significant associationsbetween accelerometer-measured movement behaviors and depressive symptoms were found.Significant positive associations with depressive symptoms were observed for daytime sleepiness(odd ratio(OR)=1.17,95%confidence interval(95%CI):1.12-1.22)and for using social media between 2.0 and 3.9 h/day(OR=1.77,95%CI:1.58-2.70)and for using it>3.9 h/day(OR=1.67,95%CI: 1.10-2.54) compared to using it<2.0 h/day.The volume of self-reported PA(OR=0.92,95%CI:0.86-0.98)and participation in sports(OR=0.88,95%CI:0.79-0.97)were inversely associated with depressive symptoms.
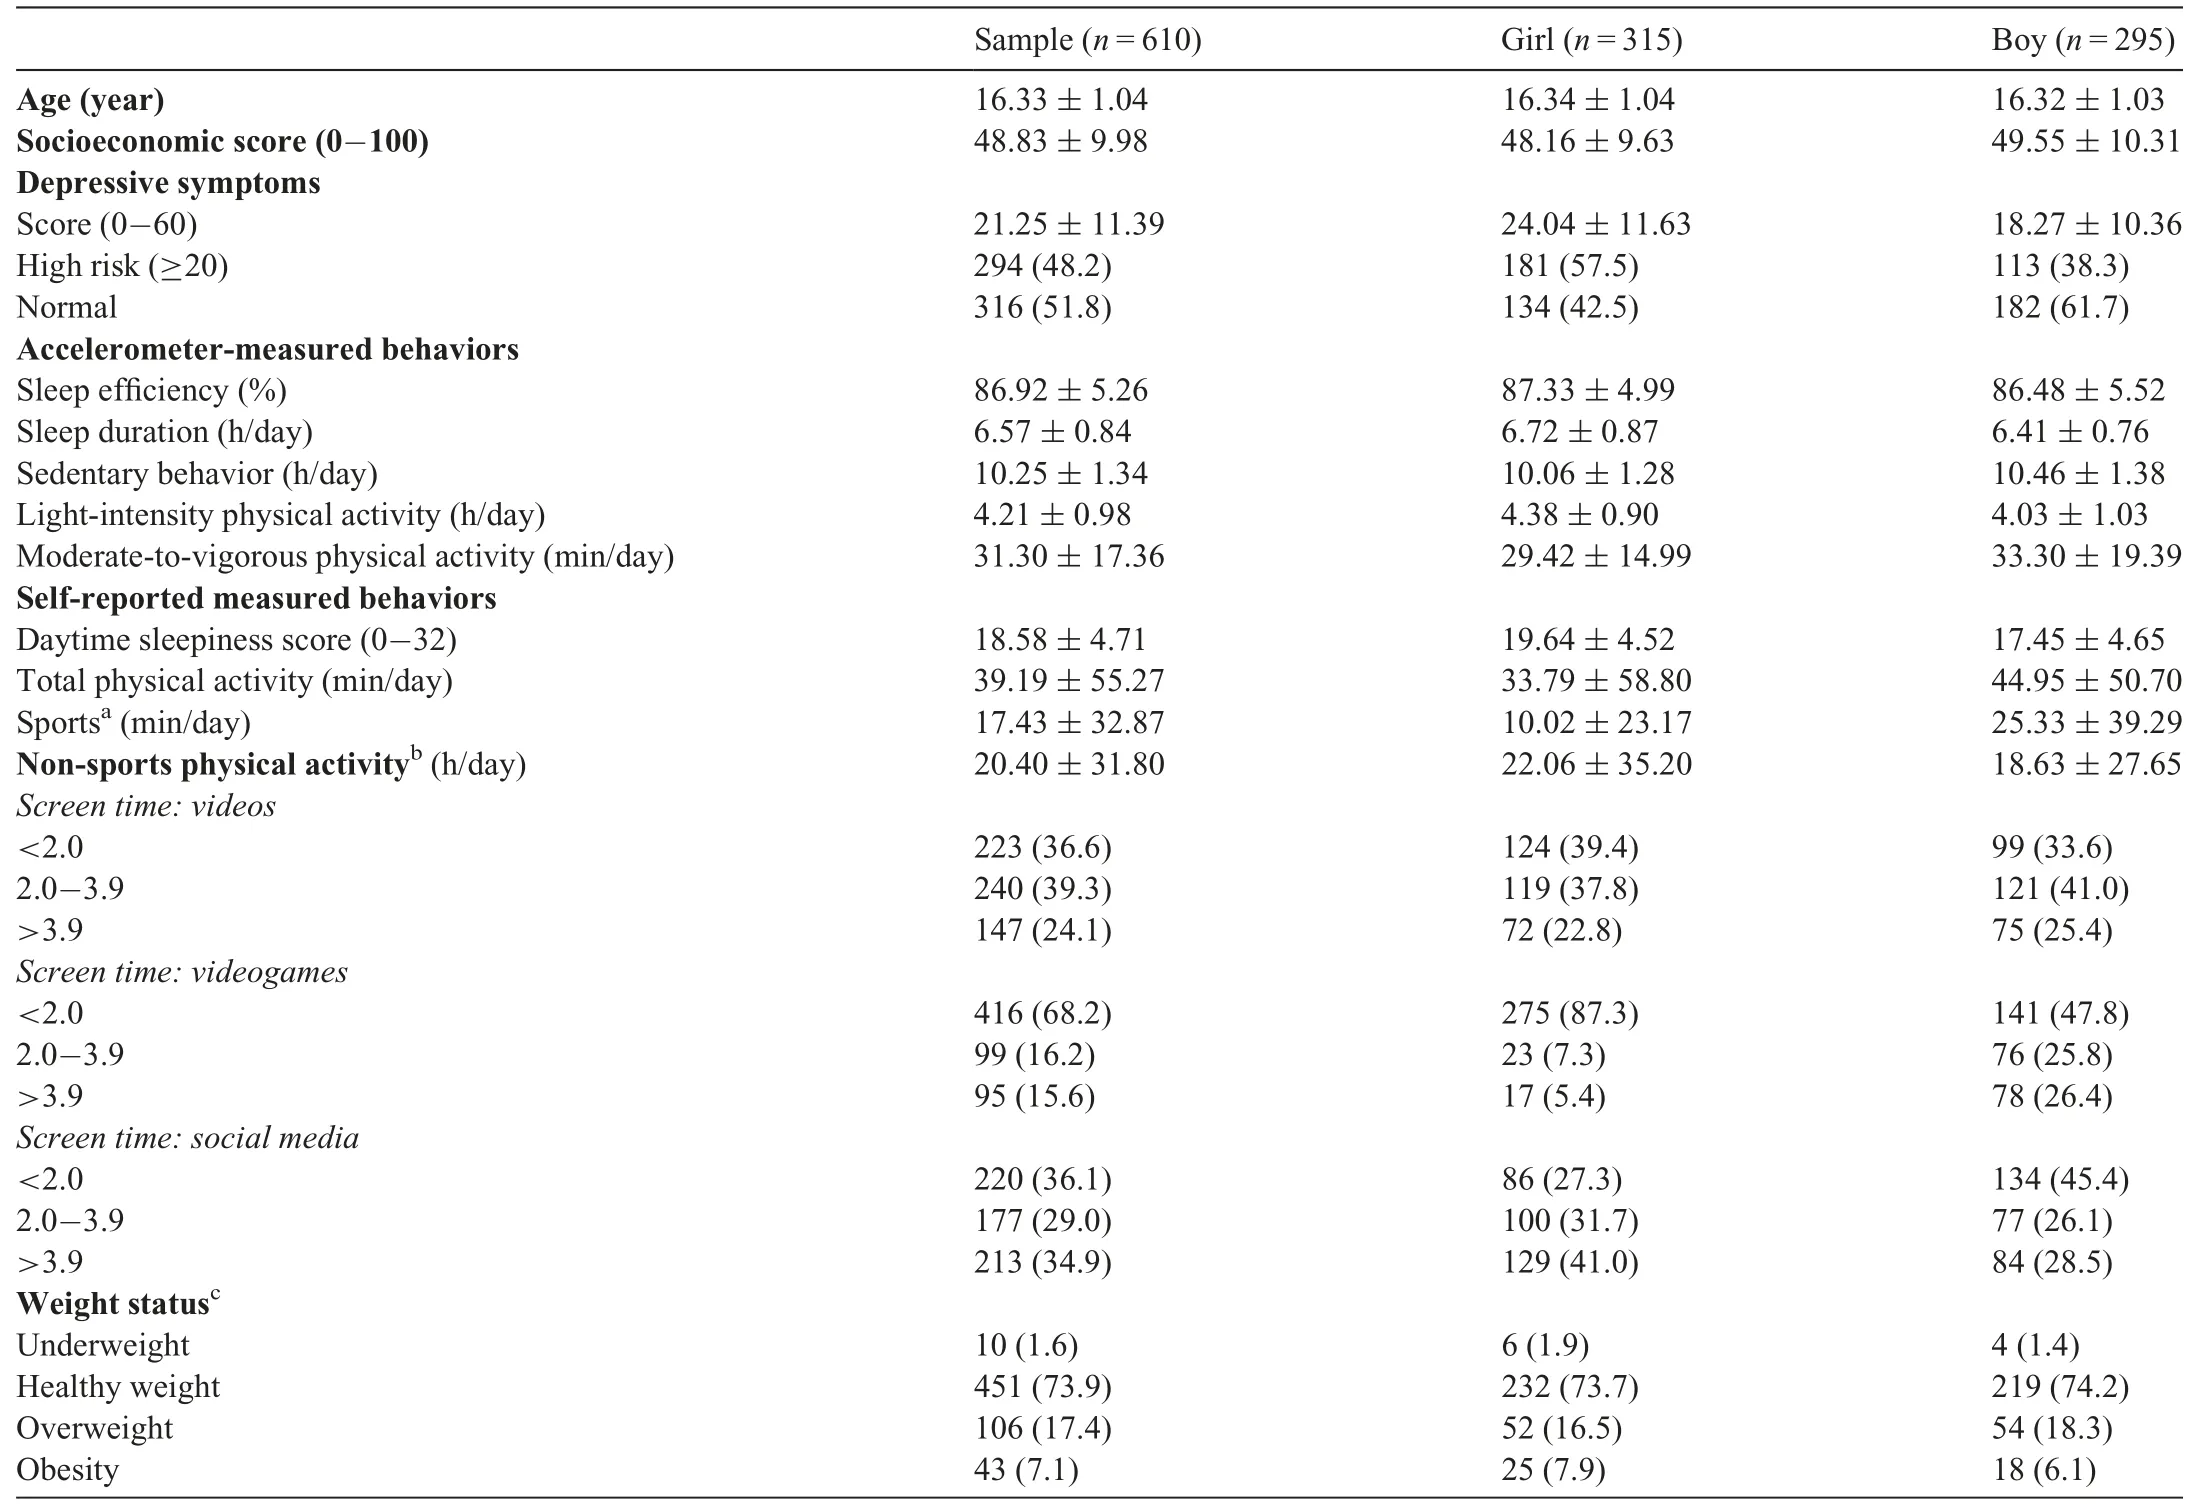
Table 1 Characteristics of the sample(mean±SDor n(%)).
Similar associations were observed in the sensitivity analyses when using the cut-off point of 16 to classify depressive symptoms,but the significant associations with sports and social media were not observed when using the cut-off point of 29 to classify depressive symptoms(Supplementary Table 3).
4.Discussion
The present study investigated the association between objectively measured and self-reported sleep,SB,LPA,and MVPA indicators and depressive symptoms among Brazilian adolescents.In our sample,approximately 48%of participants were in the high-risk group for depression(CES-D score≥20),which far exceeds the proportion(25.5%)observed in a recent review that included 6 studies using Chinese adolescents and the same instrument and cut-off points used in our study.6We found no significant association between accelerometer-measured movement behaviors and depressive symptoms.However,daytime sleepiness,watching videos(>3.9 h/day)and using social media(≥2.0 h/day)were associated with more depressive symptoms,whereas practicing sports(but not other self-reported physical activities)was associated with fewer depressive symptoms.Overall,although qualitative aspects of these behaviors,such as the type of screen time for SB21and sleep quality,10may play a role in depressive symptoms,accelerometer-measured behaviors do not seem to have the same associations in adolescents.Thus,the lack of movement is not directly related to depressive symptoms but,rather,to what adolescents are doing while moving(e.g.,practicing sports)or not moving(e.g.,watching videos or using social media).Thisstudy supports the need to continue the use of self-reported and objectively measured movement behaviors simultaneously because self-reported instruments provide useful qualitative information(e.g.,context,content,and type)that cannot be provided by accelerometers.
In relation to accelerometer-measured MVPA and LPA,no significant associations with depressive symptoms were found in our study,a finding that concurs with other studies that analyzed accelerometer-measured PA in adolescents.18,47However,an inverse association was observed between depressive symptoms and total self-reported PA and the practice of sports but not the practice of non-sport activities.One reason for this may be that sports include activities where social interactions take place and where adolescents may have fun,which cannot be inferred from other non-sport activities or from the movement captured by accelerometers.The movement captured by accelerometers encompasses all sorts of activities,including sporadic movement and commuting.Some of these activities may not be pleasant;thus,they may not provide positive benefits to mental health.This is consistent with a previous study that found that practicing sports was associated with different dimensions of health-related quality of life,including psychological and physical well-being.28Overall,this finding indicates that it may not be the movement or exertion of vigorous activities that protects adolescents from depressive symptoms;rather,it may be contextual factors that are not captured by accelerometers.On the other hand,it is also possible that depressed individuals avoid sports due to tiredness,fatigue,or other depressive symptoms.48Longitudinal and experimental studies should investigate this further because,compared to other physical activities(e.g.,weight lifting or running on a treadmill),increasing participation in sports may be an important strategy for interventions and policies designed to prevent and treat depressive symptoms.
The absence of a relationship between accelerometer-measured SB and depressive symptoms in the present study was not consistent with the findings of other studies that associated SB with depressive symptoms.9,20,21In those studies,social media use was unfavorably related to depressive symptoms.For example,the use of social media was associated with depressive symptoms in a study with a sample of more than 10,000 adolescents in the UK.24Another study,which followed adolescents for 6 years,found that depressive symptoms were predictors of screen time throughout adolescence,9an age when individuals may engage in different types of screen time as a coping mechanism to deal with depressive feelings.As was observed for PA,our findings suggest that it is not the lack of movement that is related to depressive symptoms but,rather,what adolescents are doing while being sedentary.Based on our findings,watching videos and playing videogames were not related to depressive symptoms,whereas using social media was.This may possibly be related to the content adolescents are exposed to and how they interact with each other on social media.A previous study of more than 10,000 14-year-old adolescents observed that using social media was associated with online harassment,low self-esteem,and poor body image.24It is unlikely that these associations(e.g.,harassment)happen in the same way when using videogames and watching videos;and in this age group,excessive social media use may negatively affect depressive symptoms through these pathways.Given these findings,future interventions and policies should be based on qualitative information related to screen-time behaviors and not only on the lack of movement in relation to depressive symptoms.
In our study,sleep duration and efficiency as measured by accelerometers were not associated with depressive symptoms,a finding that differs from studies that included self-reported sleep indicators among adolescents.10,11,22However,in the present study,daytime sleepiness was associated with increased depressive symptoms,which is similar to the findings in a previous study involving depressed adult patients.32The direction of the association between depressive symptoms and sleep duration and efficiency is not clear due to the cross-sectional nature of our study;however,our findings may imply that adolescents with increased depressive symptoms may feel tired and,thus,not engage in activities that might help prevent or treat the symptoms.Daytime sleepiness may not be explained by lack of sleep itself but rather by fatigue,tiredness,and less energy,as has been observed in people with major depressive disorders.48This relationship should be addressed in longitudinal studies that include daytime sleepiness indicators as complements to sleep duration and quality.
Although accelerometer-measured movement behaviors were not related to depressive symptoms in our study,it may be that during adolescence other factors are more important than the time spent in PA,sleep,or SB.2Hormonal changes may increase sensitivity to stress and other psychosocial risk factors related to school and relationships with family and peers and play an important role in this regard.2A more complex analytical approach,with longitudinal data and measures that take into account qualitative considerations,is needed to confirm the role of movement behaviors in the cause of depressive symptoms in adolescents.In addition,findings regarding the lack of sex moderation in the relationship between 24-h movement behaviors and depressive symptoms is not consistent in the literature,and the analytical approach of future studies should address the effects of sex interaction.Overall,the findings in our study indicate that the type of activity may be more important in relation to the depressive symptoms of adolescents than the duration and intensity of the activities as measured by accelerometers.Thus,the focus of future longitudinal and experimental studies should be on daytime sleepiness,the use of social media,and the practice of sports.Also,practitioners should pay attention to these behaviors by their patients and clients.
One strength of our study lies in our use of 24-h movement behaviors,a focus not common in studies of the relationship between these behaviors and depressive symptoms.This is even more true for studies conducted in middle-income countries.An additional strength of our study is the use of standardized and validated questionnaires for measuring depressive symptoms,PA,SES,and daytime sleepiness.In addition,because no standardized cut-offs for classifying high-risk status for depressive adolescents have been established by the CES-D,we conducted additional sensitivity analyses—and the results were found to be generally consistent with our main analysis.However,among the limitations of our study is its cross-sectional design,which limits the establishment of causality.In the future,longitudinal studies are needed to improve our understanding of the relationships between movement behaviors and depressive symptoms and the possibility of bidirectionality.Also,medication use was not measured in the participants in our study,and medication use could be a potential confounding variable.The use of a novel instrument to analyze screen-time behaviors is also a limiting factor in our study;however,novel instruments are needed to help researchers and practitioners assess new ways of measuring screen interactions.A final limitation is the absence of self-reported non-screen-based variables,such as doing homework.
5.Conclusion
A large proportion of adolescents in this Brazilian sample was found to be at high risk for depression.Accelerometermeasured PA,SB,and sleep were not associated with depressive symptoms in these adolescents.However,self-reported PA and sports were a protective factor,whereas the use of social media and daytime sleepiness were associated with increased depressive symptoms.
Acknowledgments
The authors thank the participants and school staff for their voluntary participation and contribution to the study.In addition,we thank the Brazilian National Council for Scientific and Technological Development for providing funding for the ELEVA study(Grant#406258/2018-0)as well as a scholarship(LEAM).We also thank the Coordination for the Improvement of Higher Education Personnel for scholarships(BGGC and MVVL).
Authors’contributions
BGGC participated in the design of the study,contributed to data collection,reduction,and analysis,and assisted with the interpretation of the results;JPC participated in the design of the study,contributed to data analysis,and assisted with the interpretation of the results;MVVL and LEAM contributed to data collection and interpretation of the results;KSS participated in the design of the study and interpretation of the results.All authors contributed to writing the manuscript.All authors have read and approved the final version of the manuscript,and agree with the order of presentation of the authors.
Competing interests
The authors declare that they have no competing interests.
Supplementary materials
Supplementary material associated with this article can be found in the online version at doi:10.1016/j.jshs.2020.08.003.
 Journal of Sport and Health Science2022年2期
- Journal of Sport and Health Science的其它文章
- Exercise is medicine for type 2 diabetes:An interview with Dr.Sheri R.Colberg
- Application of e-health programs in physical activity and health promotion
- Exercise cardiac power and the risk of heart failure in men:A population-based follow-up study
- A physically active lifestyle is related to a lower level of skin autofluorescence in a large population with chronic-disease(LifeLines cohort)
- Bidirectional relationships of physical activity and gross motor skills before and after summer break:Application of a cross-lagged panel model
- Using compositional data analysis to explore accumulation of sedentary behavior,physical activity and youth health