Research on time-frequency cross mutual of motor imagination data based on multichannel EEG signal①
REN Bin(任 彬), PAN Yunjie
(Shanghai Key Laboratory of Intelligent Manufacturing and Robotics, School of Mechatronic Engineering and Automation, Shanghai University, Shanghai 200444, P.R.China)
Abstract At present, multi-channel electroencephalogram (EEG) signal acquisition equipment is used to collect motor imagery EEG data,and there is a problem with selecting multiple acquisition channels.Choosing too many channels will result in a large amount of calculation. Components irrelevant to the task will interfere with the required features, which is not conducive to the real-time processing of EEG data. Using too few channels will result in the loss of useful information and low robustness. A method of selecting data channels for motion imagination is proposed based on the time-frequency cross mutual information (TFCMI). This method determines the required data channels in a targeted manner, uses the common spatial pattern mode for feature extraction, and uses support vector machine (SVM) for feature classification. An experiment is designed to collect motor imagery EEG data with four experimenters and adds brain-computer interface (BCI) Competition IV public motor imagery experimental data to verify the method. The data demonstrates that compared with the method of selecting too many or too few data channels, the time-frequency cross mutual information method using motor imagery can improve the recognition accuracy and reduce the amount of calculation.
Key words: electroencephalogram (EEG) signal, time-frequency cross mutual information(TFCMI), motion imaging, common spatial pattern (CSP), support vector machine (SVM)
0 Introduction
Brain-computer interface (BCI) is a system that connects brain thinking with computers or other external devices for communication[1]. At present, BCI technology is mainly used to help people with normal brain thinking but unable to move independently and freely to complete some daily activities[2]. Motor imagery (MI) refers to a person who does not have any physical movement and directly imagines a specific limb movement through the brain, motor imagination generates an electroencephalogram (EEG). When people only imagine a particular action but do not perform it, the brain’s motor-sensory area will produce the same EEG signal as the movement performed[3].There will be event-related synchronization/desynchronization (ERD/ERS) phenomena in motor imaging EEG signals. By analyzing such signals,the imaginary’s intention can be judged, and a new way can be found to communicate between humans and the external environment[4].
At present,the EEG acquisition equipment used in clinical and research mainly uses disk-shaped electrodes. The electrodes are placed in the positions specified by the International 10-20 System. The imaginer’s intention through MI is mostly through the EEG signal,but this also has its limitations. Refs[5,6] select the C3 and C4 channels that record important MI information according to neurophysiological knowledge as MI information. This may be one of the reasons for the wrong judgment. The time, spectrum, and spatial characteristics of a small number of channels to distinguish different MI tasks cannot provide enough information to support the judgment. Using global dozens of channels to identify MI information will affect the determination of motion intention results because of taskindependent information.
Ref.[7] used all 14 channels to classify six kinds of motor imaging tasks through the common spatial pattern (CSP) feature extraction method and probabilistic neural network classification method. Ref.[8] used the C3 and C4 channels to classify the left and right hands motor imagery EEG signals by using the fuzzy Hopfield neural network clustering method, and the highest classification accuracy rate can reach 87.9%.Ref.[9] used C3, Cz, and C4 channels to extract the phase feature value through the amplitude-frequency analysis method, and used linear discriminant analysis for feature classification. In 2015, Ref.[10] used C3 and C4 channel signals to connect the rehabilitation robot with the BCI system and realized that patients use EEG signals to control the rehabilitation robot’s upper limbs. In 2017, Ref.[11] used 29 channels out of a total of 60 channels to cover the signals recorded near C3, Cz, and C4, and used 4 frequency bands for feature classification, without reducing the necessary features and reducing the computational cost. In 2018,Ref. [12] used C3 and C4 channels to propose an EEG signal feature extraction method based on local mean decomposition (LMD) and multi-scale entropy(MSE). It selected effective product function components and formed features with multi-scale entropy vector. The optimal recognition accuracy can reach 85.21%. In 2019, Ref. [13] used C3, Cz, and C4 channels to propose a capsule network (CapsNet)based on a convolutional neural network to improve the accuracy of feature classification. It obtained an average recognition accuracy of 78.44%. It is not difficult to find that most researchers use C3 and C4 channel information for the data sources of motor imagination or simply cover all channels with motor image information areas. There is no basis for the EEG data source in the case of multi-channel selection, and it will result in a waste of effective information or computing power.
1 Material and methods
1.1 Motor imagination experiment of EEG signal
The 64-lead equipment of Neuracle collected the original EEG data of the experiment (only contains the EEG data of 59 leads,and the leads with serial numbers 60 -64 are invalid). The sampling rate is 1000 Hz,and the data has been processed by 50 Hz notch. The electrode arrangement position is arranged according to the International 10 -20 System, as shown in Fig.1.The experiment’s content is to imagine using the left and right hands to press the prompt lights. The experiment interface has two reminders on the left and right. When the reminder on one side is on, imagine using that side hand to press the lit reminder. The experiment interface is shown in Fig.2. A complete experiment is a block, and each experimenter completes six blocks in three days. Each block contains continuously collected EEG data and contains 20 left and righthands random motion imagination tasks. Each imagination is a trial, and each trial has a duration of 7.5 s.In a single block, there are left and right hands imagination task 10 times each. At the beginning of the experiment, the experimenter will enter the target reminder stage. At this stage, one of the reminders will flash on the screen to remind the experimenter that this trial’ s motor imagination task is left-hand or righthand, and the duration is 1.5 s. Then it is the motor imagination stage. During the motor imagination process, the indicator light will remain on, and the experimenter will start to imagine the left or right-hand motor. After the motor imagination phase, the experimenter will have a rest period of 2 s. A Trigger signal will be recorded at the beginning and end of a single trial of motor imagery, which serves as an indicator for the sorting of experimental data. The sequence diagram of each trial experiment is shown in Fig.3.
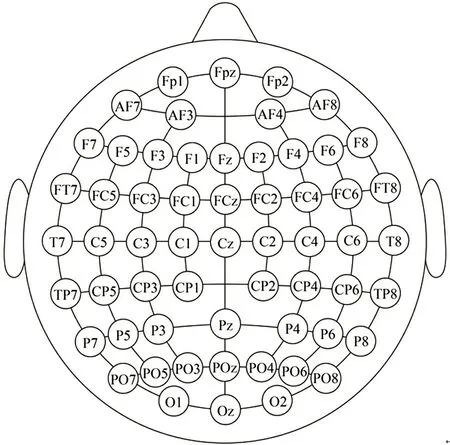
Fig.1 Schematic diagram of lead electrode placement

Fig.2 Experimental interface

Fig.3 Timing diagram of a single experiment
There are four people in this experiment as experimental subjects, named as S1, S2, S3 and S4. Each subject completed six experiments. All experimental data are resampled, and down to 250 Hz, the baseline drift is corrected, and a second-order IIR filter based on Butterworth is used to perform band-pass filtering with a passband of 8 -30 Hz[14]. The 8 -30 Hz bandpass filter can retain the characteristics of the moving image signal contained in the alpha and beta bands,and at the same time, can remove most of the electromyographic noise interference[15]. Since the electrooculogram signal as noise also exists in the 8 -30 Hz frequency band, independent component analysis is used to remove the electrooculogram signal to prevent it from interfering with the experimental results. Finally,through the Trigger logo, the data of several experiments of each experimenter are combined separately for further processing.
1.2 Time-frequency cross mutual information method to obtain relevant information
Ref. [16] proposed a method of assessing brain functional connectivity based on the time-frequency cross mutual information (TFCMI) method, which is used to analyze changes in brain connectivity in a voluntary finger-movement task. TFCMI is a calculation method that can simultaneously evaluate the correlation between linear and nonlinear components, and the method also demonstrates its better robustness than coherence analysis[17].
A method of analyzing TFCMI and EEG signal channels is proposed to obtain the correlation between each channel. Based on the correlation, specific channels are selected for analysis to achieve the purpose of reducing the amount of data. The channels related to the C3 and C4 channels can be obtained by using this method.
It is necessary to integrate the time and frequency components of the EEG signal. This work uses the time-frequency analysis method based on the wavelet transform[18]. First, the preprocessed data is subjected to wavelet transform to obtain the time-frequency power information of each channel and each frequency.Then,the power of the selected frequency band of each channel is averaged to obtain the power change over time in a specific frequency band. The corresponding wavelet transform is

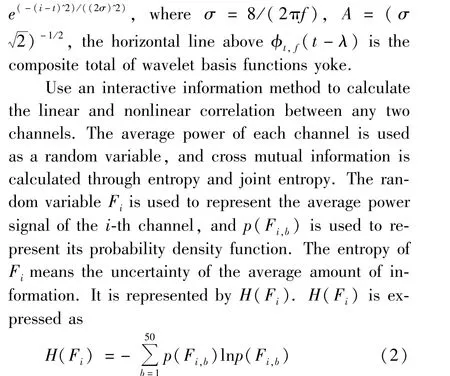
where,b= 1, …,50 represents the block index used to construct the approximate probability density function. It will avoid underestimating the entropy of larger samples and overestimating the entropy of smaller samples[19]. Its joint entropyH(Fi,Fj) is expressed as
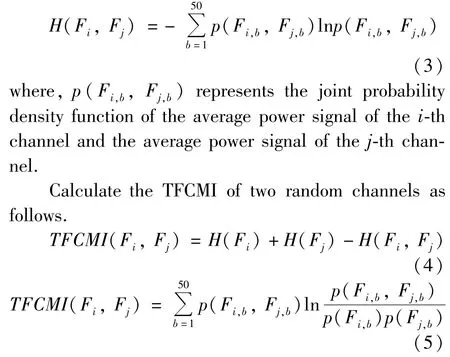
The TFCMI value is an index. It evaluates the relationship between the two channels based on the average power change and the signal-to-noise ratio of the selected frequency band. It can get the relationship between each channel through the TFCMI value. Since the experimental data consists of 59 channels, this paper can finally get a 59 ×59 TFCMI map. Because the model does not contain causal assumptions, the TFCMI mapping is symmetrical. It means the relationship between thei-th channel and thej-th channel with thej-th channel and thei-th channel are the same. Take the first block EEG data in experimenter S1 as an example. Fig.4 is a TFCMI chart. The colors of different color blocks represent the correlation between the corresponding row and column channels. The closer the color corresponding value of the color block is to 1, the higher the correlation between the row and the column channel is. Fig.5 is an EEG topographic map showing the correlation between all channels and C3 and C4 channels. Different colors represent the degree of correlation with the target channel. The closer the color value is to 1, the higher the correlation between the EEG signal in the region and the target channel is.

Fig.4 Map of TFCMI
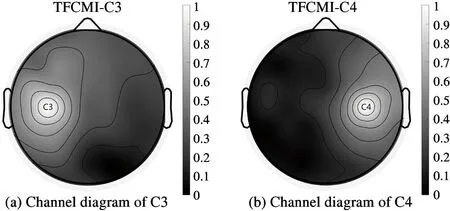
Fig.5 Map of C3 and C4 EEG channel topography
1.3 CSP feature extraction
CSP is a spatial filtering feature extraction algorithm for two classification tasks, which can extract the spatial distribution features of each category from multichannel data of BCI. The basic principle of the CSP mode algorithm is to find a set of optimal spatial filters for projection by using the diagonalization of the matrix. The variance values of the two types of signals can maximize the difference and obtain a feature vector with a higher degree of discrimination[20].
The existing two types of motor imagination tasks can be expressed asX1∈RK×NandX2∈RK×N, whereKis the number of EEG channels, andNis the number of sampling points for each channel[21]. Ignoring the influence of noise,X1andX2can be expressed as

where,S1andS2respectively represent two types of tasks, andSMrepresents a common source signal under the two types of tasks.S1is composed ofm1sources,andS2is composed ofm2sources.C1andC2are composed ofm1andm2common spatial patterns related toS1andS2.CMrepresents the shared space mode corresponding toSM.
Find the covariance ofX1andX2and normalize them as
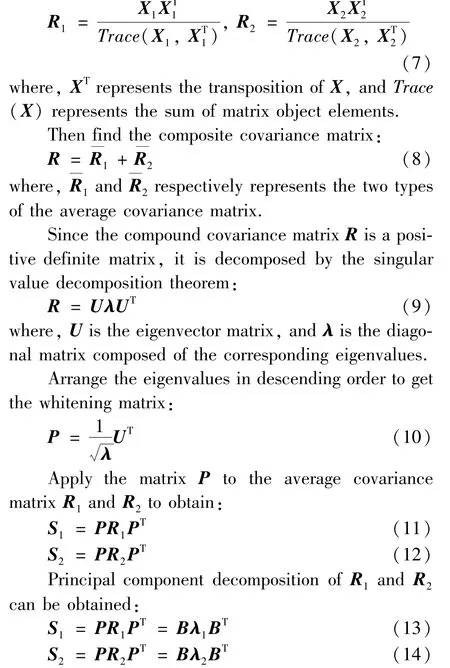
At this time,S1andS2have the same feature vector and the same feature matrixB. At the same time,the sum of the diagonal matrix of the two eigenvaluesλ1andλ2is the identity matrix. So, when the eigenvalueλof one type of signal is the maximum, the eigenvalue of the other type of signal is the minimum.
The classification of two types of signals can be realized through matrixB, and the spatial filterWcan be obtained:
The Princess, who expected to be quite alone, was pleased at finding herself surrounded by a number of pretty girls, all anxious to wait on her, whilst a brilliantly-coloured parrot said the most agreeable things in the world

The matrixZcan be obtained by inputting the motion image signal into the spatial filter. Take the firstmrows and the lastmrows of the matrixZto form the signalZp, and themis the feature selection parameter of the CSP. The original motor imaging signal is divided into a training set and a test set. According to the definition of the CSP algorithm in the multi-electrode acquisition of EEG signal feature extraction, the feature vectors representing the two task features in the training set can be represented byfp1andfp2respectively[22]:
By comparingfpiwithfp1andfp2, the task type of thei-th experiment can be determined.
1.4 Support vector machine feature classification
Support vector machine (SVM) is a supervised machine learning technology that has been widely used in data analysis. The goal of SVM is to create anm-dimensional hyperplane and find the maximum distance between classes to maximize the distinction between task features and make classification more accurate.After defining the SVM, according to the position of the task feature relative to the hyperplane in space, it is classified as belonging to a certain category or other categories. A key advantage of SVM over other classification methods is that it can classify nonlinear separable data. The reason is that by introducing a kernel function, it cleverly solves the inner product operation in high-dimensional space and thus solves the nonlinear classification problem well[23].
If an SVM is constructed with good performance,the key is to choose a kernel function suitable for the characteristics of the current task. Currently commonly used kernel functions include linear kernel, polynomial kernel, Gaussian kernel, Sigmoid kernel, and so on.
The preprocessed data is divided into a training set and test set, and the features after CSP feature extraction are input into SVM for training. The first 100 trials of each subject are classified as the training set,and the last 20 trials are classified as the test set.Using 10-layer cross-validation, the prediction of the training set model of all the subjects (Table 1) shows that the SVM based on the medium Gaussian kernel can achieve better results. Fig.6 shows the prediction results of the training set of subject A2 of BCI Competition IV 2a data set using SVM based on the medium Gaussian kernel. In the figure, 1 and 2 represent the two types of motor imaging tasks.

Table 1 SVM prediction average accuracy based on different kernel functions
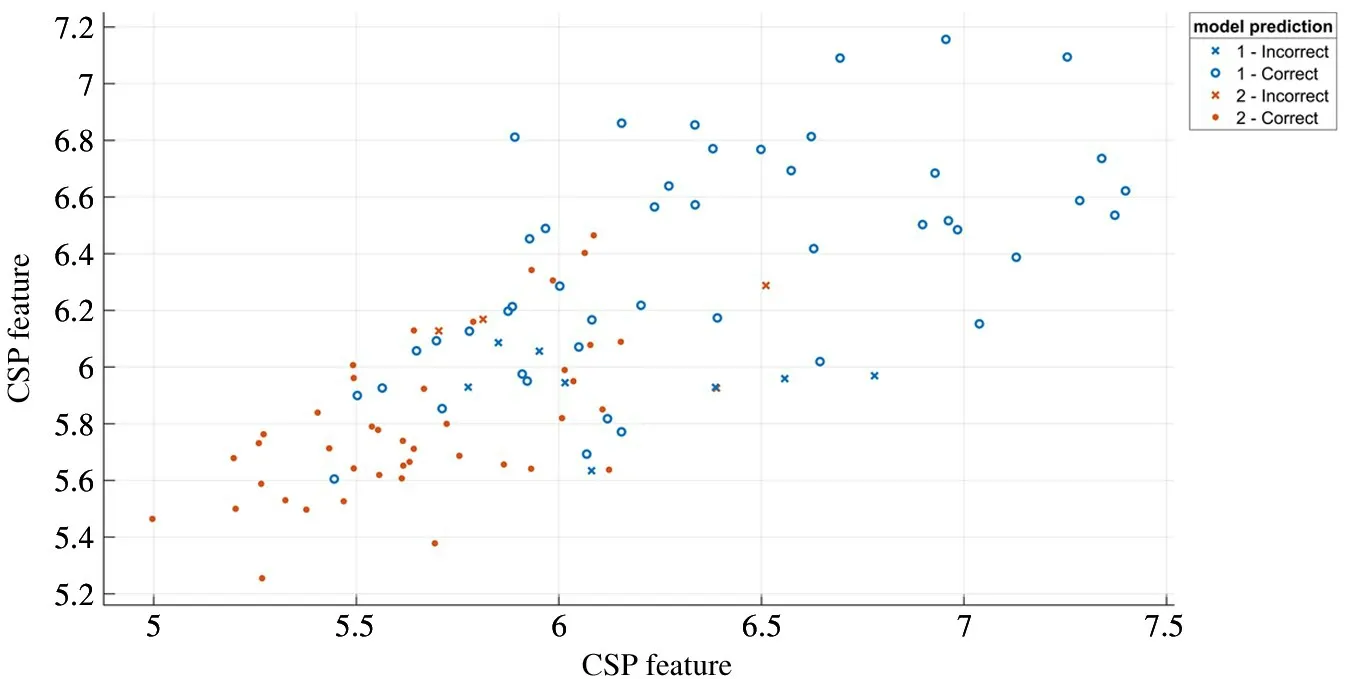
Fig.6 Subject A2 of BCI Competition IV 2a data set uses a medium Gaussian SVM to predict the results
2 Results and discussion
The method is tested on two EEG data sets. The first data set is the motion imagination experiment completed by the laboratory described above. The second data set comes from the BCI Competition IV 2a open motor imagination experiment data.
2.1 Motion imagination experiment in the laboratory
Obtain the channel information related to C3 and C4, according to TFCMI. Table 2 lists the first four channels that have the highest correlation with the C3 and C4 channels for each subject. The channels are arranged in descending order of relevance from left to right.

Table 2 Channel correlation analysis results of the laboratory’s data set
All data sets are divided into a training set and test set in the ratio of 5∶1. The 100 trials are divided into a training set, and the remaining 20 trials are divided into the test set. The test set and training set are extracted through the CSP feature, and then the training set is used to train SVM. The trained SVM is used to identify tasks on the test set. The recognition results are compared with the original experimental records,and the effects of two-channel extraction methods on the recognition accuracy of motor imagination are obtained.
2.2 BCI Competition IV 2a data set
The BCI Competition IV 2a data set contains four types of motor imagination data from 9 subjects, namely left hand, right hand, foot, and tongue. Nine subjects are numbered from A1 to A9. Each subject will complete two experiments,one for training and the other for testing. Each subject completes 288 trials in each experiment, including 72 sets of 4 types of motor imaging. The experimental data records 22 EEG channels and three monopolar electrooculogram (EOG)channels (with the left mastoid as a reference). The sequence diagram of each test is shown in Fig.7. At the beginning of a trial, a fixation cross appeared on the black screen. In addition, a short acoustic warning tone is presented. After 2 s,a cue in the form of an arrow pointing either to the left, right, down or up (corresponding to one of the four classes left hand, right hand, foot or tongue) appeared and stayed on the screen for 1.25 s. This prompted the subjects to perform the desired motor imagery task. Since the BCI Competition IV 2a data set does not give the correct label for the test set, all data in this experiment comes from the training set in the original data set[24].

Fig.7 BCI Competition IV 2a timing diagram of a single experiment
The focus of this article is to study the effectiveness of the channel selection method and does not involve the classification of multi-category features.Therefore, only the left and right hand movement imagination part of the data set is selected. Table 3 lists the first four channels that have the highest correlation with the C3 and C4 channels for each subject.
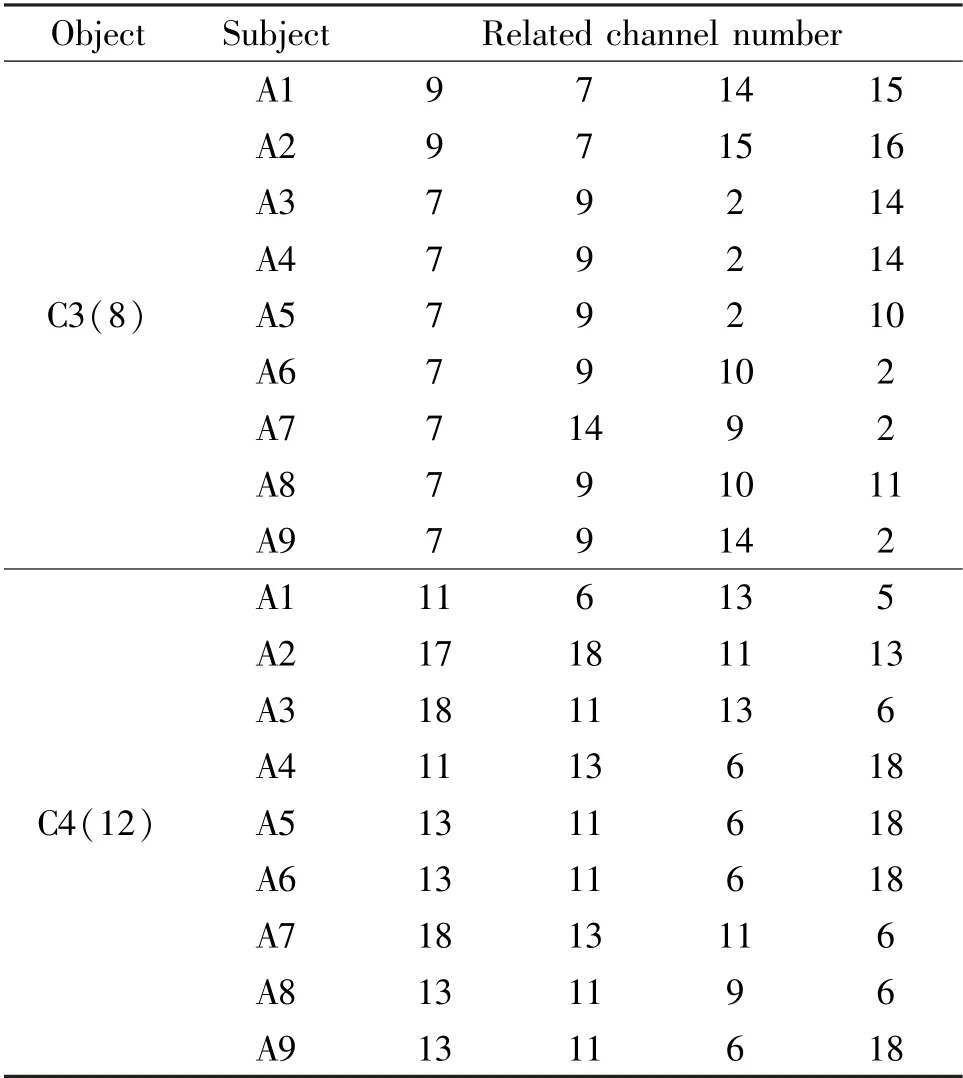
Table 3 Channel correlation analysis results of BCI Competition IV 2a data set
According to the same data processing as above,select channels with a high correlation with C3 and C4 to form a data set together. The data set contains channels numbered 2, 7, 8, 9, 14, 6, 11, 12, 13, and 18. According to the ratio of 7 ∶3, all data sets are divided into a training set and test set. The 100 trials are divided into a training set, and the remaining 44 trials are divided into a test set.
2.3 Experimental results and analysis
This paper combined the experimental results of the two data sets, a total of 13 subjects. Subjects S1—S4 are from experiments completed in the laboratory,and subjects A1—A9 are from the BCI Competition IV 2a data set. Fig.8 shows the recognition accuracy rates obtained by all subjects through different channel selection schemes.
The first column of data for each subject indicates the correct rate of using all channels for motor imaging feature classification. Subjects S1—S4 use 59 channels, and subjects A1—A9 use 22 channels. The second column of data for each subject represents the correct rate of using C3, C4, and related channels. The third column of each subject is the correct rate of using the only C3, C4 channels. It can be concluded that for most subjects, the correct rate of using C3, C4, and related channels is higher than that of using the only C3, C4 channels. In some cases, the correct rate of using C3, C4, and related channels is also higher than using all channels.

Fig.8 Comparison of correct rate of different channel selection methods
There are some reasons for the experimental results. When there are too few channels to be chosen,it may cause some useful information to be lost, and the result is insufficient robustness. When there are too many channels to be chosen, it may cause interference of information irrelevant to motor imagination in unrelated channels, resulting in insufficient feature resolution of different motor imagery tasks. Besides, the real-time calculation of large amounts of data generated by a large number of channels is not conducive to the realtime and precise requirements of the actual application of MI. The experimental results show that the selection of EEG channels through TFCMI can retain more information related to motor imagination while reducing expected data calculations and reducing the interference of irrelevant information. Therefore, it is necessary to analyze the channel correlation of motor imagery data.
This work has compared the achievements of the proposed TFCMI algorithm to those obtained with other algorithms in this field.It uses data from the BCI Competition IV 2a for comparative experiments.
The correlation-based channel selection (CCS)method is proposed to select the channels that contain more correlated information[25]. The non-negative matrix factorization (NMF) selects channels by extracting the weight of the EEG channels based on their contribution to MI detection[26]. All comparisons use the same preprocessing method, feature extraction method and feature classification method. Only the channel selection method is different, and the selected channel is also different. All three methods selected 10 channels for comparison.
The comparison results are shown in Table 4. The proposed TFCMI algorithm has more advantages. Its accuracy rate is higher than the CCS model and NMF model, and the performance is more stable.
3 Conclusions
This paper proposes a channel selection method based on TFCMI for feature extraction of multi-channel EEG signals. Tests on a data set with 59 channels and a data set with 22 channels show that compared with only C3 and C4 channels are extracted as the features of motor imagination, and the C3, C4 channels, and several related channels are extracted. Features canimprove the classification accuracy of task types to a certain extent. Compared with extracting all channels as features of motion imagination, extracting C3, C4 channels, and several related channel features can significantly reduce the amount of calculation. The classification accuracy rate does not decrease substantially.Compared with the other two channel selection methods, the channel selection method proposed in this paper has better performance.

Table 4 Performance comparison with different channel selection methods
 High Technology Letters2022年1期
- High Technology Letters的其它文章
- Deep convolutional adversarial graph autoencoder using positive pointwise mutual information for graph embedding①
- A joint optimization scheme of resource allocation in downlink NOMA with statistical channel state information①
- Personalized movie recommendation method based on ensemble learning①
- An improved micro-expression recognition algorithm of 3D convolutional neural network①
- Resonance analysis of single DOF parameter-varying system of magnetic-liquid double suspension bearing①
- Computation offloading and resource allocation for UAV-assisted IoT based on blockchain and mobile edge computing①
