Recognition of prognostic biomarker and its association with immune infiltrates in breast cancer associated with inflammation
Shun Wang , Zhi Li Hua Zhang Qun Wang
1Department of General Surgery, Taihe Hospital, Hubei University of Medicine, Shiyan 442000, China.2Shiyan Taihe Hospital Graduate Training Base, Jinzhou Medical University, Jinzhou 121001, China.
Abstract
Objective: To identify prognostic biomarkers in breast cancer (BRCA) associated with inflammation.Materials and methods: WGCNA was used to identify prognostic biomarkers in BRCA based on TCGA-BRCA and GSE70947 datasets.GO and KEGG exploration was made to analyze the specific mechanisms of interest genes.Results: There were 9 modules in TCGA-BRCA and 19 modules in the GSE70947 constructed and 639 overlapping genes extracted.There were ten genes recognized as hub genes, SAA1 and CXCL2 were identified as key genes.Furthermore, we found that SAA1 and CXCL2 were positively related to the levels of tumor-infiltrating immune cells in BRCA with TIMER.Conclusions: SAA1 and CXCL2 is highly correlated with BRCA and its prognosis was greatly related to TIICs.
Keywords: breast cancer (BRCA); inflammation; prognostic biomarker; tumor-infiltrating immune cells
Introduction
Breast cancer (BRCA) is the most ordinary malignancy in females and the second most deadly tumor followed by lung cancer around the world over 100 countries [1].Recent years we have witnessed a great progress for comprehensive treatment of breast cancer, but its characteristics of invasive growth and metastasis are still one of the important causes of death [2, 3].With the development of the treatment methods and the treatment effect of breast cancer, the overall prognosis has been greatly improved, however the outcome of some patients is still not very good [2-4].Therefore, the research on genes assoiatd wih the prognosis of BRCA associated with inflammation is of great significance for the evaluation of patients'condition and survival.
At present, evidences have showed that the tumor stage, lymph node metastasis and tissue differentiation are correlated with the prognosis of breast cancer [5].Recently, with the progress of study of tumor immune microenvironment (TIME) and immunotherapy, it is believed that TIME is closely relevant to the appearance, growth and the prognosis of cancer, and the immunotherapy has been successful in solid tumors [6].Early studies have confirmed that inflammatory answer and immune cell infiltration are one of the important features of cancer, influencing the prognosis of cancer to a large extent [7, 8].Nevertheless, the association between BRCA with inflammation and immune cell infiltration has not been clearly elucidated yet.
As a systematic biology-based method, weighted gene co-expression network analysis (WGCNA) is extensively adopted in analyzing gene expression data, establishment of gene expression network, and the acquisition of hub genes [9-11].It can be adopted for detecting co-expression modules of greatly correlated genes and interested modules correlated with clinical features, offering a clear guidance direction into forecasting the roles of co-expression genes and seeking genes with core effects on human diseases.WGCNA has been extensively used in biological fields including acute myeloid leukemia[12], hepatocellular carcinoma [13], schizophrenia [14], coronary artery disease [15].
In this study, hub genes of BRCA samples mined from the Cancer Genome Atlas (TCGA) and Gene Expression Omnibus (GEO) databases were screened with WGCNA.Taken together, this research aims at identifying hub genes correlated with BRCA associated with inflammation and further analyzing its prognostic meaning correlation with the tumor infiltrating immune cells (TIICs).
Materials and methods
Data mining in the TCGA and GEO database
Figure 1 shows the study flowchart.The TCGA database(https://portal.gdc.cancer.gov/) [16] offered the gene expression profiles of 1053 breast cancer tissues and 111 normal breast tissues,and the expression profiles of GSE70947 consisted of 148 samples of BRCA tissues and matched the nearby normal breast tissues associated with age and estrogen-dependent inflammation were originated from GEO database (https://www.ncbi.nlm.nih.gov/geo/) [17].By using limma (linear models for microarray data) package [18] and edgeR(Empirical Analysis of Digital Gene Expression Data in R) package[19] standardized the raw data from our included study and identified genes differentially expressed in breast cancer versus normal breast tissue.| log2 (fold variation) | > 1 and modifiedPvalue < 0.05 were defined as the limit.Then, the differences of gene expression in the TCGA and GEO data were analyzed, and the differences were visualized by pheatmap package [20] and ggplot2 package [21]respectively, which were described by heat map and volcano map respectively.
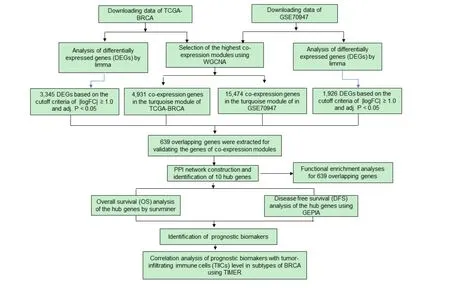
Figure 1 Study flowchart
Identification of key co-expression modules on basis of WGCNAIn order to identify and screen out various modules of co-expressed genes and screen out promoising biomarkers, a gene co-expression network was set up applying the WGCNA package [22] with the false detection rate < 0.05, and WGCNA analysis included log2 fold change≥ 0.5.Modules with high correlation co-efficient were chosen for follow-up analysis.
Differential expression analysis and mutual effect with the interest modules
The limma package was adopted in the datasets to filter the differentially expressed genes (DEGs),and to find DEGs between breast cancer tissues and 111 normal breast tissues.To recognize potential hub genes, subsequently, the DEGs were extracted from the WGCNA network,that were revealed as a Venn diagram applying the VennDiagram package [23].
Functional enrichment analyses for genes of interest
To investigate the functions among the interest genes, both gene ontology (GO) functional enrichment and Kyoto Encyclopedia of Genes and Genomes (KEGG) pathways analyses were made on cluster Profiler and enrichplot packages, with a cut-off standard of modifiedP< 0.05 [24].GO functional enrichment analysis can analyze the biological attributes of genes for all organisms, that contains the cellular component (CC), biological process (BP), and molecular function (MF) [25].Then, the KEGG pathway analysis method was made to discern functional properties of interest genes [26].Significance was set atP< 0.05.
Establishment of PPI and recognition of hub genes
The protein-protein interaction (PPI) network was executed applying STRING (Search Device for Retrieving Interacting Genes) website(Version: 11.0, https://string-db.org/) [27].Using the database, genes with protein interaction scores ≥ 0.9 were selected to set up a network.Then, Cytoscape software (Version: 3.7.0) [28] was adopted to find hub nodes by Maximal Clique Centrality (MCC) algorithm [29].The genes of the top 10 MCC values were visualized with CytoHubba app of Cytoscape, considered as hub genes.
The prognostic values of hub genes in BRCA patients
Survminer package was adopted to create an overall survival (OS)Kaplan-Meier curve [30] to investigate the correlation between the expression of hub genes and the prognosis of breast cancer patients.Then, the relationship between disease-free survival (DFS) and the expression degree of hub genes was analyzed with the Gene Expression Profiling Interactive Analysis (GEPIA) database(http://gepia.cancer-pku.cn/index.html).The prognosis of hub genes was tested by Kaplan-Meier survival estimation, and Log-rank test was adopted to analyze the survival outcomes.P< 0.05 was of statistical significance [31].
Correlations between the prognostic biomarkers and tumor-infiltrating immune cells
We analysed expression of the hub genes related to prognosis in BRCA and its association with tumor-infiltrating immune cells (TIICs) [32]with the Tumor Immune Estimate Resource (TIMER) database (Version: 2.0,http://timer.cistrome.org/).The expression of key genes and its relationship with the abundance ratio of six TIICs, that contain B cells, CD4+ T cells, CD8+ T cells, neutrophils, macrophages and dendritic cells were analyzed with this tool.The correlation analysis was evaluated with the Spearman method.P< 0.05 was of statistical significance.
Results
Differential gene expression analysis of TCGA-BRCA and GSE70947
To obtain an insight into the gene expression difference, a differential expression genes (DEGs) exploration was executed to contrast the gene expression between tumor tissues and normal breast tissues of TCGA-BRCA and GSE70947 datasets.The TCGA-BRCA dataset contained 1,053 breast cancer tissues and 111 normal breast tissues,and GSE70947 dataset include 148 samples of tumor tissues and ordinary breast tissues.Figure 2, Figure 3 show the DEGs degrees between the tumor tissues and normal breast tissues in TCGA-BRCA(counts 3,345) and GSE70947 datasets (counts 1,926).

Figure 2 Identification of DEGs in BRCA.The genes expression differences of the TCGA-BRCA and the GSE70947 datasets were visualized as volcano plots respectively.(A) Volcano plot of TCGA-BRCA.(B) Volcano plot of GSE70947.

Figure 3 The genes expression differences of the TCGA-BRCA and the GSE70947 datasets were visualized as heatmaps respectively.(A) Heatmap of TCGA-BRCA.(B) Heatmap of GSE70947.
Establishment of weighted gene co-expression modules
There were 9 modules in TCGA-BRCA and 19 modules in GSE70947 recognized.The outcomes of the module-trait correlations showing that the turquoise module in the TCGA-BRCA highest correlated with the normal breast tissues (turquoise module: r = 0.75,P= 1e-211),and the turquoise module in the GSE70947 (turquoise module: r =0.66,P= 4e-39) (Figure 4, 5).

Figure 4 Identification of modules related to clinical data in TCGA-BRCA with WGCNA.Each cell contains the corresponding correlation and P-value.The co-expression network modules were clustered according to gene hierarchical clustering, the cluster tree was classified, and different colors were assigned to each module.Each row corresponds to a color module, and each column corresponds to a clinical feature (cancer and normal).Each cell contains the corresponding correlation and P value.(A) Cluster dendrogram of TCGA-BRCA.(B) Module-trait relationships of TCGA-BRCA.
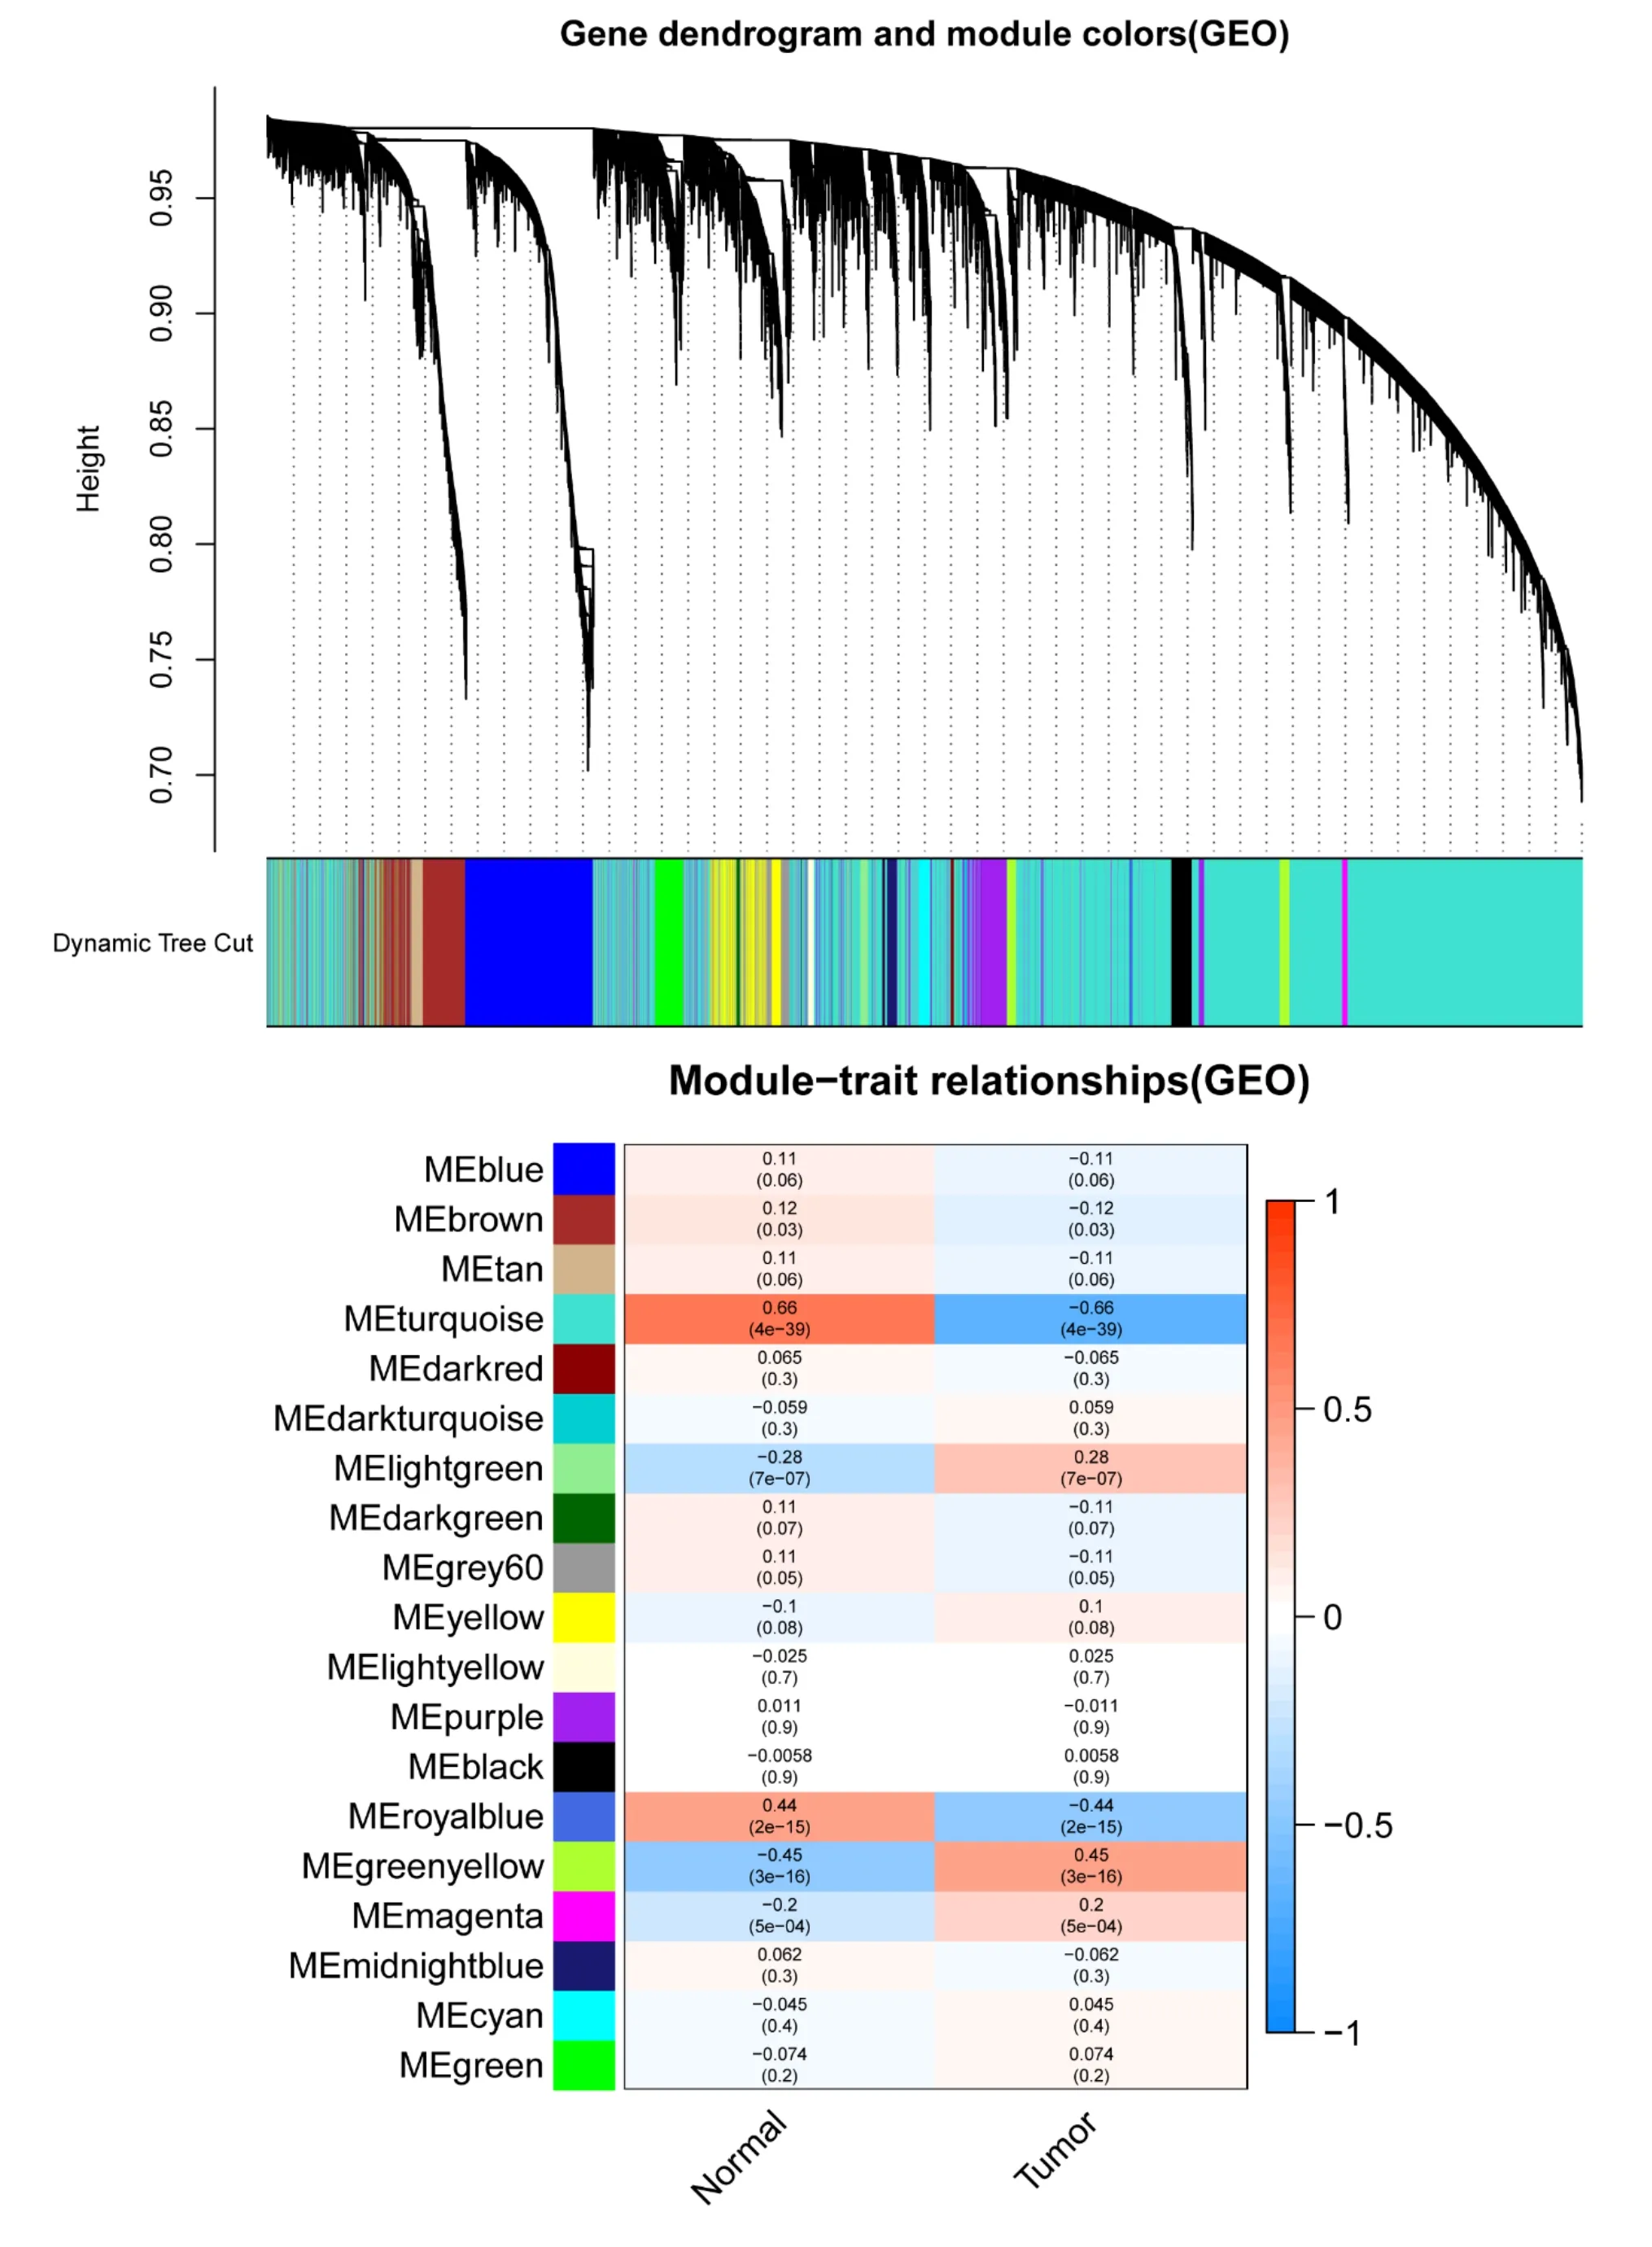
Figure 5 Identification of modules related to clinical data in GSE70947 with WGCNA.(A) Cluster dendrogram of GSE70947.(B) Module-trait relationships of GSE70947.
Recognition of genes between the DEGs lists and co-expression
There were 3,345 DEGs in the TCGA-BRCA dataset and 1,926 DEGs in the GSE70947 dataset to be dysregulated in breast cancer tissues.As shown in Figure 6, there were “4,931 and 15,474” co-expression genes in the turquoise module of TCGA-BRCA dataset and the turquoise module in GSE70947.There were 639 overlapping genes chosen for verifying the genes of co-expression modules.
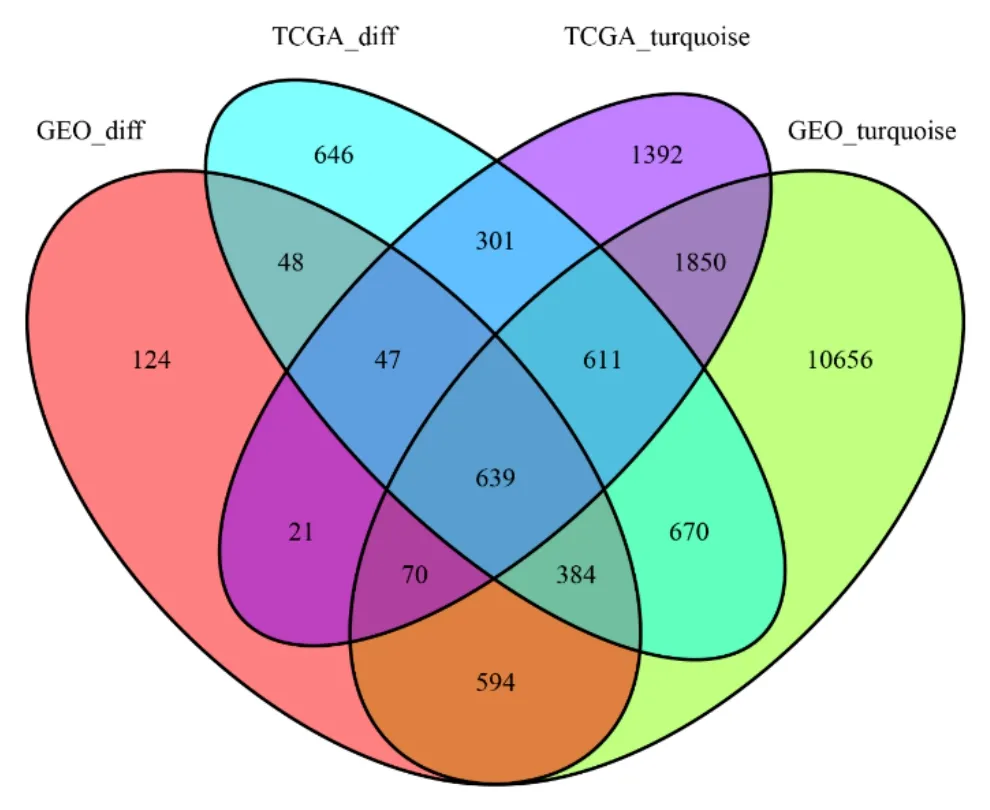
Figure 6 Recognition of DEGS in TCGA and GSE70947 datasets.Venn diagram of genes between DEG table and coexpression modules.
Functional reinforcement analyses for the interest genes
The further clustering of top 10 (scoped by Count) reinforcement outcomes in GO and KEGG analysis was made, and bubble plots were employed to view top 10 outcomes.On basis of GO exploration, the interest genes mostly took part in regulating fatty acid metabolic process, the lipid metabolic process, multicellular organismal homeostasis, cell-cell junction, and actin binding (Figure 7A).KEGG pathway analysis revealed that interest genes were primarily reinforced in the fatty acid degradation, tryptophan metabolism, and pyruvate metabolism (Figure 7B).

Figure 7 Functional enrichment analysis of DEGs.(A) Gene Ontology (GO) analysis for DEGs.(B) KEGG pathway analysis for DEGs.
PPI network establishment and recognition of the hub genes
A PPI network was constructed with the STRING database among overlapped genes, with 639 nodes and 579 edges (Figure 8A).The genes with the top 10 MCC values were regarded as hub genes, namely, G protein subunit gamma 11 (GNG11), GNG2 (G protein subunit gamma 2), Serum amyloid A1 (SAA1), Annexin A1 (ANXA1),Lysophosphatidic acid receptor 2 (LPAR2), Neuromedin U receptor 1(NMUR1), Adenylate cyclase 5 (ADCY5), G protein subunit alpha I 1(GNAI1), C-X-C motif chemokine ligand 2 (CXCL2), Cannabinoid receptor 1 (CNR1) (Figure 8B).

Figure 8 Construction of protein-protein interaction (PPI) network and identification of hub genes.(A) PPI network of genes between the DEG list and two co-expression modules.The blue nodes represent genes, and the edges represent interactions between nodes.(B) Identification of hub genes using maximum cluster centrality (MCC) algorithm using Cytohubba, the Cytoscape plug-in.The edges show the connections between proteins.The red lymph nodes represent the high ulcer gene of MCC, and the yellow lymph nodes represent the low ulcer gene of MCC.
The prognostic values of hub genes in BRCA patients
To estimate the prognostic values of hub genes in BRCA, we performed survival analysis using survminer package and GEPIA database.Survival analysis displayed that CXCL2 and SAA1were positively related to the poor prognosis (CXCL2P= 0.006; SAA1P=0.003),and the other eight hub genes were of no statistical significance(NMUR1P= 0.250; GNAI1P= 0.632; GNG2P= 0.509;GNG11P= 0.528; LPAR2P= 0.623; CNR1P= 0.839; ANXA1P=0.423; ADCY5P= 0.908)(Figure 9).In addition, all of the hub genes played no significant role in DFS in BRCA (Figure 10).

Figure 9 Overall survival (OS) analysis of the ten hub genes in.(A) ADCY5; (B) ANXA1; (C) CNR1; (D) CXCL2; (E) GNAI1; (F) GNG2; (G) GNG11; (H) LPAR2; (I)NMUR1; (J) SAA1.

Figure 10 Disease-free survival (DFS) analysis of 10 BRCA hub genes in the GEPIA2 database.Patients were divided into high level (red) and low level (green)groups based on median gene expression.Log-rank P < 0.05 indicates that the difference is statistically significant.(A) ADCY5; (B) ANXA1; (C) CNR1; (D) CXCL2; (E)GNAI1; (F) GNG2; (G) GNG11; (H) LPAR2; (I) NMUR1; (J) SAA1.
Correlations between the prognostic biomarkers with TIICs
For exploring the association between TIICs into the tumors and the expression of the prognostic biomarkers, we analyzed the correlations between the prognostic biomarkers and tumor purity and six immune cell kinds (CD4+ T cells, B cells, CD8+ T cells, macrophages,neutrophils, and dendritic cells) applying the TIMER database.The results revealed that CXCL2 (Figure 11) and SAA1 (Figure 12) were positively correlated with TIICs.
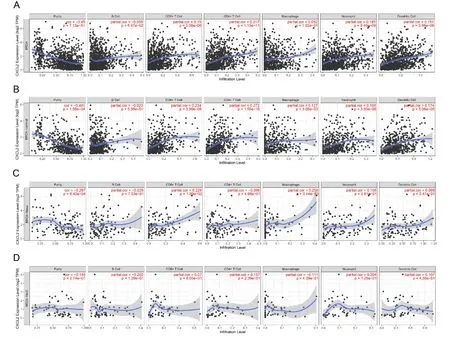
Figure 11 Correlation analysis of CXCL2 with tumor-infiltrating immune cells (TIICs) level in subtypes of BRCA (BRCA-Luminal, BRCA-Basal, and BRCA-Her-2 positive) using TIMER.(A) BRCA.(B) BRCA-Luminal.(C) BRCA-Basal.(D) BRCA-BRCA-Her-2 positive.

Figure 12 Correlation analysis of SAA1 with tumor-infiltrating immune cells (TIICs) level in subtypes of BRCA (BRCA-Luminal, BRCA-Basal, and BRCA-Her-2 positive) using TIMER.(A) BRCA.(B) BRCA-Luminal.(C) BRCA-Basal.(D) BRCA-Her-2 positive.
Discussion
Breast invasive cancer (BRCA) is the most common malignancy in women [33].Traditional treatment methods, mainly includes surgery,chemotherapy, radiotherapy, targeted therapy and endocrine therapy,that usually offer poor prognosis.Currently, many clinical studies have done with respect to immunotherapeutic in BRCA, it is of importance to learn more about the immune infiltration and novel BRCA immune-related biomarkers that correlate with immunotherapy[34].
The current research recognized 639 overlapping genes for BRCA by WGCNA, based on TCGA-BRCA (contained 1,053 cases) and GSE70947 (consisted of 148 samples) datasets.Compared to previous studies that only analyzed the DEGs, our work carefully distinguished that TCGA-BRCA and GSE70947 datasets were used for joint analysis.On basis of the GO and KEGG pathway reinforcement exploration, the DEGs mostly took part in regulating the lipid metabolic process, fatty acid metabolic process, and fatty acid degradation.Altered lipid metabolism is a common auxiliary pathway for increased glycolysis dependence in breast cancer cells, which is a novel characteristic of aggressive breast cancers [35].Lifestyle-related risk factors,particularly excess fatty acids, have been recognized as main risk elements for the growth of BRCA [36].The adipose dysfunction is charge of enhanced cell growth and cancer cell survival during the process of coordinating immune cells and inflammation.More recently, there is also evidence that obesity is a hidden risk element for chemotherapy resistance [37].Our results could help elucidate the potential mechanism of the role of fatty acid composition in BRCA obesity-linked drug resistance in BRCA.
In addition, we identified 10 pivot genes by PPI network analysis and Cytoscape software, that were considered as hub genes, including GNG11, GNG2, SAA1, ANXA1, LPAR2, NMUR1, ADCY5, GNAI1,CXCL2, CNR1.According to our prognostic analysis, the low expression of SAA1 or CXCL2 is related to the poor prognosis in BRCA patients.These results show that SAA1 and CXCL2 can serve as potential prognostic markers for BRCA.Inflammatory asnwer and immune cell infiltration are one of the important characteristics of cancer, which in turn affect the progression and prognosis of cancer[7, 8].
The serum amyloid A (SAA) forms a family that is highly conserved in many species ranging, from fish to humans [38, 39].There were four unique SAA genes, that is SAA1, SAA2, SAA3, and SAA4 in humans.Literature has published a number of bioactivities attributed to SAA1, whose primary functions include pro-inflammatory properties [40, 41], induction and enrollment of various cell kinds,such as various leukocyte subsets [42], and possess antimicrobial activity [43], induce anti-inflammatory effects [44].SAA1 are associated with various diseases such as inflammatory diseases,infection and cancers.We poorly understand the signature profile of SAA1 in BRCA [45, 46].Research by Ignacio et al shows that proinflammatory tumor microenvironment in TNBC could be predisposed by SAA1, resulting in aggressiveness of TNBC [47].Here,we identified SAA1 as a prognostic marker for BRCA and analyzed its prognostic significance association with TIICs.
The C-X-C motifs chemokine ligand 2 (CXCL2) is part of the chemokine superfamily and encodes secreted proteins, that took part in immune control and inflammatory processes [48-50].CCL2 exerts a significant effect on initiating and progressing cancer, that was related to strengthened expression of a development element with an ability to augment tumor cell development [51, 52].In addition, the present study found that alkylation agent exposure induces the expression of various inflammation-related genes, including CXCL-2, and thus affects the cancer cell secretion group and tumor microenvironment in vitro [53, 54].The progress of BRCA may be closely related to chronic inflammation because of the effect of inflammatory elements on genetic instability and follow-up cancer susceptibility [55].Inflammation-related genes exert various effects on the appearance and growth of BRCA such as boosting cell propagation, differentiation,tumor metastasis, and fine-tuning the inflammatory microenvironment of tumor tissue [56, 57].Recent evidence points to multiple pathways by which inflammation-related genes, including CXCL2, are involved in BRCA development as potential biomarkers and therapeutic targets [58].
This study is limited to the bioinformatics analysis of current data.In addition, functional studies of key genes are needed.Finally,molecular biology and animal experiments are needed to verify our findings.
Conclusion
This research constructed a co-expression network with WGCNA method to explore the hub genes related to BRCA associated with inflammation, and TCGA-BRCA and GSE70947 datasets were used for joint analysis.Our findings revealed that SAA1 and CXCL2 was highly correlated with BRCA associated with inflammation and its prognostic significance was positively correlated with TIICs, which may enhance our basic knowledge of the molecular mechanisms of the disease.
 Precision Medicine Research2022年1期
- Precision Medicine Research的其它文章
- Advances in Mig6 gene in tumor research
- Clinical research progress of first-line immunotherapy for extensive-stage small cell lung cancer
- Identification of nasopharyngeal carcinoma-related microRNAs based on weighted gene co-expression network analysis
- Predictive value of initial procalcitonin level in perioperative period of critically ill cancer patients
