
Changes in segment coordination variability and the impacts of the lower limb across running mileages in half marathons:Implications for running injuries
2022-03-24 02:36:18TonyLinWeiChenDuoWiChiWongYnWngQitoTnWingKiLmMingZhng
Tony Lin-Wei Chen,Duo Wi-Chi Wong,Yn Wng,Qito Tn,Wing-Ki Lm*,Ming Zhng,*
a Department of Biomedical Engineering,Faculty of Engineering,Hong Kong Polytechnic University,Hong Kong SAR 999077,China
b Li Ning Sports Science Research Center,Li Ning(China)Sports Goods Co.Ltd,Beijing 101111,China
c Hong Kong Polytechnic University Shenzhen Research Institute,Shenzhen 518057,China
d Department of Kinesiology,Shenyang Sports Institute,Shenyang 110102,China
Abstract
Keywords: Coupling angle;Endurance running;Motion capture analysis;Musculoskeletal modeling;Vector coding technique
1. Introduction
Participation in marathon running events has increased worldwide by more than 50%between 2009 and 2019.1The total number of finishers competing at various marathon events reached 1.2 million in 2019.2Additionally, more runners participated in half-marathon or 10-km races than in full-marathon races.3Running offers many benefits because it is easily accessible and promotes physical fitness while being preventive against chronic diseases.4However,a long-distance run such as a marathon may not be suitable for everyone, particularly for those who have chronic cardiovascular diseases and are vulnerable to joint problems.4It is thought that every runner possesses his or her own“preferred running pattern”5that is energetically efficient and better attenuates the impact to the lower limb. Nevertheless, maintaining this movement pattern during an endurance run can be challenging.6Changes in movement patterns can occur as mileage accumulates, which compromises force absorption7,8and,thus,relates to overuse injury.6,9
To date, discrete kinematic variables have been used predominantly to identify the attributes of movement patterns in various sports.10However, existing studies investigating lower-limb joint or segment angulation in endurance runs have reported inconsistent outcomes.11-16 Indeed, joint or segment kinematics in isolation neither reflect effectively how the underlying segments are coordinated to produce resultant angular positions,17nor do they provide a holistic view of the role of running-induced exertion in altering movement patterns.18Prolonged physical activities have been found to disrupt neuromuscular synergies and inter-segment coordination spanning the joints,which is reflected by changes in the coordination pattern and its stride-to-stride variances over time.19
Coordination patterns can measure the timing and magnitude of relative motions between 2 body parts in any given task.20Coordination variability (CV) quantifies the degrees of fluctuation in the coordination pattern.20In recent decades, the CV of lower-limb couplings between adjacent joints or segments has received increasing research interest due to its potential link to injury. Although the underlying mechanism is not fully understood, changes in CVs during physical activities have been seen commonly in injured persons.21Compared to healthy subjects,individuals with symptoms or injury histories tended to deviate from the “normal” CV range, which either increased18,22-25 or decreased23,26-28 in coordinate couplings that were hypothesized to be associated with the injured or painful regions.An example of this is knee pain and ankle instability.The changed CVs were considered to be an unstable compensatory movement strategy to avoid load on sensitized or painful regions.29,30However, for increased CVs,another explanation is that the injured group may have decreased neuromuscular control, leading to poorly regulated movement coordination.21,31We found this viewpoint intriguing because reduced neuromuscular control was also seen in healthy but fatigued people undergoing endurance runs,32-35 which likely exacerbated loading on the lower limb and increased injury risks.8,36,37Accordingly, it was anticipated that runners would increase their lower-limb CVs across different time points in an endurance run such as a half marathon. Previous relevant research was scarce,so a study was needed to provide supporting evidence for this hypothesis.
Hence, this study aimed to investigate the CVs of segment couplings of the lower limb and ground reaction loading for healthy runners at various distance checkpoints during a half marathon. The segment couplings were analyzed using angle-angle plots,and their coordination variabilities were quantified by a modified vector coding technique.38As mentioned,it was hypothesized that the CVs of the selected segment couplings and the loading rates of the vertical ground reaction force would increase as mileage accumulated during the half marathon.
2. Methods
2.1. Participants
A total of 15 recreational runners (13 males, 2 females,age=26.85 § 6.02 years, height=1.75 § 0.08 m,weight=64.50 § 9.26 kg; mean § SD) were recruited from the local community by using flyers and posters. Of the runners, 13 were rearfoot strikers (foot strike index:6.18%-25.74%), and the other 2 were midfoot strikers (foot strike index:39.88%-46.98%).The foot strike index was calculated by averaging 10 strides from each runner’s running trials at the 2-km checkpoint in the half marathon.39The participants had finished at least 3 marathon races annually for more than 2 years and reported no lower-limb injuries at the time of experiment entry based on consensual standards.40The sample-size calculation showed that 15 participants ensured a statistical power of 0.8, assuming a medium effect size and a significance level of 5%.The participants were fully informed of the research procedure, and they signed a written consent form before the study’s commencement. The study was reviewed and approved by the Human Subjects Ethics Sub-Committee of the Hong Kong Polytechnic University (reference#HSEARS20170327001).
2.2. Experiment protocol
All running trials were conducted on a treadmill instrumented with 2 force platforms(Bertec,Columbus,OH,USA).The participants were given sufficient time to warm up and acclimate themselves to the research protocol. They were asked to use their own running shoes for the tests and to identify a comfortable running speed before the commencement of data collection. Each runner ran on the treadmill at a starting speed that they normally adopted for daily training.An investigator operated the instrument on a remote computer and finetuned the treadmill speed based on the runner’s feedback.The procedure was repeated until runners found a comfortable speed at which they could be confident about finishing a half marathon on the treadmill.41
To facilitate motion capture, a total of 28 markers were attached to the following anatomical landmarks:42acromioclavicular joints, between clavicles, seventh cervical, posterior/anterior iliac spines, lateral femoral epicondyles,lateral malleoli, calcaneal tuberosity, the heads of the first and fifth metatarsals, and the tip of the toe. Two additional markers were placed on the upper and lower thirds of the side of the thigh and shank segments, respectively. The marker set ensured that at least 3 markers were assigned to each segment of interest to enable 3-dimensional motion tracking and were also accommodated to the OpenSim environment. All markers were secured with skin-medical tape (Kinesio Tex Classic; Kinesio, Albuquerque, NM,USA) to avoid drop-off while running. Markers of the foot region were placed directly on the shoes.43
Data collection began with a static calibration trial that was later used to scale an established musculoskeletal model. The participants then ran on the treadmill at their preferred speed for a half marathon.Kinematic and kinetic data were recorded for 10 s at every 2 km.To exclude the initial effects,data collection was started at 2 km and ended at the 20-km checkpoint.An optical-based motion-capture system with 10 cameras(T20; Vicon Motion Systems, Oxford, UK) and 2 force plates were synchronized to measure the marker trajectories and ground reaction forces at sampling rates of 250 Hz and 1600 Hz,respectively.
2.3. Musculoskeletal model
In the study, segment angles of interest were calculated using an established musculoskeletal model.42The model featured 12 rigid body segments, 23 degrees of freedom, and 92 musculotendinous units.It had a ball-and-socket joint at the hip and permitted hinge joints at the knee,ankle,subtalar,and metatarsophalangeal. The raw kinematic data were first lowpass Butterworth filtered at 8 Hz44and put into the OpenSim platform (Version 4.0; OpenSim, National Centre for Simulation in Rehabilitation Research, Stanford, CA, USA). The generic model was scaled to the participant’s geometry using the data from the static trials.Inverse kinematics45were implemented on the data of running trials to calculate the joint coordinates that best reproduced the movement patterns. Segment angles of the pelvis,thigh,shank,and rearfoot were expressed as the orientation of the segmental reference frame (fixed to the segment) with respect to the global coordinate system.38The segmental reference frames were aligned with the global frame at a neutral position, and their locations were defined previously.46Data for segment angles were normalized to the standard standing position.47
2.4. Data reduction and outcome measures
For each running gait cycle, data for segment angles were truncated to the stance phase and normalized to 101 time points.48Inter-segmental coordination was calculated from angle-angle plots of the couplings of interest, with the proximal segment comprising the abscissa and the distal segment comprising the ordinate.28The coupling angle(gi)was defined as the angle with respect to the right horizontal axis created by the vector connecting the 2 consecutive time points (Eq. 1).47A modified vector coding technique38was employed in this study:
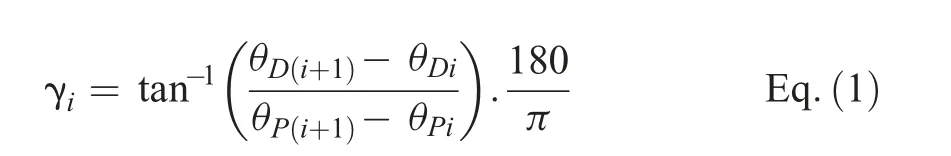
where i is the ith point of the stance phase.uDand uPrepresent the angles of the distal and proximal segments. Segment couplings of interest(Fig.1)included pelvis frontal plane vs.thigh frontal plane,pelvis sagittal plane vs.thigh sagittal plane,thigh sagittal plane vs. shank sagittal plane, shank sagittal plane vs.rearfoot sagittal plane, and shank transverse plane vs. rearfoot frontal plane. These couplings were selected because they were closely related to the lower-limb loading response and injury development during running (e.g., the couplings of pelvis frontal vs. thigh frontal for iliotibial band syndrome and thigh transverse vs. rearfoot frontal for rearfoot overpronation).13,49,50
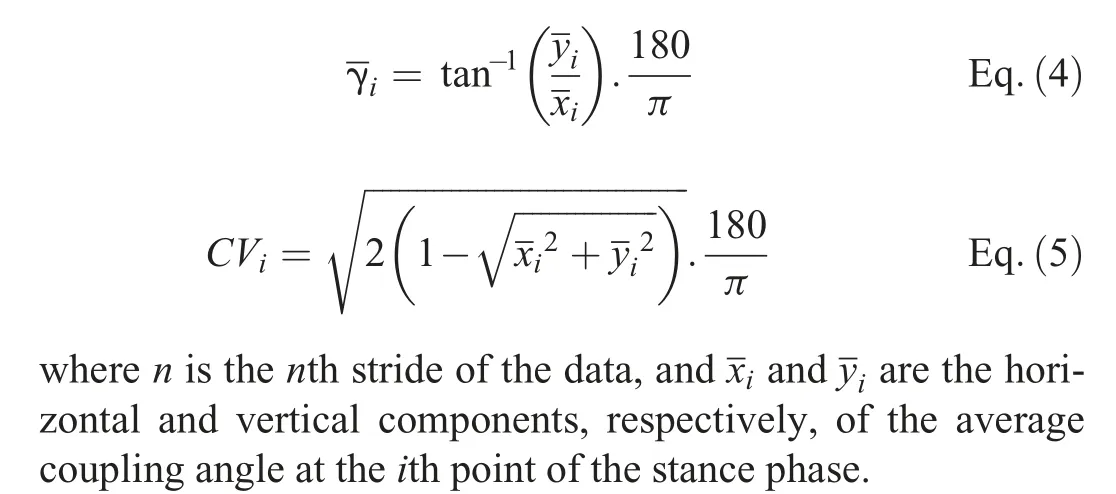
Using circular statistics,51coordination variability (CVi)was calculated as the circular SD of the coupling angle at the ith point of the stance phase across 10 strides of data (Eqs. 2-5). This circular standard deviation was averaged across the following stance phases: early (first 24% of the stance phase), mid (25%-50% of the stance phase), and terminal stance (51%-100% of the stance phase).52
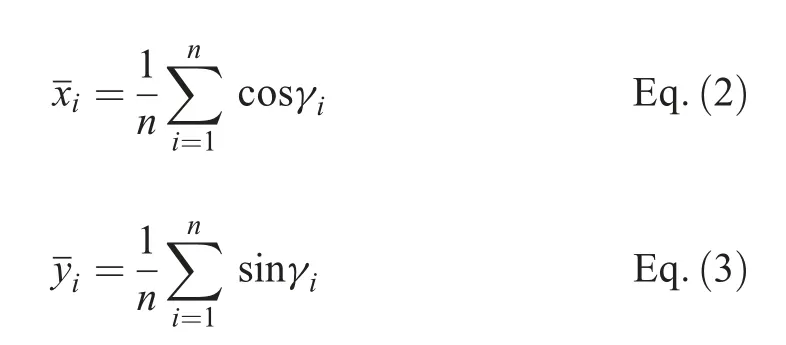
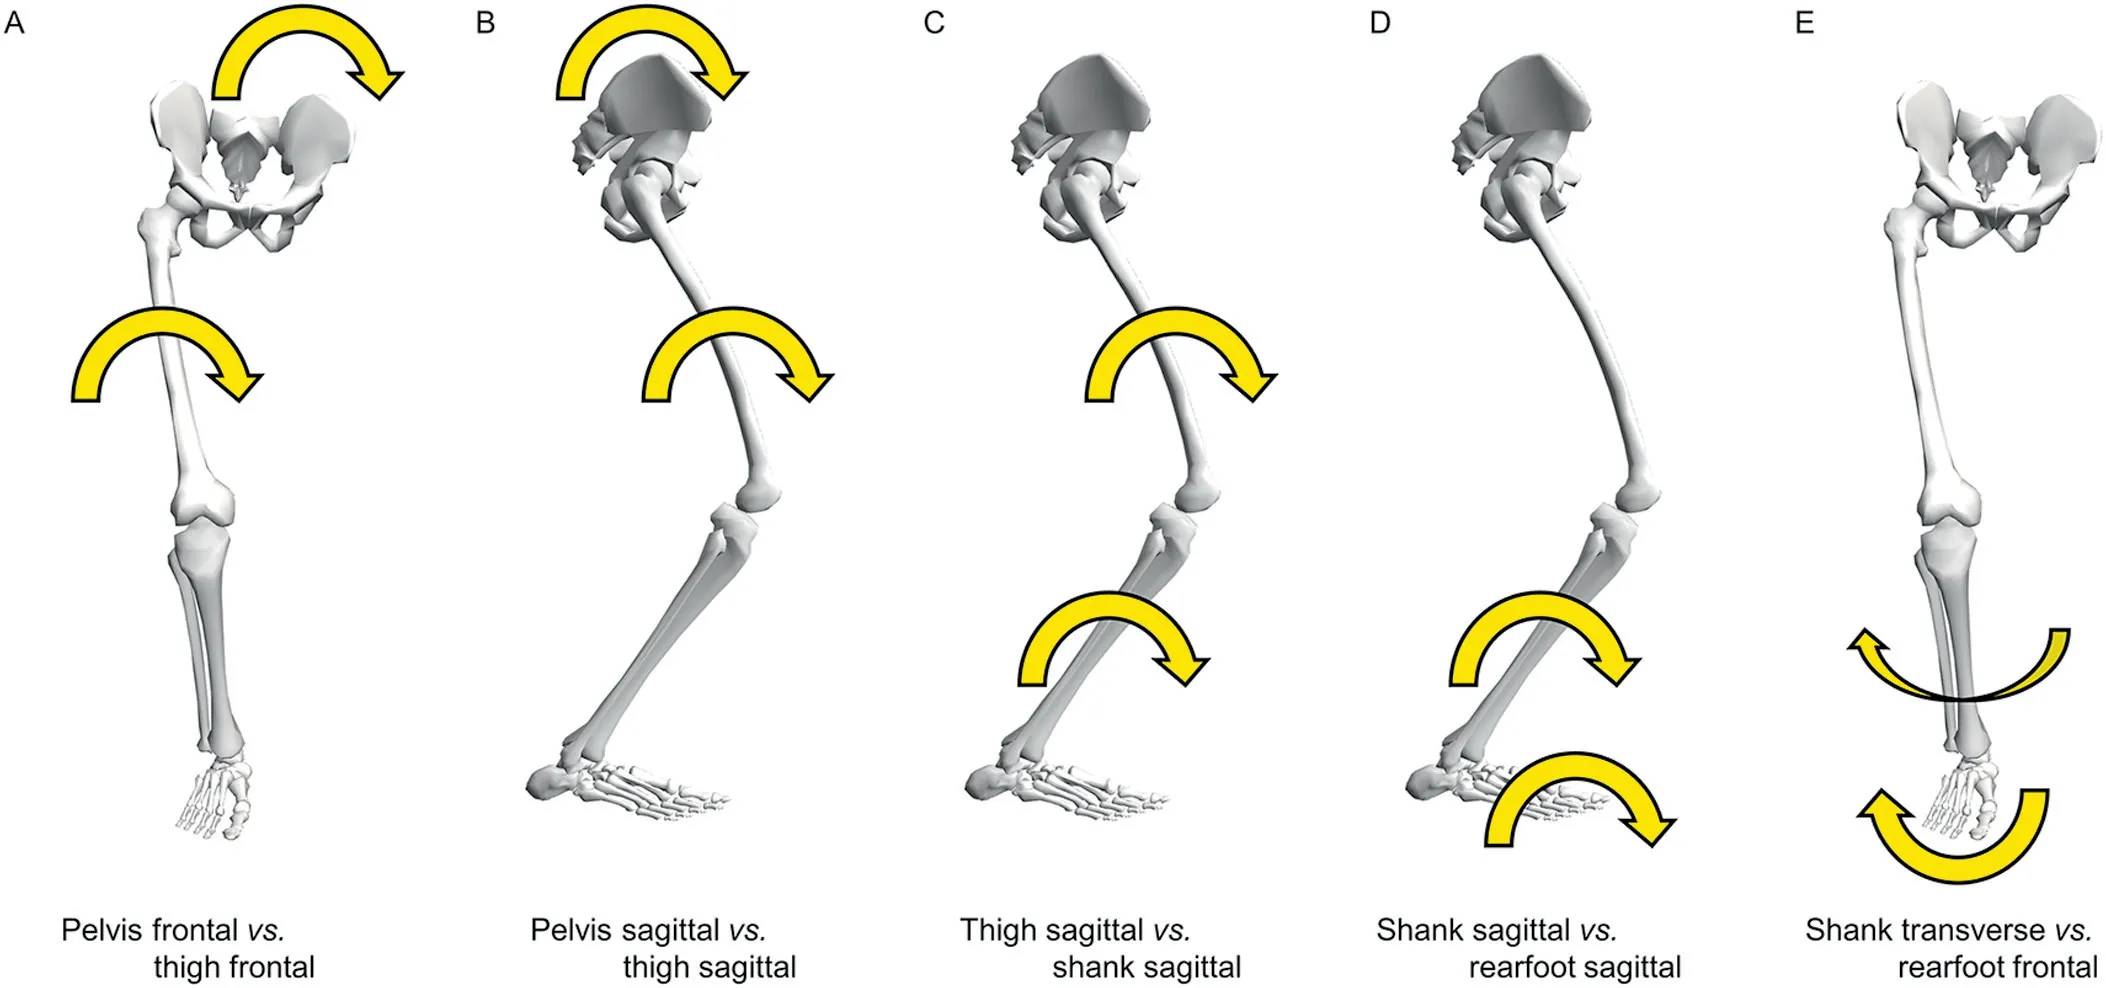
Fig.1. Segment couplings of interest for investigating coordination variability:(A)pelvis frontal vs.thigh frontal;(B)pelvis sagittal vs.thigh sagittal;(C)thigh sagittal vs.shank sagittal;(D)shank sagittal vs.rearfoot sagittal;(E)shank transverse vs.rearfoot frontal.
The ground reaction force of each stride was filtered using a fourth-order 0-lag Butterworth filter with a lowpass frequency of 50 Hz.39The vertical average loading rate(VALR)and vertical instantaneous loading rate (VILR) of initial contact were computed using a previously established method.39The 20%and 80%points of the impact peak were identified in the curve of the vertical ground reaction force.VALR refers to the slope of the line through the 2 points, and VILR refers to the maximum slope of the lines connecting successive data points within the same region.
In a previous study, both segment CVs and loading rates were averaged across 10 strides at each distance checkpoint(2-20 km, at 2-km intervals). A total of 10 strides comprises the sufficient number of gait cycles needed to predict accurately coordination variability.48Computations of all outcome variables were accomplished using a custom MATLAB code(MathWorks,Natick,MA,USA).
2.5. Statistical analysis
The outcome variables were assessed for skewness prior to statistical analysis.Appropriate log data transform was performed if the skewness was found to be greater than§1.0.53Loading rate and segment CVs were compared among the distance checkpoints using one-way multivariate analyses of variances(MANOVAs)repeated measures.The 2 measures of vertical loading rates and all measures of CVs at the early, mid, and terminal stance phases were 4 separate entries in the statistic model.Equality of variances was tested for each comparison, and the p value was adjusted by the Greenhouse-Geisser method when the equality could not be assumed. Any differences following each MANOVA were then established using univariate statistics.If a significant main effect was found, a post hoc analysis was conducted using the least significant difference method.The p value for multiple pairwise comparisons was corrected by the Benjamini-Hochberg method,54which controls for type I errors and false discovery rates while having higher statistical power than other options.55Effect sizes were indicated by the Hedges’g for each significant pair56and interpreted using the Cohen convention57of negligible (<0.20), small (0.20-0.49), medium (0.50-0.79),and large (-0.80) values. All statistics were generated using SPSS software(Version 16.0; SPSS Inc.,Chicago, IL,USA)at an a level of p<0.05.
3. Results
All participants successfully completed the half marathon with an average running speed of 11.37 § 1.49 km/h. VALR and VILR were similar among the distance checkpoints(F=0.623,p=0.881),while segment CVs gradually increased as mileage accumulated. MANOVA reported significant between-subject effects in the early-stance phase (F=1.776,p=0.002).Significant changes in CVs,as indicated by univariate tests, were found in pelvis frontal vs. thigh frontal(F=2.653, p=0.008), thigh sagittal vs. shank sagittal(F=2.915, p=0.004), shank sagittal vs. rearfoot sagittal(F=2.556,p=0.010),and shank transverse vs.rearfoot frontal(F=6.035, p < 0.001) planes at the early stance (Table 1).After correction of significant level, post hoc tests (Fig. 2A)showed that the CV of pelvis frontal vs. thigh frontal was higher at 20 km than at 8 km (g=0.59, p=0.022). Compared to the earlier distance checkpoint (2 km), the CV of shank transverse vs. rearfoot frontal was significantly reduced at 8 km (g=0.30, p=0.020) but increased at 18 km (g=0.05, p<0.001)and at 20 km(g=0.36,p<0.001).The CV of shank transverse vs.rearfoot frontal was also higher at 20 km than at 4 km (g=0.66, p=0.025) and at 8 km (g=0.63, p=0.036)(Fig.2E).
4. Discussion
In this study,we quantified differences in segment CVs and vertical loading rate according to mileages during a half marathon to indicate coordination adaptation and its potential injury risk. We examined multiple-plane coordination variabilities with the hypothesis that, under a controlled condition at the runner’s preferred speed, the segment CVs and loading rate would increase as the half marathon progressed.In partial support of this hypothesis, the participants generally produced higher segment CVs across all couplings of interest and stance phases at the late stage of prolonged running, while VALR and VILR did not change based on running mileages. CVs of the pelvis frontal vs.femur frontal during the early stance were significantly increased at the 20-km checkpoint, compared to those at the 8-km checkpoint. CVs of shank transverse vs.rearfoot frontal during early stance were higher at the 20-km checkpoint than those at the 2-km, 4-km, and 8-km checkpoints.
Runners in our study had decreases in their CVs(2.75%-19.83%)at the early stages of the running trials(within the first 8 km). Because the participants were asymptomatic at the time of the experiments, we speculated that they adopted a conservative coordination strategy to retain stability and balance58,59in response to a non-habitual running environment.44We may have not assigned the participants sufficient warm-up time;there were no measures or standards of complete adaptations in the study. It is plausible that the reduced CVs from the 2-km to 8-km checkpoints reflected the runners’actual coordination under a research condition,though this possibility did not affect the trend in our results.
Following these early-stage adjustments, the runners regained their CV levels across the couplings of interest and produced larger CVs as they progressed to the end of the half marathon. However, statistical significance existed only in the early stance for coordination on the frontal/transverse planes.Our results were in line with those of other studies using discrete kinematic data, which showed changed angulation between adjacent lower-limb segments in marathon finishers.12,16Nevertheless, many studies18,26,27reporting segment coordination found small to no effects of running time or mileage on CVs for healthy runners.Maclean et al.26even reported slightly reduced CVs in a healthy control group during a 30-min run.It is important to note that the participants in these studies finished an apparently shorter distance(approximately 4-5 km)than those in the present study (more than 21 km). Limited running distance may not expose runners to adequate fatigue effects that would trigger detectable changes in coordination patterns for experienced marathoners.60
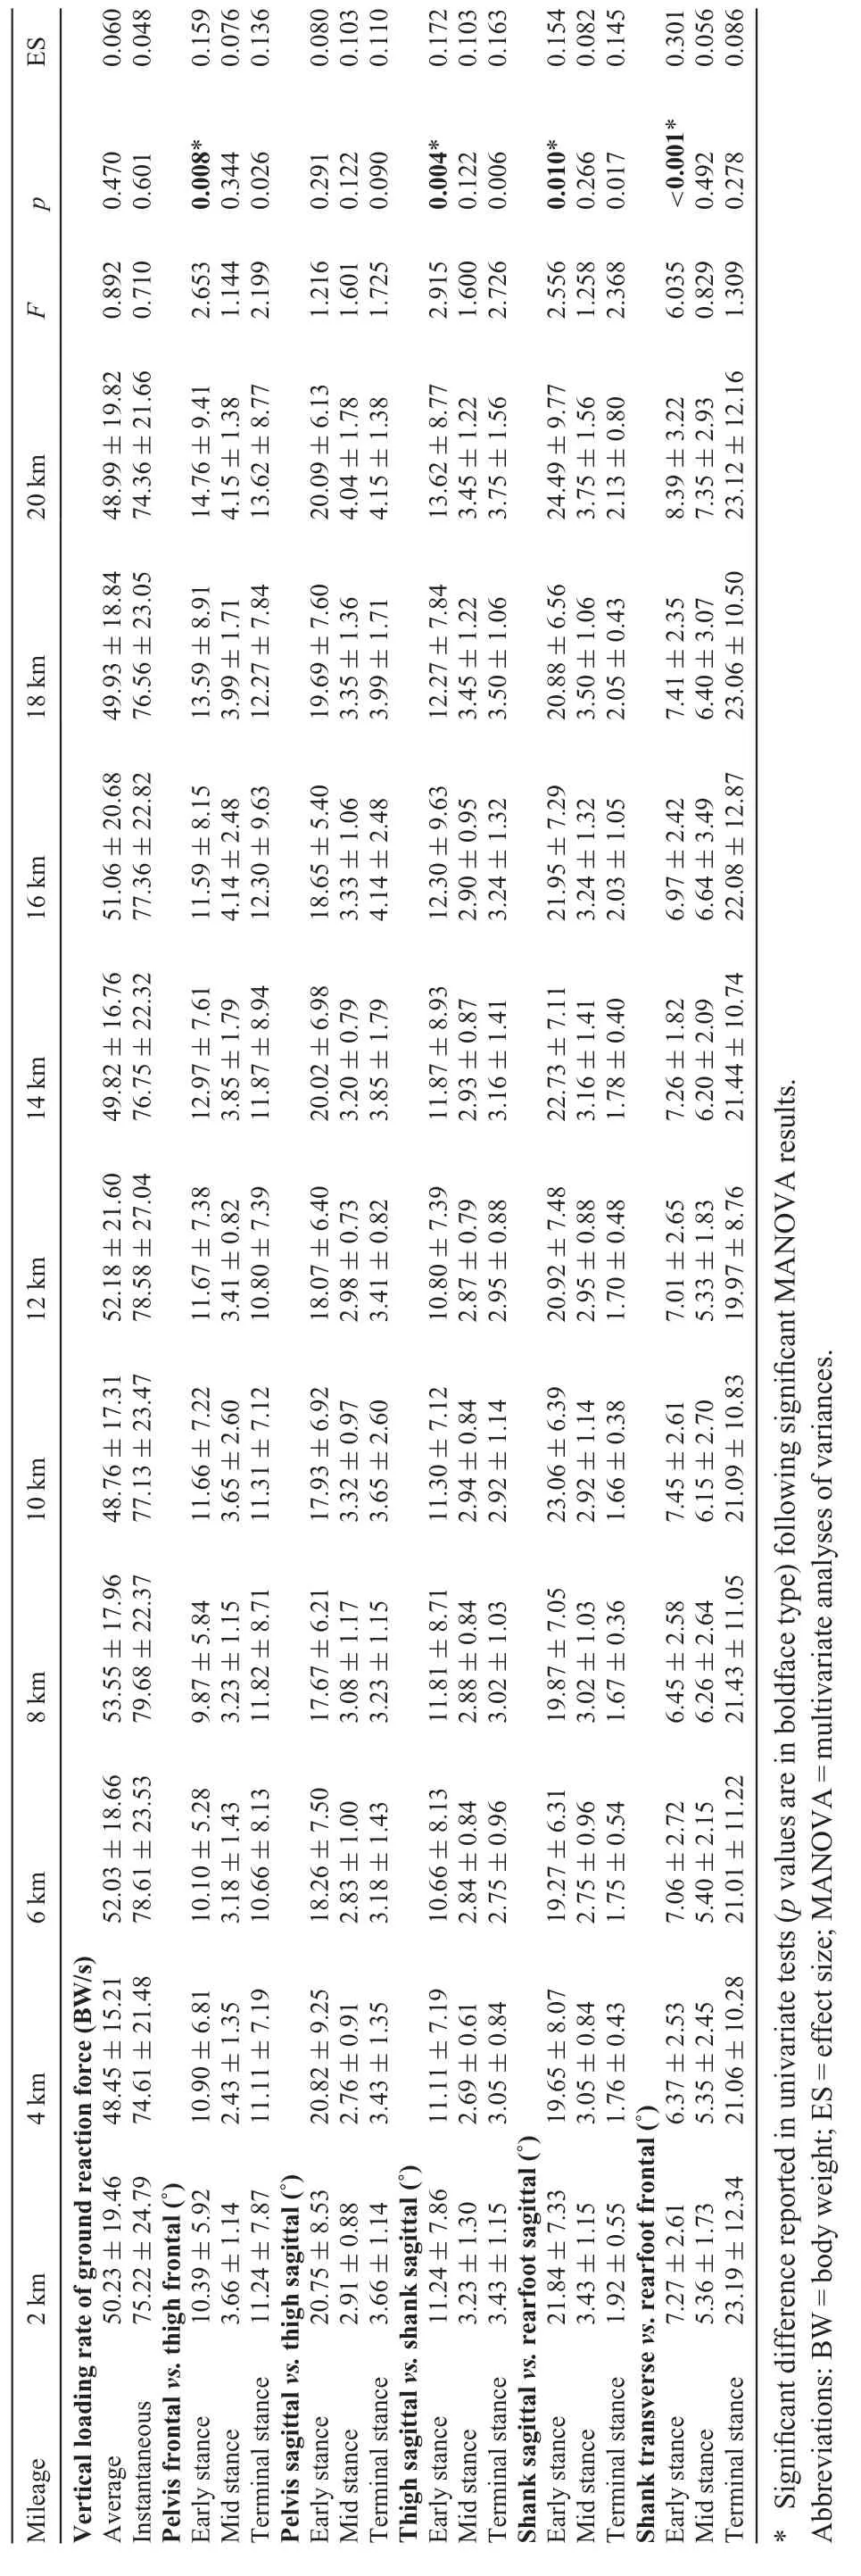
Table 1 Vertical loading rate and coordination variability of segment couplings of interest across the distance checkpoints of a half marathon(mean§SD).
During the early-stance phase of running gait, segment coordination on the sagittal plane is the major component of the lower-limb kinematic chain for loading response.61Following the heel strike, adjacent segments of the lower limb usually rotate in opposite directions62,63to yield negative work for cushioning the landing.An increased CV is thought to indicate changes in this coordinative state and affect impact attenuation.28Our participants did not produce significant alterations in CVs on the sagittal plane during the half marathon; this corresponded with the unchanged vertical loading rate. CVs on the frontal/transverse plane also aid in force absorption at the early stance, though its increments in our study seemed to have limited effects on the loading results.Segment coordination on the sagittal plane is regulated by powerful muscle groups, such as the gluteus, quadriceps, and calf muscles.64In contrast, muscles driving coordination on the frontal/transverse planes are smaller in volume64and are more prone to exertion when resisting external loading. This subsequently interrupts neuromuscular recruitment in the lower limb and introduces variances in coordination patterns.Based on our results, we speculate that the increased frontal/transverse-plane CVs may be the precursor sign of fatigue.The loss of coordination stability could extend to the sagittal plane if the participants were given more running time. Runners undertaking a full marathon or longer run may produce more outcomes that can verify this conjecture.
Although largely speculative, it appears that there is a“normal”range of segment CV in healthy individuals,21which leads to optimal load distribution within the lower limb.65Going beyond this range at early stance could not only cause the ground force to be applied in extreme magnitude21but also could poorly engage the soft tissues.44Increased CVs on the frontal/transverse plane may not be problematic because running is not heavily reliant on lateral/spinning coordination stability. However, if increased CVs on the sagittal plane occur as anticipated,they would induce unaccustomed strains on the internal structures, such as the meniscus and anterior cruciate ligament,21and exacerbate the injury risk.
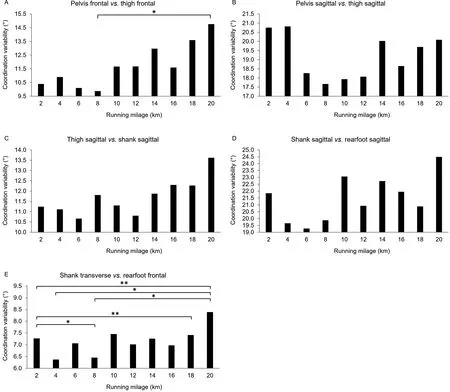
Fig.2. Changes in coordination variabilities of interest(early stance phase)over the course of the half marathon:(A)pelvis frontal vs.thigh frontal;(B)pelvis sagittal vs.thigh sagittal;(C)thigh sagittal vs.shank sagittal;(D)shank sagittal vs.rearfoot sagittal;(E)shank transverse vs.rearfoot frontal.*p<0.05,**p<0.01 in post hoc pairwise comparison.Scale of the y-coordinate:1 unit=0.5˚.
Running involves a linear and cyclic movement that favors a stable coordination pattern,21,44,66which,in turn,challenges runners’ muscular endurance. Training programs for endurance runners should focus on improving the sustainability of their neuromuscular control over a “normal” level of segment CVs. Running-specific strengthening programs are increasingly used to supplement regular running regimens for an injury-free running career.67In light of the results of our study, this training strategy could be particularly helpful for the hip and ankle joints, which possess more mobility on the frontal/transverse plane.68Although a longitudinal study is needed in the future to understand how interventions in training affect the running coordination and injury profile,coaches and sports professionals could use the information given in our study to develop optimal training regimes for individual runners.
Our study had a few limitations. First, the data of the running trials were collected on a treadmill, and the calculated CVs could differ from those of over-ground running.69We considered this limitation negligible because changes in the variables were attributed mainly to increasing running mileages on the same baseline condition.Furthermore,because the running speed was controlled in our research protocol,it could have influenced the coordination profile.70Runners are known to change their running speeds at various stages of an actual marathon or half marathon race.71,72It is unclear how the varying spacing strategy affected the runners’ coordination patterns;this warrants further investigation.Future studies should apply segmental inertia sensors instead of a laboratory-based motion-capture system to assess running movements across different mileages in actual half marathon races. Second, the effect sizes reported in our study were medium to low and may have resulted primarily from the large individual variances in running coordination. This issue may be better addressed by a larger scale study targeting a runner sub-group.Our study reported CV values that generally agreed with those in the literature.18,26,44However, CV-quantifying methods could be slightly modified from time to time to make the outcomes less comparable among various studies. Third, we tended to link our CV results with running-related injuries.However, it is unknown whether the increased CVs reached a pathological threshold.65Given the cross-sectional design of our study,it was impossible to determine the injury risk using the current research protocol.
5. Conclusion
Runners who finished a half marathon showed increased segment CV of the lower limb. These changes appeared to have greater impacts on the pelvis-thigh and shank-rearfoot couplings during the early stance phase.Vertical loading rates to the lower limb were not affected by running mileages. The results from our study suggest that,at the early stance,the runners’ coordination patterns were stable on the sagittal plane but more variable on the frontal/transverse plane as the half marathon progressed, which may be related to fatigue onset.Additional studies should be carried out in this regard before our conclusions can be confirmed.
Acknowledgments
This work was supported by General Research Funds granted by the Hong Kong Research Grant Council(#PolyU152065/17E) and by funding from the National Natural Science Foundation of China(#11732015).
Authors’contributions
TLC participated in the research design, data collection,data analysis, result interpretation, initial manuscript draft,revision, and submission preparation; DWW conducted data analysis and manuscript revision;YW and CT conducted data collection and manuscript revision; WKL and MZ conceived the study,supervised data collection,managed research activities, and revised the manuscript. All authors have read and approved the final version of the manuscript, and agree with the order of presentation of the authors.
Competing interests
The authors declare that they have no competing interests.
 Journal of Sport and Health Science2022年1期
- Journal of Sport and Health Science的其它文章
- Does eccentric exercise stimulate sarcomerogenesis?
- The Beijing 2022 Winter Olympics:An opportunity to promote physical activity and winter sports in Chinese youth
- Beijing 2022 Winter Olympic Games:Commitments to science and public health
- Corticospinal activity during a single-leg stance in people with chronic ankle instability
- Knee biomechanics of patients with total knee replacement during downhill walking on different slopes
- Biceps femoris long head sarcomere and fascicle length adaptations after 3 weeks of eccentric exercise training