
Geographic range size patterns across plants and animals of Xinjiang,China
2022-03-22 10:49LiPingLiChunYanZhangEimearNicLughadhaTarcisoLeKateHardwickYaoMinZhengHuaWeiWanMingMaNurbayAbudusalihYingHaiZhenPuJiangShanLai0ZhanFengShenLiLiuTuoWangYangMingJiangHuiHuiZhaoQingJieLiu
LiPing Li,ChunYan Zhang,Eimear Nic Lughadha,Tarciso C.C.Leão,Kate Hardwick,YaoMin Zheng,HuaWei Wan,Ming Ma,Nurbay Abudusalih,Ying Hai,Zhen Pu,JiangShan Lai0,ZhanFeng Shen,Li Liu,Tuo Wang,YangMing Jiang,HuiHui Zhao,QingJie Liu*
1.Aerospace Information Research Institute,Chinese Academy of Sciences,Beijing 100094,China
2.Royal Botanic Gardens Kew,Richmond,Surrey,TW9 3AE,UK
3.Royal Botanic Gardens Kew,Wakehurst,Sussex,RH17 6TN,UK
4.School of International Economics and Management,Beijing Technology and Business University,Beijing 100048,China
5.Satellite Environmental Application Center of Ministry of Ecology and Environment,Beijing 100094,China
6.Xinjiang Institute of Ecology and Geography,Chinese Academy of Sciences,Urumqi,Xinjiang 830011,China
7.Key Laboratory of Oasis Ecology of Ministry of Education,College of Resources and Environmental Sciences,Xinjiang University,Urumqi,Xinjiang 830046,China
8.Department of Geology,Xinjiang Normal University,Urumqi,Xinjiang 830054,China
9.School of Ecology and Nature Conservation,Beijing Forestry University,Beijing 100083,China
10.State Key Laboratory of Vegetation and Environmental Change, Institute of Botany, Chinese Academy of Sciences,Beijing 100093,China
ABSTRACT Patterns in species geographic range size are relatively well-known for vertebrates,but still poorly known for plants.Contrasts of these patterns between groups have rarely been investigated.With a detailed flora and fauna distribution database of Xinjiang,China,we used regression methods,redundancy analysis and random forests to explore the relationship of environment and body size with the geographic range size of plants, mammals and birds in Xinjiang and contrast these patterns between plants and animals.We found positive correlations between species range size and body size.The range size of plants was more influenced by water variables,while that of mammals and birds was largely influenced by temperature variables.The productivity variable, i.e., Enhanced Vegetation Index (EVI) was far more correlated with range size than climatic variables for both plants and animals, suggesting that vegetation productivity inferred from remote sensing data may be a good predictor of species range size for both plants and animals.
Keywords:range size;body size;Enhanced Vegetation Index(EVI);arid region;conservation
1 Introduction
The extent or area of species' geographical distributions,i.e., range size, is a central metric in macroecology (Blackburn and Gaston, 1996).A wide range of species attributes and environmental variables have been considered to correlate with range size,e.g.,population density (Borregaard and Rahbek, 2010), species dispersal ability (Ceolin and Giehl, 2017), species body size (Inostroza-Michaelet al., 2018), climate (Gallagher, 2016), topography (Liet al., 2016),edaphic characteristics (Genget al., 2012), and evolutionary history (Leãoet al., 2020).Many large-scale range size studies have focused on mammals or birds while studies on plants are scarce,often due to limited data availability.A notable exception is Morueta-Holmeet al.(2013), a study that analyzed 85,000 New World plant species and found that the plant range size was mainly determined by habitat area and climate stability.Aridity and temperature were the primary drivers of range size variation in the Australian flora (Gallagher, 2016).Strong climate seasonality and high climate-change velocity were important factors for Chinese vascular plant range sizes(Xuet al.,2018).
Body size and range size are also intimately related.Range size was found to be positively correlated with body size in mammals and birds (Lindstedtet al., 1986; Tomiya, 2013; Tuckeret al., 2014; Inostroza-Michaelet al., 2018) and in plants (McGloneet al., 2010), while non-significant or negative correlations were also found (Dombroskie and Aarssen,2010;Outomuro and Johansson,2019).
Body size is generally well-recorded based on consistent metrics for animals in regionally published books or worldwide databases.In contrast, measuring the body size of plant species is not as straightforward and may include different metrics,e.g., stem height,biomass, and seed size.Height seems the most frequently used indicator of plant body size (Dombroskie and Aarssen, 2010).The study by Yuet al.(2018) focusing on patterns of maximum height among endemic woody species in China is an example of the use of plant height as a macroecological indicator.With the development of LiDAR technology,large-scale forest canopy height data are more easily obtained, creating opportunities for research on global patterns of canopy height (Taoet al., 2016; Zhanget al., 2016).However, these studies included data only on trees while neglecting shrub and herb species,which are the majority growth forms in many non-forest ecosystems.For example, in Xinjiang, herbs can make up 87% of all plant species present (Liet al.,2011).Thus, it is important to include herbs in the analysis for a more comprehensive understanding of plant height patterns across ecosystems.Data from regional flora are reliable data sources for plant height and easily available, and were recorded under the same criterion,so we used this data in our analysis.
To date, most reported research has been conducted within a single group of organisms.Potential differences in range size patterns between plants and animals from the same region have not been tested and productivity has often not been considered a predictor of species range size.With a detailed species distribution database for flora and fauna of Xinjiang, China,we aim to (i) analyze the relationship of range size with body size and environmental variables for plants,mammals, and birds; and (ii) compare the correlation,effect sizes and relative importance of each predictor among the three groups of organisms.
2 Materials and methods
2.1 Study area
Xinjiang, a hyper-arid area, is located in central Asia, with a mountain-basin topography.It covers 1.64 million km2with diverse environments which is an ideal region for testing the relationship between range size,body size and environmental variables.Xinjiang is home to about 3,600 native vascular plant species belonging to 740 genera and 120 families; 154 mammal species representing 23 families and 7 orders;and 425 bird species representing 56 families and 21 orders(Liet al., 2013).Species richness, including plants,mammals, and birds is relatively high in mountains and low in basins due to the generally greater availability of water in the mountains(Liet al.,2013).
2.2 Species data
Plant height (average, minimum and maximum),as a proxy for plant body size, was collected mainly from local floras such asFlorae Xinjiangensis(Commissione Redactorum Florae Xinjiangensis,1992-2011).These data are originally mostly based on field surveys, a reliable systematic data source.Data from online databases,e.g.,Flora of China(http://www.iplant.cn/foc),and literature were also checked.
Mean weight of mammals and birds,indicating animal body size, were based on Wilmanet al.(2014),local checklists (Ma, 2001; Apdukader, 2002), andA Guide to the Mammals of China(Smithet al., 2010).Distributions of the three groups were obtained from published databases (Liet al., 2011; Liet al., 2013)which are primarily based on county level records.We divided the Xinjiang region into 0.1°×0.1°grid cells and mapped the species in the cells.Based on this,we used the number of the grid cells in which the species occur as a proxy of range area (RA), and the number of grid cells between the easternmost and westernmost cells as east-west extent (extent EW), and between the southernmost and northernmost cells as north-south extent (extent NS).We assume the range area is around 10,000 km2,i.e., 100×(10km×10km),when a species appears in 100 grid cells.These three variables range area,extent EW and extent NS together were regarded as range size; for detailed descriptions see Liet al.(2017b).As the patterns obtained for the three variables are similar,we show mainly the results for range area.
Finally,3,100 species of plants,142 species of mammals and 409 species of birds were included in this study and species without detailed distribution or plant height or animal body mass information were omitted.
2.3 Environmental data
Topographical data with a resolution of 0.0083 arc degree (equivalent to 1 km at the equator) were obtained from the United States Geological Survey(USGS).The altitudinal ranges were calculated at 0.1° resolution (about 10 km) with the difference between the max and min altitude in one grid cell.The climate data were obtained from the World-Clim Database (Hijmanset al., 2005), including temperature seasonality (Standard deviation ×100)and precipitation seasonality (coefficient of variation)(https://www.worldclim.com/bioclim).The monthly temperature and precipitation from the WorldClim Database were used to calculate the other climate variables (Liet al., 2013),i.e., mean annual temperature(MAT),mean annual precipitation(MAP),potential annual evapotranspiration (PET), actual annual evapotranspiration (AET), and water deficit (WD).Finally,we chose MAT,MAP,temperature seasonality,and precipitation seasonality as climate variables in our analysis.The Normalized Difference Vegetation Index(NDVI), and Enhanced Vegetation Index (EVI) were extracted from the monthly MOD13A3 VI products of 2001 to 2015, and we finally chose EVI as the indicator of productivity.The selection of the variables was mainly based on the preliminary stepwise regression analyses and for the simplicity of the final results.
2.4 Data analysis
To examine the relationship between range size and environmental variables, firstly, ordinary least square (OLS) regressions were conducted to detect the best single variable for explaining range size patterns.We then divided the independent variables into temperature (MAT, temperature seasonality), water(MAP, precipitation seasonality), body size (height of plants, weight/body mass of animals), topography (altitudinal range),and vegetation productivity(mean annual EVI),and the dependent variables range area,extent NS and extent EW.After the normality test, we log2-transformed plant range area, mammal range area, plant height, mammal body mass and bird body mass,and left other variables as the raw data.We then conducted variance partitioning analysis with Redundancy Analysis (RDA) to further split the effects of different types of variables.Then, we built multiple OLS regression models to find the variables' partial explained variance.Then, random forest analysis was conducted to distinguish the relative importance of the variables for influencing the species range size(Li,2013;Lyuet al.,2020).
3 Results
3.1 Plant range size and height patterns
Our analyses included 118 species of trees, 342 species of shrubs and 2,643 species of herbs.The mean range area was 1,429 grid cells when considering all plant species(median=392),2,966 cells for trees(median = 810 cells), 1,645 cells for shrubs (median =482), and 1,366 for herbs (median = 378).Among the species with the narrowest ranges were, for example,
Orchis militaris,Delphinium kaschgaricum, andEutrema salsugineum, while examples of wide-ranged species includedPopulus nigra, Plantago depressa,and
Persicaria orientalis.The mean height of plant species was 0.64 m overall (median = 0.36 m), 10.4 m for trees,1.1 m for shrubs,and 0.42 m for herbs(with medians 6.4,0.72,0.32 m,respectively).For example,Microula tibeticaandGentianella pygmaeawere among the smallest herbs, whilePicea schrenkianaandPopulus nigrawere among the tallest trees.
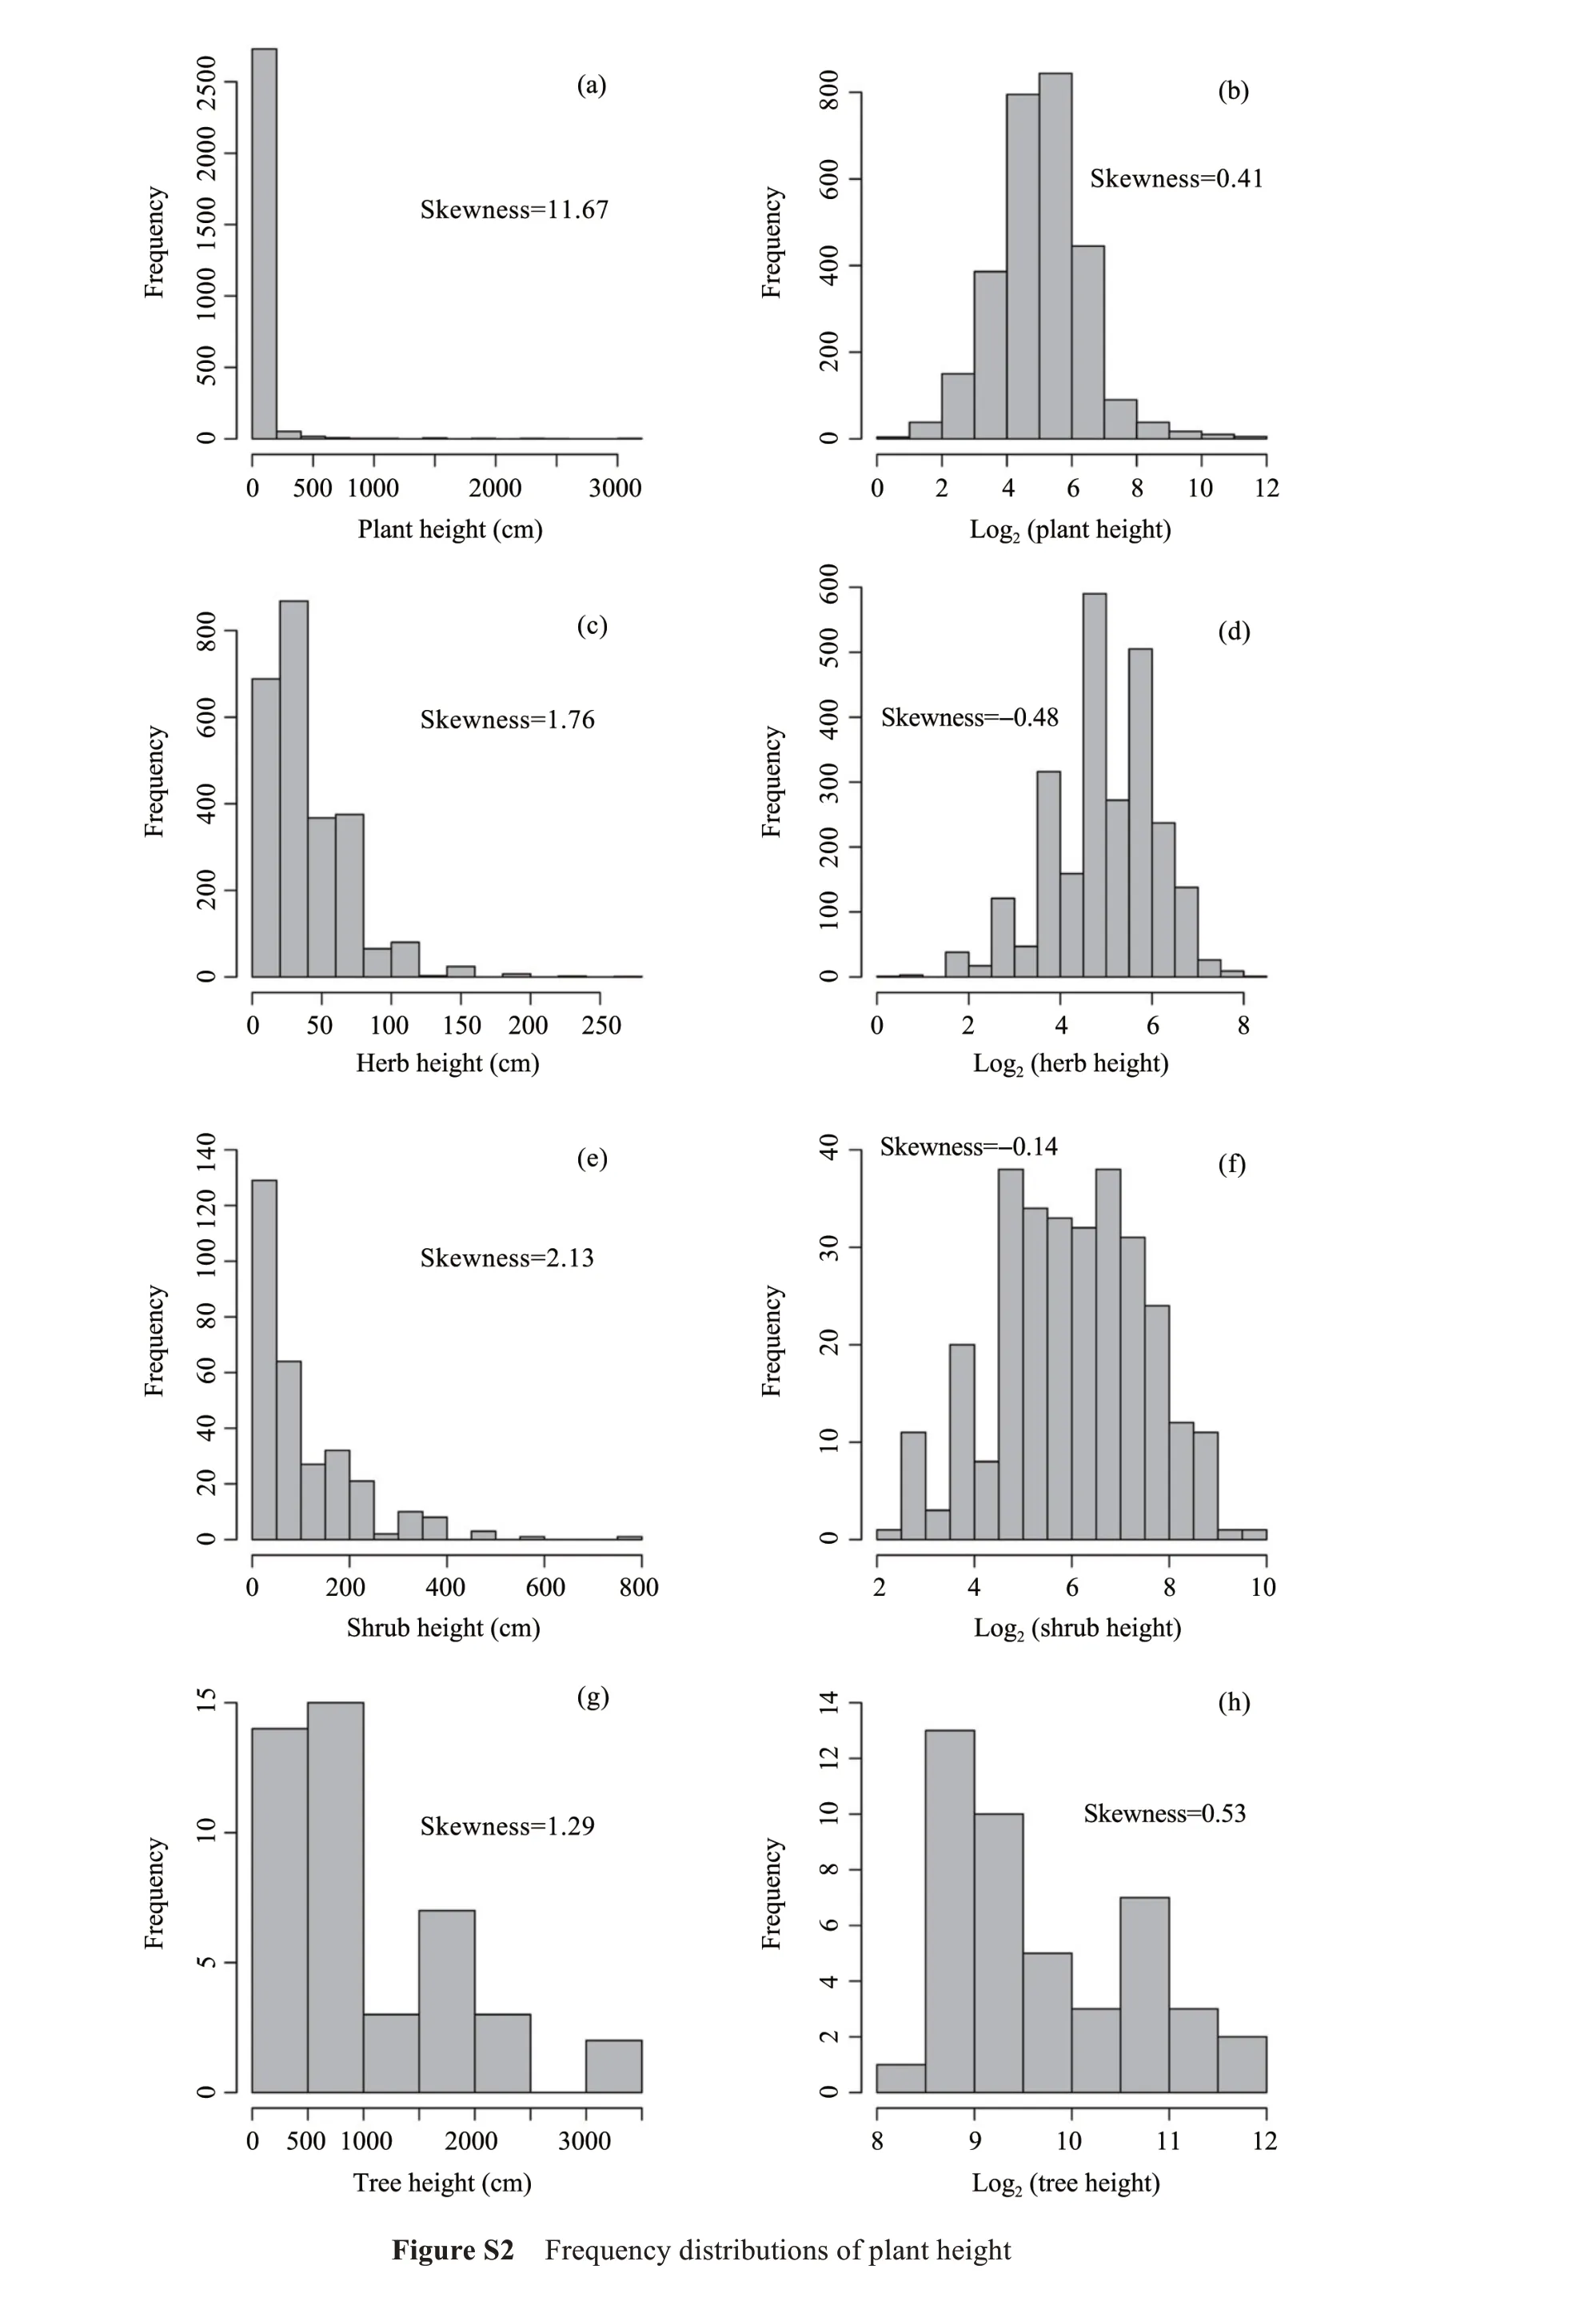
The distribution of range area and height of plants,including trees, shrubs and herbs were right-skewed distributions, which meant that most species had small range size,i.e., restricted distributions (Figure S1),and low height(Figure S2).
We found slight positive correlations between plant range area and height both for plants as a whole and for herbs, while this correlation was non-significant for shrubs and trees(Figure 1).
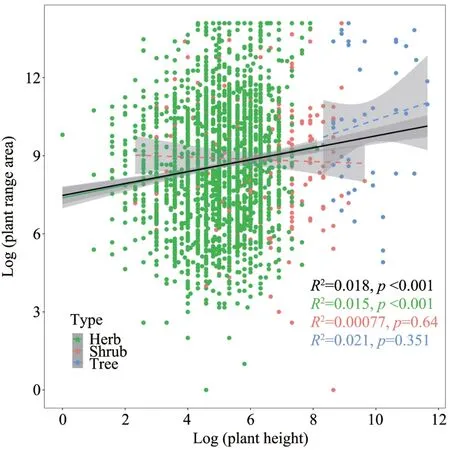
Figure 1 The correlation of plant range area and height(herb,shrub and tree in green,red and blue color,respectively).The black line is the correlation line for whole plant species
Plant range area showed positive relationships with MAT(R2=0.05,p<0.001),temperature seasonality(R2=0.02,p<0.001) and precipitation seasonality (R2=0.07,p<0.001), and negative relationships with altitudinal range (R2=0.09,p<0.001), MAP (R2=0.16,p<0.001)and annual mean EVI(R2=0.17,p<0.001;Figure 2).

Figure 2 The correlation of plant range size and environmental variables
3.2 Range size and body size characters of mammals and birds
The mean weight of both mammal and bird species was right-skewed, with most species having low weight.The range area within the Xinjiang region was more right-skewed for mammals than birds(Figure S3).
For mammals,the mean range area within the Xinjiang region was 3,653 cells (median = 2,248 cells).The mammal species with the narrowest range wasAlces alces(moose), while the species with the broadest range wasMus musculus(house mouse).The mean weight was 24,405 g (median = 143 g).Sorex minutus(shrew)was the lightest mammal species in our dataset for Xinjiang, whileCamelus bactrianus(camel)andBos grunniens(yak) were among the heaviest mammals.
For birds,the mean range area within the Xinjiang region was 7,181 cells (median = 6,869 cells).Examples among the narrowest ranged species wereAnas angustirostrisandGavia arctica.Among the bird species with the broadest range wereUpupa epops(common hoopoe) andCorvus corax(common raven).The mean weight was 616 g (median = 75 g).Among the lightest and heaviest bird species wereRegulus regulusandCygnus olor,respectively.
Mammal species weight and range area were positively correlated but showed low predictive capacity(R2= 0.05,p<0.01, Figure 3a).For birds, the weight and range area relationship was non-significant (R2=0.006,p=0.12,Figure 3b).
3.3 Comparison of environmental correlates of range size in plants and animals
Similarly to plants (Figure 2), the range area of mammals and birds was positively correlated with MAT (R2= 0.16-0.17,p<0.001), temperature seasonality (R2= 0.01,p<0.05 for birds and non-significant for mammals), and precipitation seasonality (R2=0.07-0.06,p<0.01), and negatively correlated with altitudinal range (R2=0.11,p<0.001), MAP (R2=0.19-0.15,p<0.001) and mean annual EVI (R2=0.14 - 0.13,p<0.001;Figures 4,5).
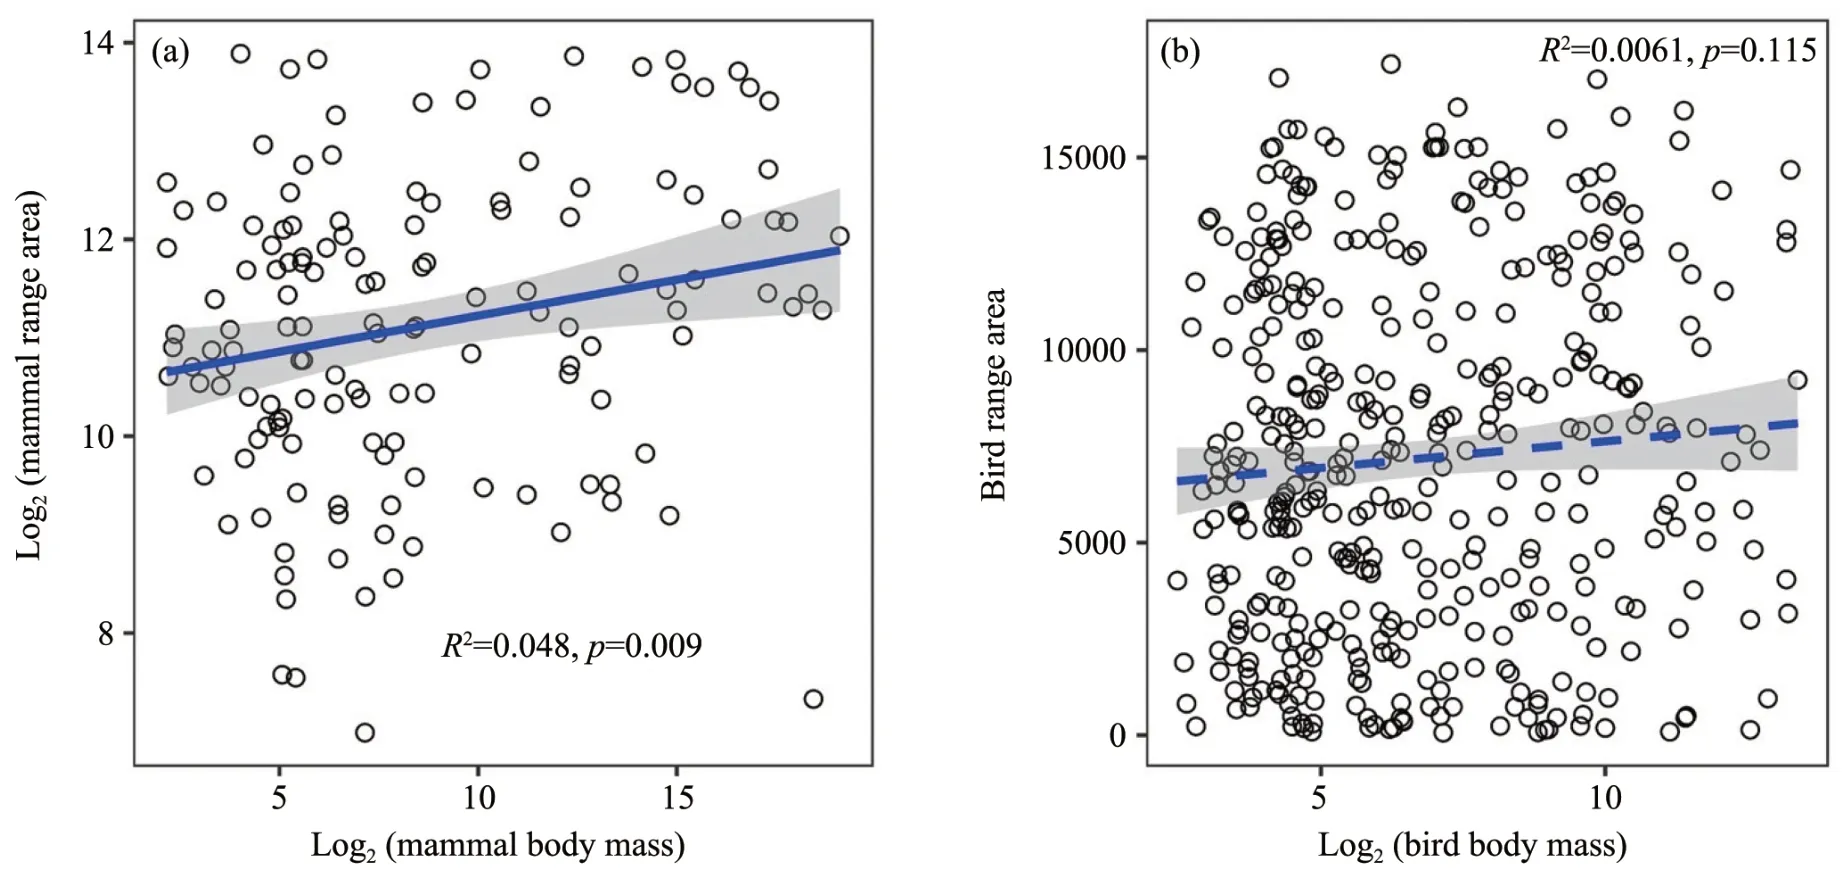
Figure 3 The correlation of body mass and range size of mammals(a)and birds(b)(insignificant for birds with dashed line in(b))

Figure 4 The correlation of mammal range size and environmental variables(insignificant for temperature seasonality with dashed line in(d))
When including temperature, water, body size, topography, and vegetation productivity as independent variables, and range area, extent NS and extent EW as dependent variables in a redundancy analysis (RDA),the range size of plants and animals was negatively correlated with EVI,MAP and altitudinal range,while positively correlated with MAT, precipitation seasonality,height/weight and temperature seasonality(Figure 6).
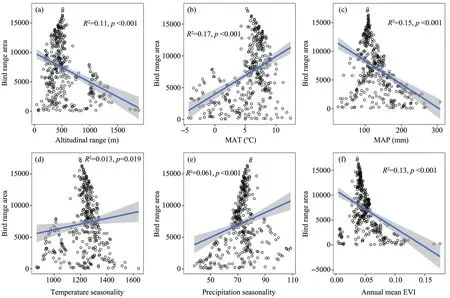
Figure 5 The correlation of bird range size and environmental variables
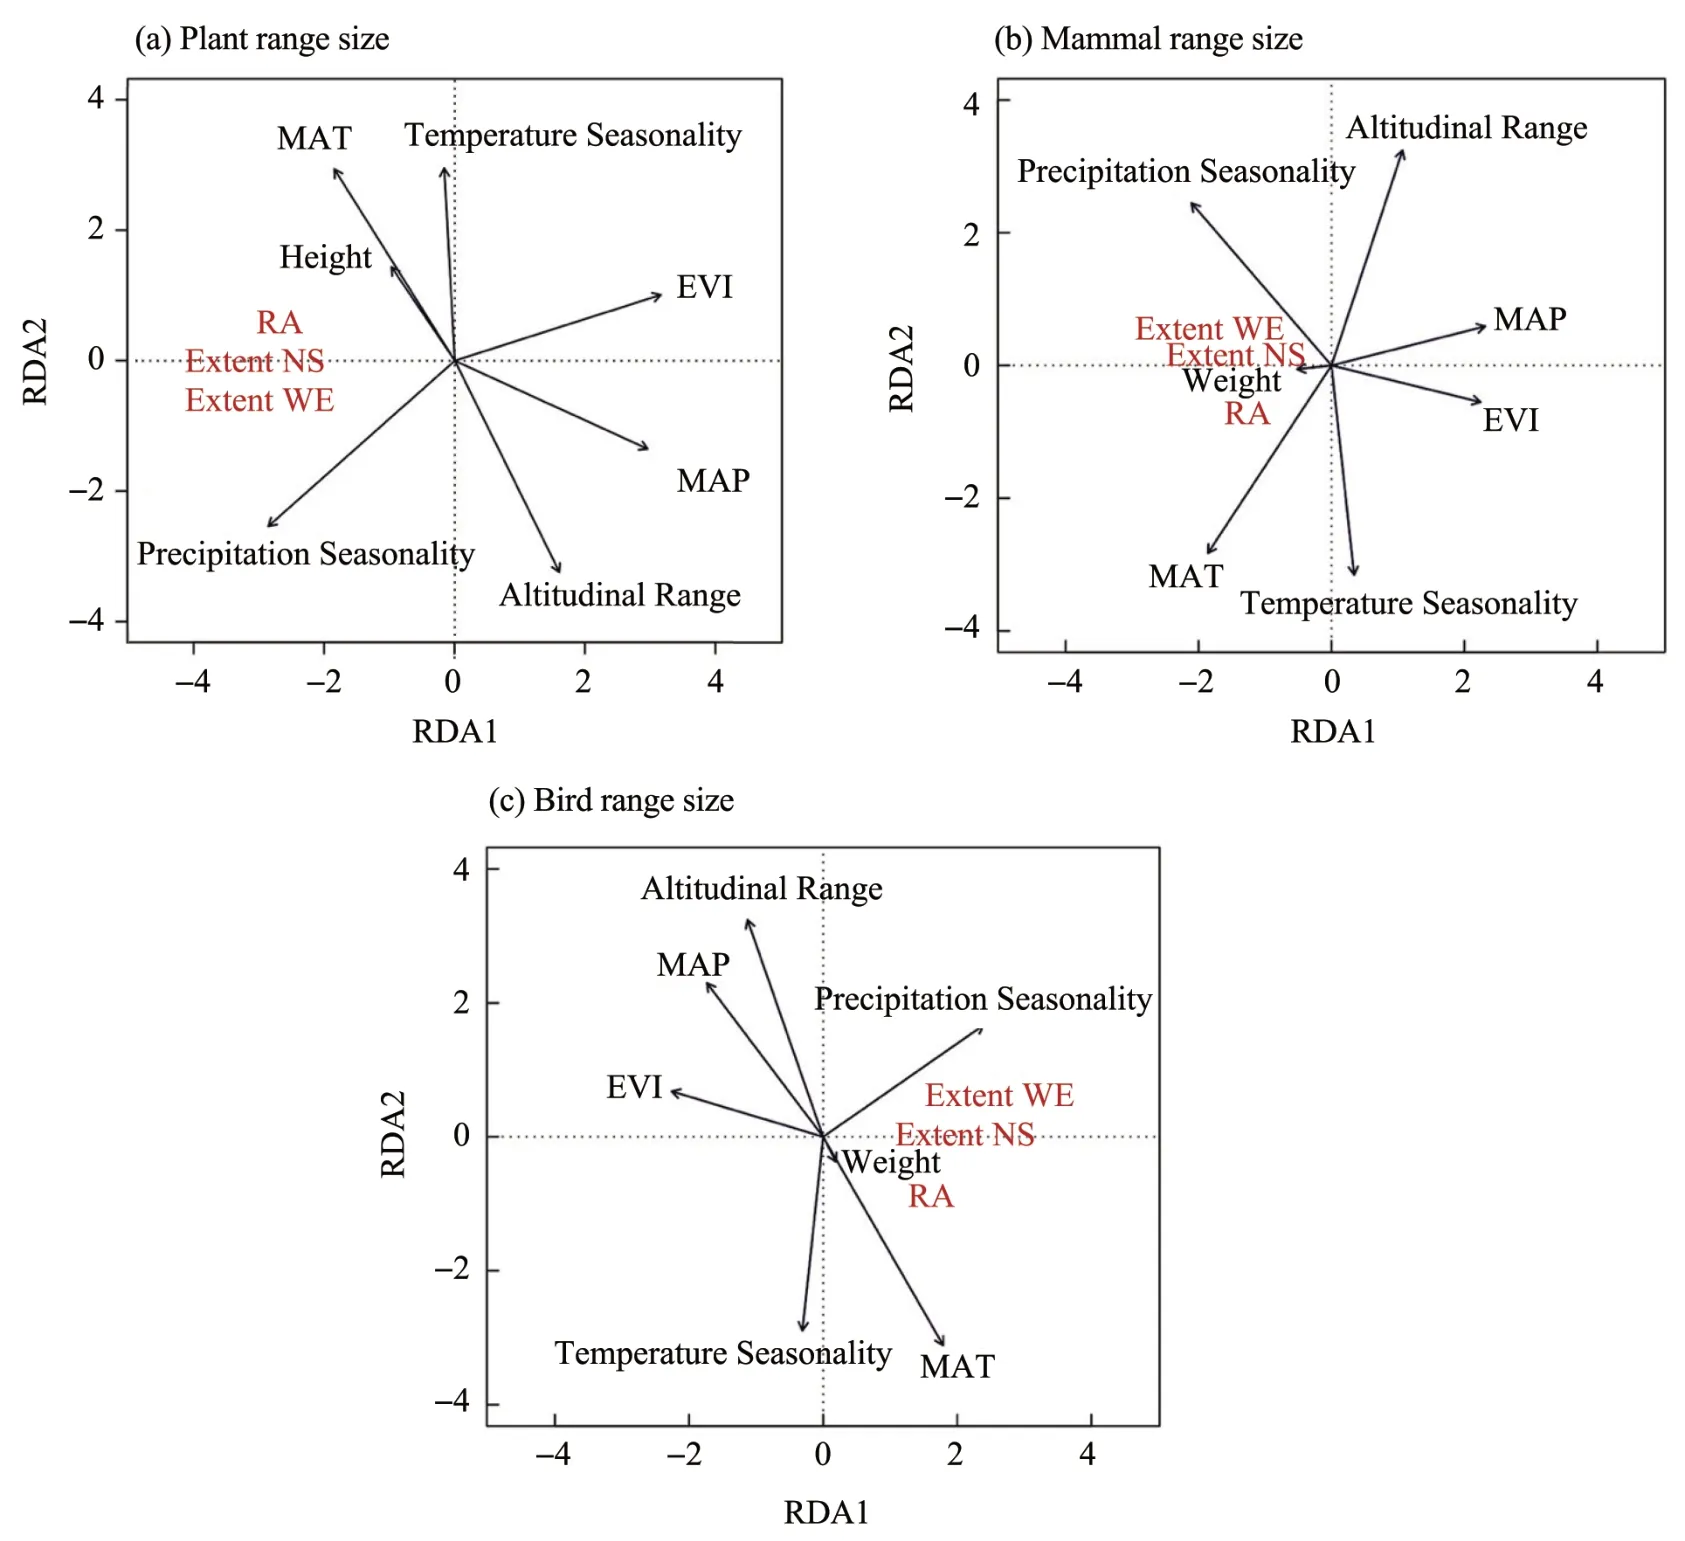
Figure 6 The RDA analysis of range size and environmental variables,body size
To further compare the effects of water and temperature variables, we performed multiple regression models.The range area of plants was better explained by water variables (i.e., MAP, precipitation seasonality), even when controlled for the effects of temperature variables; while the range area of mammals and birds was better explained by temperature variables if we put the climate variables in the model first (Table 1); However, the variance explained by these predictors substantially overlaps with the variance explained by the productivity variable (EVI), which was the variable most consistently associated with range area across groups of organisms(Table 1).
To verify the consistency of the results across analytical methods, we also conducted a random forest analysis.We calculated the relative importance of each variable as a predictor of range area.We found that EVI was the best predictor of species range area for plants, mammals and birds.The results also pointed to a temperature variable (i.e., MAT) as an important predictor of the mammal and bird species range size(Table 2).

Table 1 The percentage of the variation in plant or animal range size explained by temperature,water,body size,topography,and vegetation productivity according to multiple regressions and their ANOVA decompositions
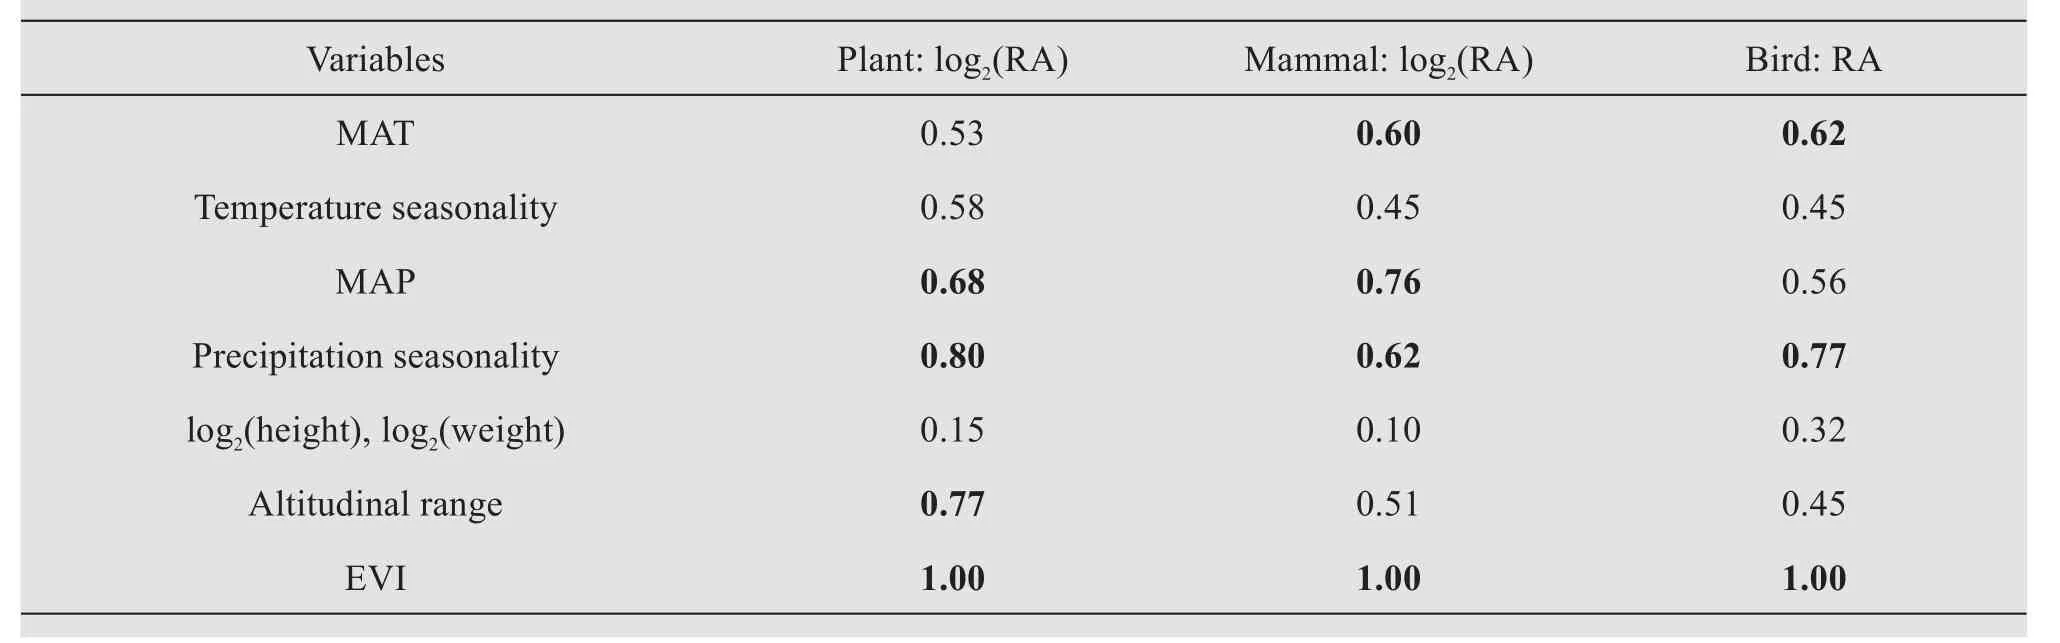
Table 2 Relative importance of the variables(values are relative to the largest,set to 1.00)to predict the species range area,according to the increase in node purity with a random forest analysis.Values ≥0.6 are in bold
Considering the results across analytical methods,we found that range size patterns of plants and animals are generally concordant,i.e., showing similar correlations with the broad groups of environmental variables.However, the relative importance of each variable varies among groups of organisms, with water variables being more important for plants,and temperature variables more important for animals.In addition, we found that productivity is a good predictor of species range size for plants and animals in the Xinjiang region.
4 Discussions
4.1 The body size and range size relationship
Our results suggest that species geographic range size within the Xinjiang region is correlated with body size,productivity,topography and climate.However, the range size and body size relationship was weak when compared to the range size and environment relationship.There was a positive relationship between plant range size and height(mainly driven by herbs), and mammal range size and body mass, while the relationship was not statistically significant for birds.The positive body size and range size relationship is consistent with findings in the literature (Gaston and Blackburn, 1996; Inostroza-Michaelet al.,2018).For example, taller plants were found to have larger range sizes in German forests (Kolbet al.,2006).The weak relationship of our study, especially birds, might be associated with the geographic coverage data being limited to the Xinjiang region, while species distributions often go beyond this region.Artificial truncation of the species range can reduce the strength of the relationship between range size and body size (Gaston and Blackburn, 1996).In contrast,the body size of North-American dragonflies(Libellulidae) did not predict range size, while wing shape and migratory status were more important predictors(Outomuro and Johansson,2019).
The positive range-height relationship for plants might be associated with a competitive advantage of taller plants in the region and perhaps a higher dispersal capacity.In arid/semi-arid floras in Australia,plant species adapted for dispersal by vertebrates were found to have larger range size,on average(Oakwoodet al., 1993).The positive range-height pattern was previously found in Xinjiang based on plots encompassing a much smaller number of species than in the present study (Liet al., 2017c).Here, using a larger dataset of species from the entire Xinjiang region, we confirmed the positive range-height pattern on a larger geographic and taxonomic scale.
Some small mammals with extensive ranges in the region (e.g.,Mus musculus) may have affected the relationship between range size and body size in mammals, leading to a weaker relationship.For birds, perhaps the large extent of homogeneous habitats,e.g.,desert, may have been associated with greater ranges.Together with the range truncation, these might explain the lack of correlation between body size and range size among birds.
4.2 The environmental correlates of range size
In our analysis, we divided environmental variables into four categories:water,temperature,topography and productivity.We then selected some of the most frequently used environmental variables in the diversity/range size research in each category and conducted the statistical analyses.We found a pattern across groups of organisms (i.e., including both plants and animals) of positive relationships between range size and MAT, temperature seasonality,precipitation seasonality, and negative relationships between range size and MAP, altitudinal range and EVI.
On a global scale, large-ranged terrestrial vertebrates seem associated with lower precipitation seasonality and lower topographic heterogeneity in their ranges (Liet al., 2016).Our results for mammals and birds also showed a negative relationship between range size and altitudinal ranges, but a positive relationship for both temperature seasonality and precipitation seasonality.In the Xinjiang region, largeranged species occurred preferentially in homogenous environments,i.e., in deserts, where the topographic variance is relatively small,and the climate seasonality is large.In contrast, species with small range sizes were concentrated in the mountains, thus associated with higher altitudinal ranges and lower climate seasonality.
From the results of the regression models, random forests and redundancy analyses, we found that temperature variables were better at predicting the range size of animals than of plants compared with water variables.This finding needs more verification in future research comparing range size patterns between plants and animals.Furthermore, we found that productivity strongly predicts both range sizes of both plants and animals.Productivity variables were not widely used in earlier range size research.But remote sensing data is becoming increasingly available and precise, including some new types of satellite data,e.g., sun-induced fluorescence data, and offers great potential as a comprehensive indicator of environment,and a good surrogate for climatic variables.
4.3 Implications for regional biodiversity conservation
Our range size and body size results have implications for regional biodiversity conservation and prioritization because range size is generally the strongest predictor of extinction risk in plants (Nic Lughadhaet al., 2018) and animals (Böhmet al.,2016) and simulations indicate that the probability of ecosystem collapse increases rapidly as range size declines(Murrayet al.,2017).Furthermore,the power of combining consideration of range size and body size for extinction risk prediction has been demonstrated in recent animal studies focused on single groups, from beetles (Nolteet al., 2019) to vertebrates (Newsomeet al., 2020).Extending these approaches to the flora and fauna of whole regions offers the potential to address some of the recognized limitations of the hotspot approaches widely used for conservation prioritization and planning globally(Myerset al.,2000)or locally(Liet al.,2017a).Specifically, we contend that including a greater range of strong predictors, such as the combination of range size and body size,could counteract the recently reported (Shresthaet al., 2019) under-representation of range-restricted species resulting from hotspot approaches to prioritization.
Our research presents the first report of range size and body size patterns of plants and animals in the Xinjiang region.The congruence patterns we report indicate an exciting opportunity to plan future biodiversity conservation in an integrated manner for plants and animals.We suggest that more exploration is needed of range size and body size patterns across major groups of organisms on regional scales, as well as on their relationship to extinction risk, to test and quantify their utility for conservation planning.
5 Conclusions
Based on a reliable plant and vertebrate species database of Xinjiang, China, relationships of environment and body size with the geographic range size of plants, mammals, and birds were thoroughly explored.On a species level, we concluded that: (1)there were generally positive correlations between species range size and body size in both plants and vertebrates; (2) water variables were more important for plant species range size, while that of vertebrate range size was largely influenced by temperature variables; (3) remote sensing indicators could be good predictors of species range size for both plants and vertebrates.
Acknowledgments:
This work was supported by the Strategic Priority Research Program of Chinese Academy of Sciences(XDA26010101), the National Key Research and Development Program of China (2020YFC0832800),National Natural Science Foundation of China(41801366, 52101405), and NSFC-RS exchange project between China and UK (42011530175).Prof.J.Y.F., Dr.Z.Y.T.and Dr.Z.H.W.from Peking University,China helped with initial ideas of the paper.We are grateful to everyone who have contributed to the ideas and data collection, including especially Dr.X.L.from Peking University and G.P.W.from Xinjiang Institute of Chinese and Ethnic Medicine, China.We thank Dr.B.W.and Dr.S.B.from Royal Botanic Gardens,Kew for the discussions on data analysis.We thank the editor and two anonymous reviewers for their valuable comments.
Supporting information


 Sciences in Cold and Arid Regions2022年1期
- Sciences in Cold and Arid Regions的其它文章
- Research progress on behaviors and environmental effects of mercury in the cryosphere of the Tibetan Plateau:a critical review
- Numerical simulation of vibrational response characteristics of railway subgrades with insulation boards
- Desertification status mapping in Muttuma Watershed by using Random Forest Model
- Simulating the effect of wind erosion on aeolian desertification process of Horqin sandy land and its significance on material cycle:a wind tunnel study
- Spatial and temporal patterns of solar radiation in China from 1957 to 2016
- Guidelines to Authors